WTI (Crude Oil) - Bullish SetupWTI has been trading under this trendline since March' 2022. Inflation adjusted oil is the cheapest commodity avaiable currently and the type of bull run we have seen in all other commodties since last year, i expect it is oils turn to shine now. Tracking this trendline closely, and once it is broken, i expect oil to run upwards pretty fast. Eyes Open!
Chart Patterns

STARHEALTH 1 Week Time Frame 📊 Current Price Context
Latest share price is around ₹460–₹470+ in early Feb 2026 trading sessions.
📈 Key Short-Term Levels (1-Week Timeframe)
🔹 Pivot / Central Reference
Pivot Point: ~ ₹459 – this is the mid reference for the week.
📌 Resistance Levels (Upside)
R1: ~ ₹464
R2: ~ ₹470–₹472
R3: ~ ₹476
These act as potential upside barriers where prices could stall. Higher resistance levels mean stronger short-term selling pressure usually appears there.
📉 Support Levels (Downside)
S1: ~ ₹453
S2: ~ ₹447
S3: ~ ₹442
Support zones where buying interest could re-emerge on weakness.
📌 Short-Term Momentum & Indicators
1-week performance: Slightly negative/slightly lower → indicates mild short-term weakness.
Oscillator and moving average summary on TradingView shows more of a neutral to mixed bias without a decisive short-term signal.
📊 52-Week Range (for reference)
52-week high: ~ ₹533–534
52-week low: ~ ₹327–330
This gives context for broader strength/weakness beyond the 1-week frame.
📌 How to Use These Levels
Bullish scenario: Break above ₹470–₹472 with volume suggests shift toward stronger short-term strength.
Bearish scenario: Failure below ₹453 could lead to test of lower supports like ₹447–₹442.
Range: Between ₹453–₹472 often acts as the 1-week trading zone unless strong catalysts emerge.

XAGUSD 1H Bearish Trendline Rejection📉 Market Structure
Primary trend: Bearish
Price is making lower highs & lower lows
Clear descending channel visible
The recent rally looks like a corrective pullback, not a trend reversal
🔴 Key Rejection Zone
Resistance: 83.50 – 84.20
Price has been rejected exactly at the descending trendline
Bearish reaction candle + arrow confirms seller dominance
📊Pattern Insight
Structure resembles a bear flag / falling channel
Impulse down → consolidation → rejection → continuation expected
Trendline break did NOT happen → bearish continuation favored
❌ Invalidation
Hourly close above 85.00 setup
Clean breakout + hold above descending trendline→ would delay or invalidate bearish setup

ANGEL ONE - WEEKLY Fibonacci Structure
The Fibonacci retracement is from the major low near 995 to the peak around 3,900. The correction after the rally has been shallow, indicating strength in the broader trend. The 61.8% level near 2,100 has repeatedly acted as a strong demand zone. The 50% retracement around 2,445 continues to behave as a key equilibrium level.
Support and Resistance Zones
The 2,050–2,150 zone remains a major long-term support, supported by multiple price reactions and Fibonacci confluence. On the upside, the 3,800–3,900 region acts as a strong supply zone, resulting in repeated rejections. A descending trendline from the highs is acting as dynamic resistance. The 2,400–2,500 band serves as a critical range midpoint.
Volume Analysis
The rally from lower levels was accompanied by expanding volumes, confirming strong participation. During the consolidation phase, volumes have contracted, indicating a time-wise correction rather than distribution. Volume expansion near key support levels suggests accumulation on declines. The lack of high-volume breakdowns supports structural stability.
Pattern Formation
Price action is forming a broad descending consolidation pattern with lower highs and stable base formation. Sellers are active near the descending trendline, while buyers continue to defend the Fibonacci support zone. This compression suggests declining volatility. A decisive move out of this structure is likely to set the next medium-term trend.
The chart reflects a strong primary uptrend followed by a prolonged consolidation phase. Key Fibonacci levels and horizontal supports remain intact. Volume behaviour indicates accumulation rather than exhaustion. The structure suggests the stock is preparing for a directional expansion.

Population of Three Major Emerging Markets in 2025🌍 Population Overview of the Emerging Markets
In the global demographic landscape of 2025, the human population is estimated to be around 8.2 billion people. Even with declines in some regions, overall numbers continue to expand due to higher fertility in developing countries and improvements in health and longevity.
Among the most populous nations — especially those considered emerging markets — India, Indonesia, and Brazil stand out for their large populations and their role in shaping future global trends. These three aren’t just big markets; they represent important demographic and economic engines with distinct characteristics and challenges.
🇮🇳 India – World’s Most Populous Country in 2025
Population Size
As of 2025, India is the most populous country on Earth, with a population of approximately 1.46 billion people. That’s nearly 18% of the entire global population in just one nation.
Historically, India’s demographic growth stems from high birth rates in the mid-20th century followed by gradual declines in mortality due to healthcare improvements. However, the pace of population growth has been slowing as fertility rates fall.
Why India’s Population Matters
India’s sheer size gives it massive potential in labor force growth, market demand, and long-term economic output. A large working-age population can be a huge asset — economists call this a demographic dividend — boosting productivity if jobs and education keep pace with demand.
Yet, this large population also creates challenges:
Urbanization pressures: Rapid growth in cities has led to infrastructure stress — housing, transport, water, and sanitation need constant expansion.
Healthcare and education demand: Providing quality services to such a vast population remains a top policy priority.
Falling fertility rates: Interestingly, India’s fertility rate has dropped below the replacement level in some regions, which could eventually slow total population growth and reshape future age structures.
Despite slowing fertility, India’s population will continue to increase into the next few decades before stabilizing or slowly declining in the very long term — a pattern seen in many countries undergoing demographic transition.
🇮🇩 Indonesia – Southeast Asia’s Giant
Population Size
Indonesia is the fourth-most populous country in the world in 2025, with around 285–286 million people.
As an archipelagic nation spanning thousands of islands, Indonesia’s population is distributed unevenly — Java, for example, is one of the densest populated places on the planet, while eastern provinces are much less crowded.
Growth Trends
Indonesia’s population continues to grow but at a moderate pace compared to past decades. Fertility rates have declined from high levels in the 20th century due to improvements in education, especially for women, and better access to reproductive health services. Its growth rate is neither explosive nor stagnating, placing Indonesia in a demographic sweet spot relative to many developed and developing countries.
Economic and Social Significance
Like India, Indonesia’s size brings economic advantage:
Huge domestic market: With nearly 300 million consumers, it’s a key destination for businesses and a core component of the ASEAN economic bloc.
Labor force dynamics: A large and relatively young workforce offers potential economic advantage if job creation and skill development keep pace.
Urbanization and infrastructure needs: Cities like Jakarta — which alone had tens of millions of residents by 2025 — face congestion, environmental stress, and housing shortages.
Indonesia’s demographic path will have a direct impact on Southeast Asia’s economy — especially as it navigates urban growth, technology adoption, and education-to-employment transitions.
🇧🇷 Brazil – Latin America’s Largest Population
Population Size
In 2025, Brazil — the largest country in South America — has an estimated population of about 212–213 million people. While smaller than India and Indonesia, Brazil remains a demographic heavyweight in the Western Hemisphere.
Demographic Context
Brazil’s population growth has slowed significantly compared to earlier decades. Fertility rates fell steeply from the late 20th century onward, as urbanization increased, women's education levels rose, and access to family planning expanded. As a result, Brazil is now in the demographic transition phase typical of middle-income countries — where births and deaths both are relatively low.
This slower growth means Brazil’s population is aging faster than some of its emerging-market peers. While this creates challenges — especially for pensions and healthcare — it also means fewer pressures on infrastructure compared to nations with younger, faster-growing populations.
The Role of Population in Brazil’s Growth
Domestic market size: With over 200 million consumers, Brazil remains a major internal market for goods and services.
Regional influence: Brazil’s demographics, combined with resource wealth and a diverse economy, make it a central player in Latin America’s development.
Human capital and labor: Slower population growth can be beneficial if it’s paired with improved skill levels and innovation — Brazil invests heavily in education and technology relative to many emerging peers.
📊 Comparative Highlights
Country Approx. Population 2025 Global Rank (Population) Growth Trend Key Demographic Feature
India ~1,460 million (1.46 B) #1 Growing Young population; demographic dividend potential.
Indonesia ~285 million #4 Moderate growth Largest in Southeast Asia; demographic poised for economic expansion.
Brazil ~212 million ~#7 Slow growth Aging faster; large middle-income population.
📌 Why These Populations Matter for Economic Growth
Population size affects economies in multiple ways:
1. Workforce and Productivity
Large working-age populations can boost economic output if there are jobs, education, and training. India and Indonesia still have growing youth populations, while Brazil’s is more stabilized.
2. Consumer Markets
Consumers drive demand for products ranging from basic goods to technology, housing, healthcare, and services. Big populations mean large markets — attractive to domestic and foreign businesses.
3. Urbanization
All three countries are experiencing rising urban populations. Urbanization brings economic opportunities — innovation hubs, services, and productivity gains — but also strains housing, transport and pollution controls.
4. Social Services and Infrastructure
Governments must balance investments in education, healthcare, water, sanitation, and transportation to support their populations. The challenge is especially acute in rapidly growing nations where infrastructure often lags population growth.
5. Global Influence
Demographically large nations wield political and cultural influence. India’s role in global affairs is partly rooted in its demographic weight, just as Indonesia’s represents ASEAN’s demographic core, and Brazil anchors South America in international forums.
📅 What Lies Ahead?
Looking beyond 2025:
India’s population may continue rising into the 2030s, eventually stabilizing or declining as fertility rates stay low and urbanization deepens.
Indonesia will keep growing slowly, with population shifts depending on urban development and economic opportunities.
Brazil may see its population plateau or even decline later in the century, reflective of broader trends in middle-income countries.
Each of these demographic paths will shape economic opportunities, policy debates, and global influence — making population not just a statistic, but a central factor in future world trends.

Dollar Strength and Weakness in the Trading MarketThe US Dollar (USD) is the most influential currency in the global financial system. It acts as the world’s primary reserve currency, the main medium for international trade, and the benchmark against which most assets are priced. Because of this central role, dollar strength or weakness directly impacts forex, commodities, equities, bonds, and even emerging markets like India. Understanding how and why the dollar moves is essential for traders, investors, and policymakers.
What Is Dollar Strength?
Dollar strength means the US Dollar is appreciating in value relative to other currencies such as the euro (EUR), Japanese yen (JPY), British pound (GBP), or emerging market currencies like INR.
In trading terms:
USD pairs move up (e.g., USD/INR rises)
Non-USD pairs move down (e.g., EUR/USD falls)
Key Causes of Dollar Strength
1. Higher US Interest Rates
Interest rates are the single most powerful driver of dollar strength.
When the Federal Reserve (Fed) raises interest rates, US assets offer better returns.
Global capital flows into US bonds, treasury bills, and equities.
Demand for dollars increases → dollar strengthens.
This is why traders closely track:
Fed policy meetings
Inflation (CPI, PCE)
Employment data (Non-Farm Payrolls)
2. Strong US Economic Data
A robust US economy attracts global investment.
Indicators that boost the dollar:
Strong GDP growth
Rising consumer spending
Low unemployment
Stable inflation
When US data beats expectations, traders often buy USD aggressively.
3. Safe-Haven Demand
The dollar is considered a safe-haven currency.
During:
Global recessions
Financial crises
Wars or geopolitical tensions
Stock market crashes
Investors move money into USD assets, strengthening the dollar.
4. Capital Repatriation
US multinational companies repatriating profits increase dollar demand, especially during periods of global uncertainty.
What Is Dollar Weakness?
Dollar weakness occurs when the USD depreciates against other currencies.
In trading terms:
USD pairs move down (e.g., USD/JPY falls)
Non-USD pairs move up (e.g., EUR/USD rises)
Key Causes of Dollar Weakness
1. Lower Interest Rates or Rate Cuts
When the Fed:
Cuts interest rates
Signals a dovish stance
Returns on US assets decline, pushing capital toward higher-yielding markets. Demand for USD falls, leading to weakness.
2. Loose Monetary Policy (Money Printing)
Quantitative easing (QE) increases dollar supply in the system.
More dollars chasing the same assets = weaker dollar.
3. High US Debt and Fiscal Deficits
Large government spending and rising debt reduce confidence in the long-term value of the dollar.
Traders begin pricing in:
Currency depreciation
Inflation risks
4. Risk-On Market Environment
In strong global growth phases:
Investors move toward equities, commodities, and emerging markets
Demand for the dollar drops
This creates dollar weakness.
Impact of Dollar Strength and Weakness on Different Markets
1. Forex Market
The forex market reacts instantly to dollar moves.
Dollar strength → EUR/USD ↓, GBP/USD ↓, USD/JPY ↑
Dollar weakness → EUR/USD ↑, GBP/USD ↑, USD/INR ↓
Emerging market currencies are highly sensitive to dollar movements because of capital flows.
2. Commodities Market
Most commodities are priced in USD.
Dollar Strength:
Commodities become expensive for non-US buyers
Gold, crude oil, copper prices tend to fall
Dollar Weakness:
Commodities become cheaper globally
Gold and oil often rally
This is why gold is often seen as an inverse dollar trade.
3. Equity Markets
US Equities
Moderate dollar strength can be positive for US stocks
Excessive dollar strength hurts US exporters (lower overseas earnings)
Emerging Markets (India, Brazil, etc.)
Strong dollar → FII outflows → stock market pressure
Weak dollar → FII inflows → equity market rally
For Indian traders, USD/INR is a key sentiment indicator.
4. Bond Market
Strong dollar → higher US yields → bond prices fall
Weak dollar → lower yields → bond prices rise
Global bond flows are tightly linked to dollar expectations.
Dollar Cycle Concept
The dollar moves in long-term cycles.
Dollar Strength Cycle
Fed tightening
Capital flows into US
Pressure on emerging markets
Commodity weakness
Dollar Weakness Cycle
Fed easing
Capital flows to emerging markets
Commodity boom
Equity rallies outside the US
Smart traders align their strategies with the current dollar cycle rather than fighting it.
How Traders Use Dollar Strength and Weakness
1. Directional Trading
Forex traders directly trade USD pairs based on:
Fed expectations
Inflation trends
Risk sentiment
2. Intermarket Analysis
Professional traders connect:
Dollar Index (DXY)
Gold
Crude oil
Equity indices
Example:
Rising DXY + falling gold = risk-off signal
3. Hedging
Corporates and investors hedge:
Import costs
Export revenues
Foreign investments
A strong dollar hurts importers and benefits exporters.
Dollar Index (DXY)
The Dollar Index (DXY) measures USD strength against a basket of major currencies.
Rising DXY = dollar strength
Falling DXY = dollar weakness
Traders use DXY as:
A confirmation tool
A sentiment indicator
A risk gauge for global markets
Dollar and Indian Markets (Special Context)
For India:
Strong dollar → weaker INR → higher import costs → inflation risk
Weak dollar → stronger INR → stable inflation → positive equity sentiment
Sectors impacted:
IT benefits from a strong dollar
Oil marketing companies suffer when dollar strengthens
Metals and pharma benefit from dollar weakness
Conclusion
Dollar strength and weakness are not just currency movements—they are reflections of global liquidity, risk appetite, interest rate differentials, and economic confidence. The US Dollar acts as the heartbeat of the global trading system. When it strengthens, capital consolidates in the US and global risk reduces. When it weakens, liquidity flows outward, fueling growth in commodities and emerging markets.

Understanding Force Motors’ Uptrend and Breakout OpportunityForce Motors Limited’s stock trading around ₹22,500 on its weekly chart is showing signs of a potential all-time high breakout. Let’s break down the technical concepts involved and what they mean for traders and investors.
📈 What is an Uptrend?
An uptrend occurs when the price consistently forms higher highs and higher lows.
It reflects sustained buying interest and investor confidence.
In simple terms, each rally pushes the stock to a new peak, and each pullback stops at a higher level than before.
🔑 Importance of Higher High Breakout
A higher high breakout signals trend continuation rather than reversal.
Breaking past an all-time high often attracts:
Momentum traders looking to ride the rally.
Long-term investors who see strength in fundamentals and technicals.
It can act as a psychological trigger, as new highs often bring fresh demand.
📊 RSI Above 50 – Why It Matters
The Relative Strength Index (RSI) measures momentum.
Levels above 50 generally indicate bullish strength.
In this case:
RSI > 50 suggests buyers are in control.
It confirms that the breakout attempt is supported by momentum, not just price action.
💡 Current Opportunity in Force Motors
The stock attempting an all-time high breakout means:
Traders may see this as a trend continuation opportunity.
Investors could interpret it as a sign of long-term strength.
However, breakouts require confirmation (sustained trading above the breakout level with volume).
⚖️ Risk Management – The Essential Balance
Even in strong uptrends, risk management is crucial:
Stop-loss placement: Below recent support or breakout level to limit downside.
Position sizing: Avoid overexposure; allocate capital wisely.
Avoid chasing: Enter only on confirmation, not on emotional impulse.
Diversification: Don’t rely solely on one stock, even if it looks strong.
✨ Key Takeaway
Force Motors’ chart shows a classic setup of an uptrend with RSI strength and a potential higher high breakout. While this presents an opportunity, disciplined risk management ensures that traders and investors can participate in the rally without being vulnerable to sudden reversals.

#BANKNIFTY PE & CE Levels(10/02/2026)Bank Nifty is expected to open flat, indicating a neutral start to the session with no major overnight trigger influencing sentiment. A flat opening after recent volatility usually signals indecision, where the market is likely to spend initial time in consolidation before choosing a clear directional move. Traders should avoid aggressive positions at the open and wait for price action to confirm strength or weakness around key levels.
On the upside, the 60550–60600 zone is the immediate resistance and also a critical trigger area for bullish momentum. If Bank Nifty sustains above this range with strong volumes, CE buying can be considered, as this would signal continuation of the broader uptrend. In such a scenario, upside targets are placed at 60750, 60850, and 60950+, where partial profit booking is advisable due to potential supply near higher levels. A decisive move above 60950 could further strengthen bullish sentiment for the day.
On the downside, 60450–60400 remains an important rejection and supply zone. If the index fails to hold above this area and shows bearish candles or rejection patterns, PE buying opportunities may emerge, with immediate downside targets at 60250, 60150, and 60050. The 60060–60000 region is a strong intraday support zone; any breakdown below this level can increase selling pressure and may shift the intraday bias towards the bears.
Overall, the structure suggests a range-bound market with a slight bullish bias, provided Bank Nifty holds above 60000. Directional clarity will likely emerge only after a breakout or breakdown from the 60550–60400 range. A level-to-level trading approach with strict stop-loss and partial profit booking remains the best strategy for today’s session, especially considering the flat opening and potential intraday whipsaws.

Market Outlook & Trade Setup – Tuesday, 10th Feb 2026🔹 NIFTY: Gift Nifty (25,986)
* Previous Close: 25,867
* Expected Range: 25,500 - 26,000
🔹 SENSEX
* Previous Close: 84,065
* Expected Range: 83,500 - 84,500
🌍 Global & Market Sentiment
* DJIA: +20 | S&P: +32
💰 Institutional Activity (Cash Market)
* FII: Net Buyers: + ₹ 2255 Cr
* DII: Net Buyers: + ₹ 4 Cr
🔥 Events this Week:
India - US Crude & CPI data, UK GDP
📌 Sectoral Focus (Positive)
PSU Bank, Media, Realty, Consumer Durable
👉 Commodities in Focus: Gold, Silver, Natural Gas
✌️Important Quarterly Results: APOLLOHOSP, BALRAMCHIN, BRITANNIA, GRASIM
📈 Trade smart. Manage risk. Stay disciplined.

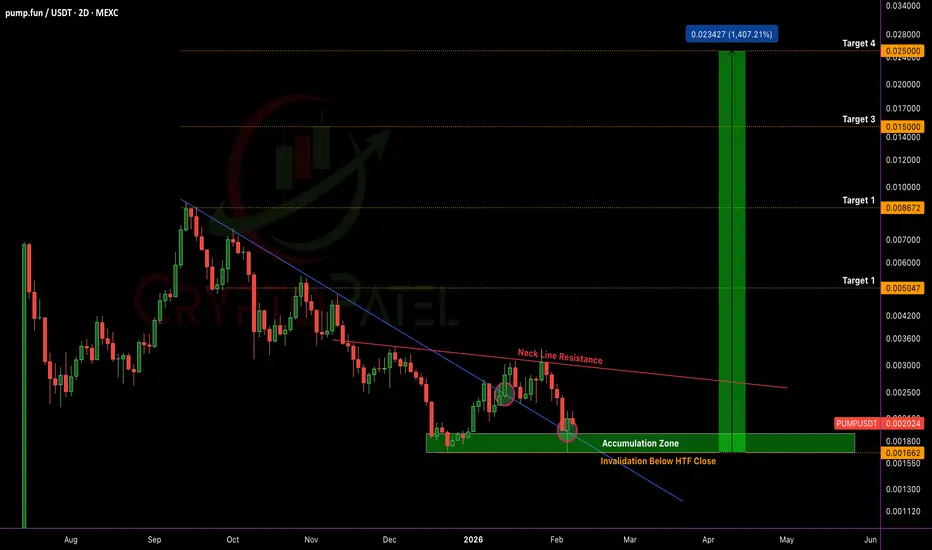
$PUMP PRICE PREDICTION | 15x UPSIDE POTENTIAL IF HTF BASE HOLDSNYSE:PUMP PRICE PREDICTION | 1,500% UPSIDE POTENTIAL IF HTF BASE HOLDS
#PUMP is trading inside a HTF Accumulation Zone after completing a long-term descending wedge, signaling a potential macro trend reversal.
Technical Structure Overview:
✅ Multi-month descending wedge breakout confirmed on 13th January 2026
✅ Breakout and Retest successfully completed ($0.0025 → $0.0017)
✅ Current retest zone aligns with HTF demand, offering a favorable entry area as per the chart
✅ Strong Accumulation holding Above $0.0015
✅ Structure Remains Bullish above $0.0015 Support (HTF hold)
✅ Sustained acceptance above Accumulation = Continuation
CryptoPatel Expansion Targets: $0.00504 → $0.00867 → $0.01500 → $0.02297+
Altseason Confirmation: A decisive break and hold above $0.0030 would confirm strength and mark real Alt Season Entry for NYSE:PUMP
Upside Potential:
If price holds above $0.0015 support, PUMP/USDT Carries 1,500%+ upside potential in the near future based on HTF expansion.
❌ Invalidation:
HTF close below $0.0015 invalidates the reversal structure and opens downside risk.
TA only. Not financial advice. ALWAYS DYOR.
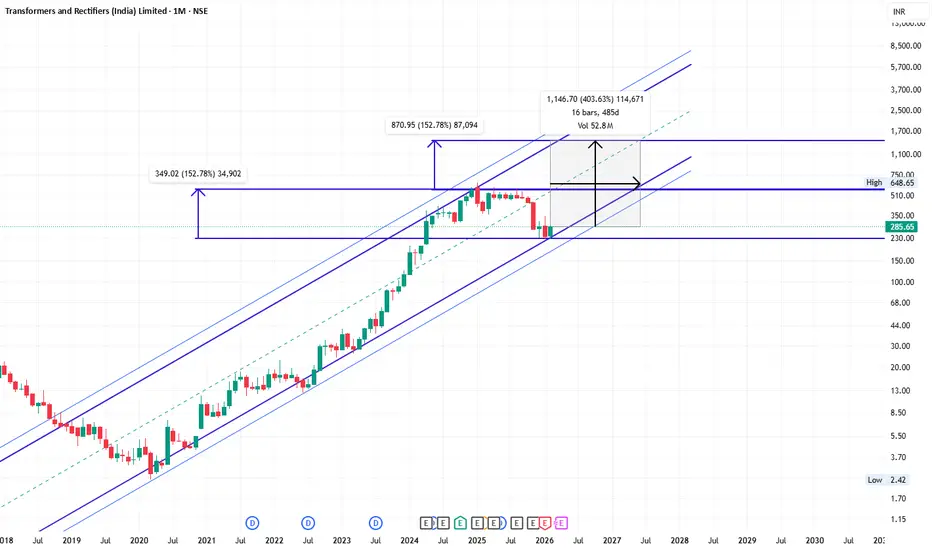
TRAIL 100% ROI possible in next 18 MonthsTRAIL 100% ROI possible in next 18 Months.
LTP - 285
Targets - 575+
Timeframe - 18 Months.
Technicals:
Stock has been correcting since last 12 months & seems have bottomed now.
Fundamentals:
The company is a leading Indian manufacturer of transformers & reactors. Its product portfolio includes Single-phase power transformers up to 500MVA & 1200kV Class, Furnace Transformers, Rectifier & Distribution Transformers, Specialty Transformers, Series & Shunt Reactors, Mobile Sub Stations, Earthing Transformers, etc.
Company has delivered good profit growth of 147% CAGR over last 3 years.
Happy Invetsing.
#META Once again Roaring #META Once again Roaring on daily chart
Add above 684 for 744/790
use sl below 657

Unlocking Pure Price Action MasteryHistorical Price action points ( No bias - No Forecasting )
Spot the red supply zone at the top—respected like clockwork on this weekly chart.
That crisp white solid line? It's the monthly high range difference (zoom to the right-hand monthly view to see it clearly)—a subtle gem most miss.
The solid red boundary line proves its strength: over four touches from deep consolidation, holding firm every time.
Enter the green dotted resistance line—a hidden powerhouse between patterns, key for spotting true breakouts historically.
Finally, the dotted white parallel channel (hidden but deadly accurate): price bounces perfectly off the upper resistance and lower support, channelling the action beautifully.
This is price action in its raw form—pure, unfiltered respect for key levels.
Disclaimer: Past performance is not indicative of future results. Trade at your own risk; this is for educational purposes only.

SCILAL | Trendline Breakout with Huge Volume🚀 SCILAL | Trendline Breakout with Huge Volume
📊 Breakout Context: Trendline breakout confirmed with strong volume current candle, adding conviction.
Trade Plan:
💰 Buy near CMP: 48.78
🎯 Target: 68 (+39.3%)
🛑 Stop Loss: 43 (-11.8%)
⚖️ Risk/Reward Ratio: ~1 : 3.3
🔑 Key Notes
📌 Strong volume breakout suggests genuine momentum; monitor for retests.
📍 Healthy retest zone: 46–48 (as long as price holds above stop loss).
🔒 Trail stop loss upward as price advances to secure gains.
🔥 Discipline + Patience = Profits
Stay focused, respect your stop, and let the trend reward you.

NIFTY 30m: Bullish Bias Amid Trader ChaosWhile most traders are still debating direction, the chart has already made its decision.
Bullish structure is propagating top-down — from the Weekly Kumo breakout , through 2H equilibrium resolution, into a weekly emerging bullish reversal , and now asserting itself on the 30m timeframe .
The current 30m Kumo breakout should be viewed as tactical alignment with these previously discussed higher-timeframe Ichimoku developments.
Related Base Contexts (Earlier Observations)
Nifty’s Elevated Volatility: Is Ichimoku Time Failure at Play?
Weekly Kumo Breakout
Nifty’s Mindvoice (2H): When Silence Matters More Than Direction
2H Kumo Breakout
Have Nifty Bulls Opted to Resolve Weekly Ichimoku Time Failure?
Weekly Equilibrium Resolution and Emerging Bullish Reversal

RENUKA | Hourly Chart View⚡ RENUKA | Short-term View
Trade Plan:
💰 Buy near: 25.50
🎯 Target: 33 (+29.4%)
🛑 Stop Loss: 24.30 (-4.7%)
⚖️ Risk/Reward Ratio: ~1 : 6.3

BUY TODAY SELL TOMORROW for 5%DON’T HAVE TIME TO MANAGE YOUR TRADES?
- Take BTST trades at 3:25 pm every day
- Try to exit by taking 4-7% profit of each trade
- SL can also be maintained as closing below the low of the breakout candle
Now, why do I prefer BTST over swing trades? The primary reason is that I have observed that 90% of the stocks give most of the movement in just 1-2 days and the rest of the time they either consolidate or fall
Resistance Breakout in APOLLOPIPE
BUY TODAY SELL TOMORROW for 5%

BANKNIFTY : Detailed Trading plan for 10-Feb-2026📘 BANKNIFTY Trading Plan – 10 Feb 2026
(Timeframe: 15-Min | Instrument: BANKNIFTY | Educational Purpose Only)
🔑 Key Intraday Levels (From Chart)
🟢 61,312 – Last Intraday Resistance
🟢 60,800 – Upper Resistance Band
🟠 60,705 – 60,799 – Opening Support / Resistance Zone
🟢 60,589 – Opening Support
🟢 60,430 – Last Intraday Support
🟢 60,291 – Major Breakdown Support
🧠 Market Structure & Price Psychology
BANKNIFTY has shown a strong recovery from lower levels, forming a short-term higher-low structure.
However, price is now approaching a key supply band near 60,700 – 60,800, where profit booking can emerge.
👉 Direction on 10 Feb will depend on acceptance above supply or rejection back into support.
🚀 Scenario 1: GAP UP Opening (200+ Points)
(Opening near / above 60,750 – 60,850)
🧠 Psychology
A large gap up reflects overnight bullish sentiment + short covering, but institutions often sell near prior resistance.
🟢 Bullish Plan
🔵 Sustaining above 60,800 on 15-min close
🔵 Upside opens towards 61,312
🔵 Break & hold above → Momentum continuation
🔴 Rejection Plan
🔴 Failure to sustain above 60,800
🔴 Pullback towards 60,705 → 60,589
📌 Why this works
True breakouts require price acceptance, not emotional gap-up spikes.
➖ Scenario 2: FLAT Opening
(Opening between 60,550 – 60,700)
🧠 Psychology
Flat opening inside supply indicates indecision & liquidity absorption.
🟠 Decision Zone
🔸 60,705 – 60,799
🔸 Expect whipsaws until breakout
🟢 Upside Plan
🔵 Break & hold above 60,800
🔵 Targets: 61,312
🔴 Downside Plan
🔴 Breakdown below 60,589
🔴 Drift towards 60,430 → 60,291
📌 Why this works
Consolidation resolves with expansion — patience gives clarity.
🔻 Scenario 3: GAP DOWN Opening (200+ Points)
(Opening near / below 60,430)
🧠 Psychology
Gap down signals profit booking or fear selling, but demand zones can trigger relief rallies.
🟢 Bounce Setup
🔵 If 60,430 holds on 15-min basis
🔵 Expect bounce towards 60,589 → 60,705
🔴 Breakdown Setup
🔴 Clean break below 60,291
🔴 Downside momentum may accelerate
📌 Why this works
Strong supports either create sharp reversals or fast continuation breakdowns.
🛡️ Risk Management Tips (Options Traders)
🟢 Trade only after first 15-min candle confirmation
🟢 Prefer defined-risk option spreads
🟢 Avoid aggressive buying near resistance ❌
🟢 Risk maximum 1–2% capital per trade
🟢 Book partial profits at key levels
🟢 Discipline > Prediction 📌
🧾 Summary & Conclusion
📌 BANKNIFTY is in post-recovery consolidation near supply
📌 60,800 & 60,589 are key intraday triggers
📌 Break above 61,312 confirms bullish continuation
📌 Trade price reaction, not bias 📈
⚠️ Disclaimer
This analysis is strictly for educational purposes only.
I am not a SEBI registered analyst.
Please consult your financial advisor before taking any trades.
Market investments are subject to risk.

Market Structure Expansion After Corrective PullbackIntro / Overview
This chart highlights a clean price-action based structure where the market moves through impulsive advances followed by corrective pullbacks.
The focus is strictly on natural swing behavior and structure continuation, not on Elliott Wave theory.
⸻⸻⸻⸻⸻⸻⸻⸻⸻⸻⸻⸻⸻⸻
Concept
Markets generally move in phases:
• Expansion (Impulse)
• Retracement (Correction)
• Continuation
By tracking swing highs and swing lows, we can identify where price is pausing, correcting, and preparing for the next directional move.
⸻⸻⸻⸻⸻⸻⸻⸻⸻⸻⸻⸻⸻⸻
Chart Explanation (Step-by-Step)
1. Initial Expansion
• Price forms a strong directional move with higher highs and higher lows.
• This establishes bullish structure and directional bias.
2. Corrective Pullback
• Price retraces in a controlled manner.
• No structural breakdown occurs, indicating a healthy correction.
3. Stronger Expansion
• Momentum accelerates and price pushes higher.
• This move confirms acceptance above the previous structure high.
4. Secondary Pullback
• Another corrective phase follows the expansion.
• Price forms a higher low, preserving bullish structure.
5. Projected Continuation
• Based on prior expansion behavior, price is projected to continue higher.
• This projection is structure-based, not a prediction.
⸻⸻⸻⸻⸻⸻⸻⸻⸻⸻⸻⸻⸻⸻
Observation
• Each pullback remains structurally valid
• Expansion moves show increasing momentum
• Corrections are shallow and controlled
• No major breakdown in swing structure is observed
This behavior often reflects trend continuation conditions.
⸻⸻⸻⸻⸻⸻⸻⸻⸻⸻⸻⸻⸻⸻
Why It Matters?
Understanding structure helps traders:
• Avoid emotional entries during pullbacks
• Align with market acceptance and direction
• Focus on continuation zones instead of chasing price
Structure-based analysis keeps attention on price behavior, not assumptions.
⸻⸻⸻⸻⸻⸻⸻⸻⸻⸻⸻⸻⸻⸻
Conclusion
This chart demonstrates how simple swing structure can be used to map market behavior and potential continuation zones.
The projection is not a forecast, but a structural reference based on previous price action.
Always wait for confirmation and manage risk accordingly.
⸻⸻⸻⸻⸻⸻⸻⸻⸻⸻⸻⸻⸻⸻
⚠️ Disclaimer
📘 For educational purposes only
🙅 Not SEBI registered
❌ Not a buy/sell recommendation
🧠 Shared purely for learning and pattern understanding
📊 Not Financial Advice

NIFTY : Detailed Trading Plan for 10-Feb-2026📘 NIFTY Trading Plan – 10 Feb 2026
(Timeframe: 15-Min | Instrument: NIFTY 50 | Educational Purpose Only)
🔑 Key Intraday Levels (From Chart)
🟢 26,154 – Higher Timeframe Resistance
🟢 25,858 – 25,906 – No-Trade / Supply Zone
🟠 25,782 – 25,763 – Opening Support Zone
🟢 25,676 – Last Intraday Support
🟢 25,583 – Lower Breakdown Support
🟢 25,516 – 25,747 – Broader Demand Zone
🧠 Market Structure & Price Psychology
NIFTY has shown a strong recovery from lower demand, followed by consolidation near a falling trendline & supply zone.
This indicates buyers regaining strength, but confirmation is still pending near resistance.
👉 Tomorrow’s direction will depend on acceptance above the no-trade zone or rejection back into support.
🚀 Scenario 1: GAP UP Opening (100+ Points)
(Opening near / above 25,900)
🧠 Psychology
A gap-up near resistance shows overnight optimism, but sellers often defend prior supply aggressively.
🟢 Bullish Plan
🔵 If price sustains above 25,906 on a 15-min closing basis
🔵 Upside opens towards 26,154
🔵 Strong momentum continuation only if price accepts above supply
🔴 Rejection Plan
🔴 Rejection near 25,906 – 25,858
🔴 Expect pullback towards 25,782 – 25,763
📌 Why this works
True breakouts happen with price acceptance, not just gap-driven spikes.
➖ Scenario 2: FLAT Opening
(Opening between 25,780 – 25,850)
🧠 Psychology
Flat opening inside supply shows indecision & liquidity absorption.
🟠 No-Trade Zone
🔸 25,858 – 25,906
🔸 Expect whipsaws & fake moves
🟢 Upside Plan
🔵 Break & hold above 25,906
🔵 Targets: 26,154
🔴 Downside Plan
🔴 Breakdown below 25,763
🔴 Drift towards 25,676
📌 Why this works
Markets expand after consolidation, patience gives better risk-reward.
🔻 Scenario 3: GAP DOWN Opening (100+ Points)
(Opening near / below 25,676)
🧠 Psychology
Gap down reflects profit booking or fear selling, but demand zones attract smart money.
🟢 Bounce Setup
🔵 If 25,676 holds on 15-min basis
🔵 Expect bounce towards 25,763 → 25,782
🔴 Breakdown Setup
🔴 Clean break below 25,583
🔴 Downside opens till 25,516 – 25,547
📌 Why this works
Strong supports either give sharp bounces or fast continuation breakdowns.
🛡️ Risk Management Tips (Options Traders)
🟢 Trade only after first 15-min candle confirmation
🟢 Prefer defined-risk option spreads
🟢 Avoid trading inside No-Trade Zones ❌
🟢 Risk maximum 1–2% capital per trade
🟢 Book partial profits at next resistance/support
🟢 Discipline > Prediction 📌
🧾 Summary & Conclusion
📌 NIFTY is consolidating below major supply
📌 25,906 & 25,676 are key intraday triggers
📌 Break above 25,906 confirms bullish continuation
📌 Trade price reaction, not assumptions 📈
⚠️ Disclaimer
This analysis is strictly for educational purposes only.
I am not a SEBI registered analyst.
Please consult your financial advisor before taking any trades.
Market investments are subject to risk.

BUY TODAY SELL TOMORROW for 5% DON’T HAVE TIME TO MANAGE YOUR TRADES?
- Take BTST trades at 3:25 pm every day
- Try to exit by taking 4-7% profit of each trade
- SL can also be maintained as closing below the low of the breakout candle
Now, why do I prefer BTST over swing trades? The primary reason is that I have observed that 90% of the stocks give most of the movement in just 1-2 days and the rest of the time they either consolidate or fall
Trendline Breakout in POWERGRID
BUY TODAY SELL TOMORROW for 5%

EURAUD MULTI TIMEFRAME ANALYSIS Scanning multiple forex pairs to filter high-quality trade setups. No trades are forced—only structure-based opportunities.
Note: There may be a delay in this video due to upload processing time.
Disclaimer: FX trading involves high leverage and substantial risk, and losses can exceed your initial investment. This content is for educational purposes only and should not be considered financial advice. Trade at your own risk.

CDSL 1 Day Time Frame 📍 Current Price (approx): ₹1,370 – ₹1,400 on NSE (intraday range seen)
📊 Daily Levels (Intraday Technicals)
👉 Pivot & Intraday S/R
Pivot (central reference): ~ ₹1,364 – ₹1,369
Resistance levels (daily):
R1: ~ ₹1,399 – ₹1,403
R2: ~ ₹1,410 – ₹1,420
R3: ~₹1,420 + (short-term upper targets today)
Support levels (daily):
S1: ~ ₹1,350 – ₹1,364
S2: ~ ₹1,330 – ₹1,340
S3: ~ ₹1,315 – ₹1,320
These are classical pivot and Fibonacci pivot support/resistance zones you might see respected in intraday trading.
📈 What This Means in Action
Bullish (if prices hold above pivot):
Above ~ ₹1,370–₹1,380 suggests buyers are trying to control the session.
Initial upside structure near ₹1,400–₹1,420 — breaks above here can shift momentum earlier in the day.
Bearish / downside risk:
If price slides below ₹1,350, the next supports are near ₹1,330 and then ₹1,315–₹1,320 — these are zones where previous intraday lows and pivot support cluster.
Think of ₹1,364 pivot as the key reference: above = short-term buyers probable, below = sellers have more control.
🧠 Quick Notes
📍 These levels are technical reference points for today’s price action — not future targets or investment advice.
📍 Broader context: CDSL has seen mixed technical signals over recent months, with analysts pointing both to breakout potential and to downside risks if key long-term supports fail.
