XAUUSD Fundamental Updates : 👀
U.S. Dollar Decreased after news came out that U.S. legal authorities started a criminal investigation involving Jerome Powell, who is the head of the Federal Reserve. This situation increased conflicts with the Trump administration. 😇😇
Chart Patterns

DELHIVERY 1 Week Time Frame 📊 Current Market Context
The stock is trading around ₹380–₹400 on NSE recently.
The 52-week range is roughly ₹236 (low) to ₹490 (high).
📈 Key Weekly Technical Levels — Support & Resistance
(Note: These levels are approximate and based on recent pivots and observed price action.)
🛑 Resistance Levels (Upside)
1. ₹405–₹412 — near the recent pivot/resistance cluster and short-term weekly resistance area.
2. ₹420–₹427+ — secondary resistance zone from broader short-term trend levels.
🛟 Support Levels (Downside)
1. ₹390–₹395 — near current trading pivot & immediate weekly support.
2. ₹380–₹385 — more structural support around recent lows.
3. ₹360–₹370 — deeper support (if broader pullback continues).
📌 Technical Indicator Summary (Short-Term / 1-Week)
Some technical scoring models currently show a sell / bearish bias over the 1-week horizon, suggesting lower momentum near term.
Other shorter timeframe indicators (like simple pivot analysis) suggest the stock is trading in a sideways to slightly down channel, with resistance not far above current levels and support levels falling in the ₹380s and below.
📍 What Traders Watch in 1-Week Timeframe
Break above ₹405–₹412 area with volume — could shift momentum toward ₹420+ short term.
Sustain below ₹390–₹395 — increases probability of a deeper pullback toward ₹380 or lower.
Volatility can remain elevated, so tight risk management or watching daily pivot changes is helpful.

Gold Rotating After CHoCH – Liquidity Controls the FlowGold is currently trading in a post-impulse, post-breakout environment.
After the earlier expansion and BOS, price did not continue trending cleanly.
Instead, it transitioned into sideways consolidation, signaling Smart Money rebalancing rather than continuation.
This is not indecision — this is liquidity management.
Market Structure & Liquidity Context
• Higher-timeframe structure shows a breakout followed by hesitation, a classic sign of distribution and absorption.
• Price spent time ranging, engineering liquidity on both sides before expansion.
• A clear CHoCH formed after the sell-off, confirming the shift from expansion into controlled rotation.
• The 4610–4608 zone aligns with prior structure and demand, where Smart Money defended price aggressively.
• From this discount reaction, price expanded strongly, targeting upper liquidity.
This confirms that rotation → expansion was liquidity-driven, not emotional buying.
Key Trading Scenarios
🟢 Buy Reaction at Discount (Already Played)
The 4610–4608 demand zone acted as a protected discount area.
Strong rejection here confirmed Smart Money defense and initiated upside expansion.
🔴 Sell Reaction at Premium (Next Focus)
If price revisits 4742–4744, this premium zone aligns with:
• Prior expansion highs
• Buy-side liquidity resting above range
• Potential distribution area
Weak acceGold is currently trading in a post-impulse, post-breakout environment.
After the earlier expansion and BOS, price did not continue trending cleanly.
Instead, it transitioned into sideways consolidation, signaling Smart Money rebalancing rather than continuation.
This is not indecision — this is liquidity management.
Market Structure & Liquidity Context
• Higher-timeframe structure shows a breakout followed by hesitation, a classic sign of distribution and absorption.
• Price spent time ranging, engineering liquidity on both sides before expansion.
• A clear CHoCH formed after the sell-off, confirming the shift from expansion into controlled rotation.
• The 4610–4608 zone aligns with prior structure and demand, where Smart Money defended price aggressively.
• From this discount reaction, price expanded strongly, targeting upper liquidity.
This confirms that rotation → expansion was liquidity-driven, not emotional buying.
Key Trading Scenarios
🟢 Buy Reaction at Discount (Already Played)
The 4610–4608 demand zone acted as a protected discount area.
Strong rejection here confirmed Smart Money defense and initiated upside expansion.
🔴 Sell Reaction at Premium (Next Focus)
If price revisits 4742–4744, this premium zone aligns with:
• Prior expansion highs
• Buy-side liquidity resting above range
• Potential distribution area
Weak acceptance or rejection here would signal that buy-side liquidity has been delivered, opening room for rotation or consolidation.
Expectation & Bias
This is not a chase market.
• Expansion only follows liquidity delivery
• Continuation requires acceptance above premium
• Failure to accept favors rotation back toward equilibrium
Until then:
Liquidity > Indicators
Reaction > Prediction
Structure > Emotion
Let price confirm intent — Smart Money always shows its hand first.
💬 Do you expect acceptance above premium, or another rotation back to discount?ptance or rejection here would signal that buy-side liquidity has been delivered, opening room for rotation or consolidation.
Expectation & Bias
This is not a chase market.
• Expansion only follows liquidity delivery
• Continuation requires acceptance above premium
• Failure to accept favors rotation back toward equilibrium
Until then:
Liquidity > Indicators
Reaction > Prediction
Structure > Emotion
Let price confirm intent — Smart Money always shows its hand first.
💬 Do you expect acceptance above premium, or another rotation back to discount?

TCS 1 Week Time Frame 📌 Current Price Reference
TCS is trading around ₹3,120–₹3,140 on the NSE recently.
📉 Key Weekly Levels (Support & Resistance)
🔹 Support Levels (Weekly)
1. ~₹3,137 – near immediate weekly support zone.
2. ~₹3,111 – next support under current price.
3. ~₹3,069 – deeper weekly support below recent lows.
4. ~₹2,867 – 52-week low area (major support if breakdown persists).
These levels are typical bounce/zones to watch on a weekly timeframe if the stock slides further.
🔺 Resistance Levels (Weekly)
1. ~₹3,205 – immediate weekly resistance.
2. ~₹3,246–₹3,273 – medium resistance that may cap upside rallies.
3. ~₹3,300+ – round psychological resistance zone.
A break above ~₹3,205–₹3,246 area on weekly closing could suggest short-term bullish momentum.
📌 1-Week Trading Range (Indicative)
Bearish/breakdown range: ₹3,069 – ₹2,867 (if weakness continues)
Neutral range: ₹3,069 – ₹3,205
Bullish breakout range: above ₹3,205 up to ₹3,273+

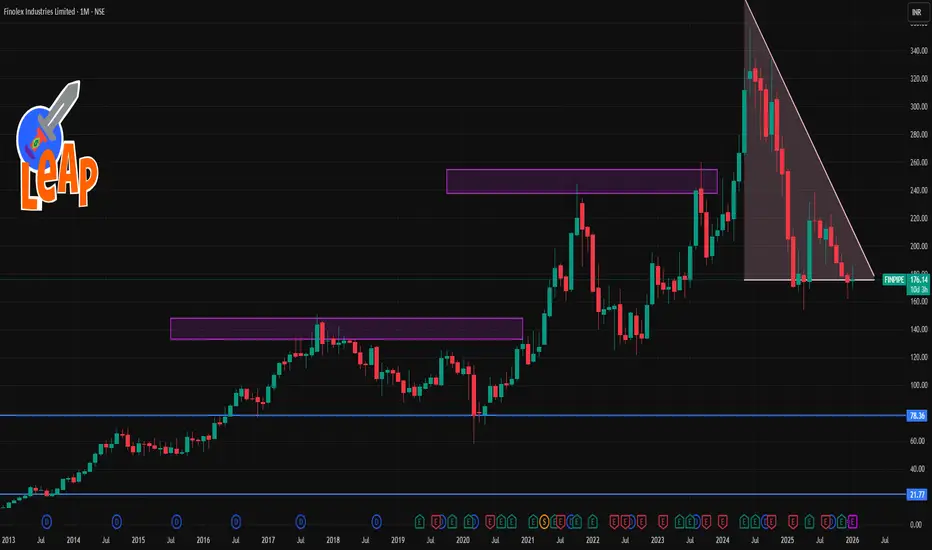
FINPIPE 1 Month Time Frame📊 Current Context
The share has been moderately positive over the past month (~+5–8% gains) in recent price data.
Recent share price (late Jan 2026) is near ₹175–177 levels.
📈 Key Levels (1‑Month Timeframe)
🔹 Resistance Levels
These are levels where the price may face selling pressure:
1. ~₹177–179 — Immediate resistance seen on short‑term pivot structure.
2. ~₹185–189 — Next meaningful resistance zone based on recent moving average clusters (20–50 day EMAs/SMAs).
3. ~₹194–198 — Higher resistance around 50–100 day average / upper consolidation of the last month/quarter.
Break above ₹185–189 with volume could signal a stronger short‑term uptrend continuation.
🔻 Support Levels
Important price floors where the price may find buyers:
1. ~₹173–175 — Near short‑term support and recent intraday pivot levels.
2. ~₹169–170 — Lower support seen from short swing lows over the past month.
3. ~₹164–165 — Deeper support from prior month low levels before recent recovery. (Estimated from recent historical lows.)
A close below ~₹169 on daily charts could indicate weakening short‑term structure.
🗺️ Trading Mindset (not financial advice)
Bullish view: A sustained move above ₹185–189 with increased volumes may target higher resistance near ₹195+.
Bearish view: A close under ₹170–169 could restart short‑term weakness toward lower support levels.
XAUUSD – Trend-Following StrategyXAUUSD – Trend-Following Plan: Prefer Buying the Dip (H1)
Gold is still holding a bullish short-term structure with higher highs and higher lows. The recent push up shows buyers are in control, so my main focus is NOT chasing price, but waiting for a clean pullback into key support to join the trend with controlled risk.
🎯 MAIN SCENARIO – BUY THE DIP (Priority)
Buy Zone: 4687 – 4690
Stop Loss: Below 4655
Take Profits:
TP1: 4735 – 4745
TP2: 4780
TP3: 4804 – 4808
Why this zone?
4687–4690 is the key area highlighted on the chart as a major level. After price pushed above it, this zone can act as new support (previous resistance becomes support). If price retests and holds with clear rejection (wicks, bullish engulfing, strong bounce), this is the higher-probability buy location in line with the trend.
🔁 SECONDARY SCENARIO – DEEP BUY AT LIQUIDITY / IMBALANCE
Buy Zone: 4620 – 4600 (Liquidity Imbalance area)
Stop Loss: Below 4575
Take Profits:
TP1: 4687
TP2: 4735
TP3: 4780+
Why this zone?
The chart shows a clear liquidity imbalance below price that has not been fully filled. If the market performs a deeper sweep (stop-hunt / flush), this zone becomes a strong candidate for a trend continuation buy with better R:R.
📊 TECHNICAL VIEW (What the chart is telling us)
Price is still trading within a bullish structure and respecting the rising trendline.
The latest impulse up suggests active demand, not just a weak drift.
The most logical approach is to let price come to you: buy support, not breakout candles.
The upside magnet remains the 4804–4808 area, which is also the next major reaction zone.
🌍 MACRO CONTEXT (Keep it simple)
Gold remains supported in the broader environment where risk sentiment can shift quickly.
Unless USD strength returns aggressively, pullbacks are more likely to be bought than to start a full bearish reversal.
That’s why the plan stays trend-following: wait for dips and execute with discipline.
🧠 EXECUTION RULES (Discipline > Opinions)
No FOMO buys at extended highs.
Only take the trade inside the planned zones and only with confirmation.
Risk per trade stays controlled (1–2% max). If the idea is wrong, cut it fast and reassess—no “hope trading.”
📌 SUMMARY
Bias: Bullish (H1)
Strategy: Buy the dip at 4687–4690, or deeper at 4620–4600
Targets: 4735–4745 → 4780 → 4804–4808
If you want, I can also rewrite this in a shorter TradingView-post style (more punchy, fewer words) while keeping the same levels and rules.

KIRIINDUS 1 Day Time Frame 📌 Current Price Snapshot
📍 NSE (approx current trading price): ₹496.50 – ₹513.95 range during today’s session.
The stock has been trading near its 1D range low to mid and is well below key moving averages, signaling near‑term weakness.
📊 1‑Day Pivot & Support/Resistance Levels
Pivot Points (Classic/Fibonacci – short‑term traders)
Based on pivot calculations from the previous session:
Pivot (central reference): ~ ₹536.98
Resistance Levels:
R1: ~ ₹545.62
R2: ~ ₹553.53
R3: ~ ₹562.17
Support Levels:
S1: ~ ₹529.07
S2: ~ ₹520.43
S3: ~ ₹512.52
👉 These are the key intraday turning points that many traders use to gauge short‑term bias:
Holding above the pivot (~₹536) is bullish bias intraday.
Dropping below S2/S3 suggests continued weakness for the session.
📉 Alternative Support/Resistance from Other Technical Sources
A slightly wider intraday pivot setup also suggests:
Central Pivot (CPR): ~ ₹520–₹524
Immediate Support: ~ ₹503–₹507
Immediate Resistance: ~ ₹548–₹558
This is useful for scalpers and intraday short‑term strategies.
🎯 How Traders Use These Levels
Bullish scenario
A sustained price move above Pivot (~₹536) → rally toward R1 (₹545–₹550) and R2 (~₹553+).
Bearish scenario
Break and close below S1/S2 (~₹529–₹520) → risk of probing S3 and lower (~₹512 or below).
These levels are widely used by intraday traders to set entry, stop‑loss, and exit targets for the day session.

XAUUSD (H4) — Bond Selloff, Yields UpPullback Opportunity or Rejection at the Top?
Gold is still holding a bullish structure on the H4 chart, but the rebound in global yields can easily trigger sharp swings around key resistance. Today’s approach is simple: trade the zones, not the noise.
I. Executive Summary
Primary trend: H4 uptrend remains intact.
Trading bias: Prefer BUY on pullbacks into demand; consider SELL only with clear rejection at Fibonacci resistance.
Key zones:
Sell: 4774–4778
Buy: 4666–4670
Value Buy: 4620–4625
Rule: Enter only after zone touch + confirmation (rejection / micro-structure shift).
II. Macro & Fundamentals (optimized & concise)
Global bond selloff: Bond selling is spreading globally; Japan’s 40-year JGB yield hitting 4% signals broad, persistent yield pressure.
US yields rebounding: Higher US yields (10Y–30Y) raise the opportunity cost of holding gold → short-term bearish pressure for XAUUSD.
Risk premium still alive: Geopolitical tension and tariff headlines keep markets sensitive, supporting defensive flows and limiting deep downside.
Fundamental takeaway: Rising yields can drive a pullback, but the broader risk backdrop favors a correction within an uptrend, not a full reversal (unless structure breaks).
III. Technical Structure (from your chart)
1) H4 overview
Price is extended after a strong impulse and is now consolidating, while structure still prints Higher Highs / Higher Lows.
The ascending trendline remains supportive → the higher-probability play is buying dips into demand rather than chasing price.
2) Key zones
Fibonacci Sell zone: 4774 – 4778 (major supply / resistance — profit-taking and rejection risk)
Buy zone: 4666 – 4670 (shallow pullback within trend)
VL / Value Buy: 4620 – 4625 (deeper pullback — higher-quality dip if yields spike again)
Lower support zones remain a contingency for a deeper flush.
IV. Trading Plan (Brian style — 2 scenarios)
⭐️ PRIORITY SCENARIO — BUY (trend continuation)
Idea: As long as the H4 uptrend holds, look to buy pullbacks into demand with confirmation.
Option A — Buy pullback: 4666 – 4670
SL: below 4620 (more conservative: below 4616–4610 depending on volatility/spread)
TP: 4716 – 4740 – 4774 – 4800
Option B — Value Buy (if a deeper sweep happens): 4620 – 4625
SL: below the nearest H4 swing low / below 460x (risk preference dependent)
TP: 4666 – 4716 – 4774 – 4800
Confirmation cues (optional):
Strong rejection wick at the buy zone, or
H1 micro-structure break back to the upside, or
Liquidity sweep then close back above the zone.
⭐️ ALTERNATIVE SCENARIO — SELL (rejection at Fibonacci resistance)
Idea: With yields rising, gold may react sharply at the top — treat this as a reaction trade, not a macro trend reversal call.
Sell zone: 4774 – 4778 (SELL only if price rejects clearly)
SL: above 4788 – 4800
TP: 4740 – 4716 – 4670
Important: If H4 closes and holds above 4778 (acceptance), the bias shifts to buying pullbacks instead of forcing shorts.

Greenland Tension Escalates – Gold Finds Its N Market Context (News → Capital Flow)
Escalating tensions around the “Greenland purchase” narrative are increasing geopolitical risk.
Markets are responding in a familiar pattern:
USD weakens as political uncertainty rises
Equities face corrective pressure amid risk-off sentiment
Safe-haven flows return to Gold, supporting further upside
In this environment, Gold is not rising on technicals alone,
but because defensive capital is rotating back into the market.
Technical Structure (H1 – SMC)
Price previously executed a downside Liquidity Sweep
A bullish Market Structure Shift (MSS) followed
The impulsive leg created a clear bullish FVG, signaling supply–demand imbalance
Price is currently holding above the FVG, keeping the bullish structure intact
➡️ A familiar model in play:
Liquidity Sweep → FVG → Continuation
Key Zones (Decision Levels)
Upper FVG: 4,642.447
Lower FVG: 4,622.238
Deeper support (OB): around 4,596.733
These are reaction zones, not FOMO areas.
Scenarios (If – Then)
Primary Scenario – Continuation (~70%)
If price holds above 4,622.238
The FVG is considered defended
Bullish continuation toward higher levels remains favored
Aligned with USD weakness + risk-off environment
Alternative Scenario – Pullback (~30%)
If price loses 4,622.238
A corrective move toward the OB near 4,596.733 becomes likely
Only an H1 close below the OB would materially weaken the bullish outlook
Summary
Geopolitical headlines are amplifying volatility,
but the final decision lies in price reaction at the FVG.
Gold is not chasing headlines —
it is following capital seeking safety.

Part 1 Intraday Master Class Option Trading and Volume Profile
Option traders use volume profile to identify:
Value area
Low volume nodes
High volume nodes
Breakout zones
Reversal zones
Options premiums react strongly around:
POC
Imbalance zones
Market structure shifts

GOLD - Breakout Continues, Bullish Momentum Remains StrongGold prices have attracted fresh buying interest for a second consecutive session, reaching a new all-time high and currently trading around $4,710.
The key driver behind gold’s strength is the ongoing global geopolitical and trade uncertainty. Hawkish statements regarding U.S. tariffs and foreign policy, along with the risk of escalating tensions among major economies, have significantly boosted safe-haven demand. In this environment, gold continues to reaffirm its role as a store of value, drawing strong attention from investors worldwide.
Beyond political factors, investment flows into precious metals are clearly increasing. Global gold ETF holdings have risen steadily over recent weeks, signaling long-term market confidence. Notably, strong buying demand from Asia—especially China—is viewed as a major pillar supporting gold’s sustained upward momentum.
🔎 Key Economic Events to Watch This Week
Wednesday: U.S. President Donald Trump speaks at the WEF; U.S. Pending Home Sale
Thursday: U.S. Q3 GDP (final reading), PCE Price Index, Weekly Jobless Claims
Friday: U.S. S&P Preliminary Manufacturing and Services PMI

XAUUSD/GOLD 1H BUY PROJECTION 20.01.261) Market Structure
Price is inside a 4H Uptrend Channel
Trend is clearly bullish (higher highs + higher lows)
2) Pattern Confirmation – Three White Soldiers
3 continuous strong bullish candles
Shows institutional buying momentum
Usually comes after accumulation → breakout
3) Best Entry Zone
📌 Marked as: “ENTRY WITH FAIR VALUE GAP”
Price created an imbalance (FVG) while pumping up
Smart entry is always retest of FVG
✅ That’s the safest buy zone

Mastek 1Day Trend line Breakout Mastek has given a trendline breakout on the daily timeframe, indicating a potential shift in trend. Price has moved above the falling trendline with improving structure, suggesting fresh buying interest. If the breakout sustains, the stock may see further upside in the near term. A retest of the breakout zone can act as support, while failure to hold above the trendline may lead to consolidation. Traders should watch for follow-through and volume confirmation.

Option Trading Strategies Option Greeks in Real Trading
Delta
Use for directional confidence.
High delta = strong directional control.
Theta
Best for sellers; helps identify decay.
Vega
Trade IV spikes and crashes.
Gamma
Important near expiry for fast moves.

NIFTY 50 / TRIPLE TOP IN D TF - DOWNSIDE RISK AHEADNIFTY50 appears to be forming a triple top on the daily timeframe.
Momentum indicators are weakening, suggesting further downside.
Budget day could act as a volatility trigger and potential turning point.
Levels to watch on the downside.

Gold now will correctGold has reached new heights and now time for small profit booking towards 4680 and then again rally will continue! Good luck !!

IFCI 1 Week Time Frame 📌 Current Price Range: ~₹60–₹62 (latest prices reported)
📊 Weekly Technical Levels (1‑Week Time Frame)
Resistance Levels (Upside Targets)
~₹62.2 – First near‑term resistance (weekly reaction zone)
~₹63.6–₹64 – Next resistance cluster and weekly pivot barrier
~₹66–₹69 – Higher resistance zone from classic pivots or multi‑period levels
➡️ These levels act as potential upside caps in a rally over the next few sessions or week. A clean breakout above these with volume could shift bias higher.
Support Levels (Downside Defenses)
~₹56–₹57 – Near support just below current price (week pivot S1/S2)
~₹54–₹55 – Secondary support – often watched if weakness extends
~₹52–₹52.5 – Lower support zone which has historically acted as swing low support in prior ranges
➡️ These levels can be used as short‑term stop or trend invalidation points; if violated, a deeper pullback may unfold.
🕒 How Traders Use These Levels
Level Type Typical Use
Support Place stops just below, monitor for bounce entries
Resistance Consider partial profit booking or watch for breakout
Pivot Midpoint for bias (above → bullish, below → bearish)
👉 A break and sustained close above ₹63.6–₹64 on weekly candles could indicate continuation to the next leg up. Conversely, a close below ₹56 may suggest short‑term weakness. Always confirm with volume & momentum.

LongKey Points About Strategy
1. Identify breakouts using recent pivot highs and lows.
2. For entry or exit, wait for the candle to close above or below the given level; do not wait for the target.
3. Obey the risk–reward ratio strictly.
4. Do not create positions that you cannot manage, and avoid taking multiple positions beyond your capacity.
5. You cannot predict the market in advance—news, results, or corporate actions don’t matter.
Essential Disclaimer:
For education only—this is not financial advice. Always research and consult a licensed advisor.

ADA/USDT Multi-Timeframe Analysis MONTHLY (1M) - Macro Trend
Status: Bearish with Recovery Attempt
Long-term trend: Downtrend established from May 2021 peak (~$3.1)
Support levels: $0.36 (current), $0.26-0.28 (historical support)
Volume profile: Declining volume suggests weakness
Outlook for Feb: Watch for stabilization or further downside to $0.26
WEEKLY (1W) - Intermediate Trend
Status: Neutral to Weak
Current price action: Trading in consolidation zone ($0.36-0.40)
Key support: $0.36 (green horizontal line visible)
Key resistance: $0.42-0.45
Volume: Contracting, suggesting indecision
Status: Bearish Bias
Current pattern: Lower highs, choppy action
Support: $0.3451, $0.33 zone
Resistance: $0.4341 (red zone resistance)
Momentum: Weak, RSI likely in lower zones
Trading range: $0.33-0.435
February 2025 Trading Scenarios
Bullish Scenario :
[Condition: Daily close above $0.40 with volume
Target: $0.50, then $0.55
Stop: Below $0.36
Probability: 35% (weak fundamentals suggest lower probability)
Bearish Scenario :
Condition: Daily close below $0.325
Target: $0.28, then $0.26
Stop: Above $0.385
Probability: 55% (trend remains down)
ADA is in a critical consolidation zone with weak momentum. The month will likely test whether this is a reversal pattern or continuation of the downtrend. Hold above $0.36 for bullish hopes; break below $0.325 confirms further downside to $0.26.
Disclaimer:
The information shared here is for educational and informational purposes only and should not be considered as financial, investment, or trading advice. Trading in stock markets, crypto, forex, or derivatives involves substantial risk, and past performance is not indicative of future results.

HINDUNILVRHINDUNILVR
bullish trend is Showing on the chart.
buy signals in
technical indicators and
Ascending Channel chart pattern.
BUYING RANGE 2400/2410
Watch for a retest 2400/2410 to sustain the bullish trend. If the resistance holds, there could be a retest towards 2200/2210 and an uptrend from here.

Currency (INR) Fluctuations & Export Sector Impact1. Understanding INR Fluctuations
Currency fluctuation refers to the appreciation or depreciation of the INR relative to other currencies.
INR depreciation means the rupee weakens (e.g., ₹75/USD to ₹85/USD).
INR appreciation means the rupee strengthens (e.g., ₹85/USD to ₹75/USD).
These movements are driven by multiple factors:
Interest rate differentials
Inflation trends
Capital flows (FII/DII)
Trade balance and current account deficit
Crude oil prices
Global risk sentiment and US Federal Reserve policy
RBI interventions in the forex market
India, being a net importer of crude oil and capital goods but a strong exporter of services, often experiences mixed effects from INR volatility.
2. Impact of INR Depreciation on Exports
INR depreciation is generally considered favorable for exporters, but its impact varies across sectors.
a) Improved Price Competitiveness
When the INR depreciates, Indian goods and services become cheaper in foreign currency terms. For example, if an Indian exporter sells goods worth ₹1,000:
At ₹75/USD → $13.33
At ₹85/USD → $11.76
This price advantage helps Indian exporters compete better in global markets, especially against exporters from countries with stronger currencies.
b) Higher Export Revenues in Rupee Terms
Exporters earning in foreign currencies benefit when converting earnings back into INR. Even if export volumes remain unchanged, rupee revenues increase, improving cash flows and short-term profitability.
c) Sector-Specific Benefits
IT and IT-enabled services: Major beneficiaries, as revenues are largely in USD while costs are in INR.
Pharmaceuticals: Export-driven firms gain from better margins.
Textiles and garments: Price-sensitive markets benefit from weaker INR.
Engineering goods: Competitive pricing helps capture global orders.
d) Boost to Employment and Capacity Utilization
Higher export demand often leads to increased production, better capacity utilization, and job creation, particularly in labor-intensive sectors like textiles and leather.
3. Challenges of INR Depreciation for Exporters
While depreciation offers advantages, it also creates challenges.
a) Higher Input Costs
Many exporters rely on imported raw materials, components, or machinery. A weaker INR increases the cost of these imports, offsetting the benefits of higher export realization.
b) Margin Pressure
If input cost inflation is higher than export price gains, overall profit margins may shrink. This is common in sectors like electronics, chemicals, and auto components.
c) Hedging Losses
Exporters who have hedged their foreign currency exposure may not fully benefit from sudden depreciation, as forward contracts lock in lower exchange rates.
d) Inflationary Impact
INR depreciation increases import costs, leading to higher domestic inflation. Rising inflation can push up wages and operating expenses, indirectly affecting exporters.
4. Impact of INR Appreciation on Exports
INR appreciation is generally negative for exporters, but it has some indirect benefits.
a) Reduced Price Competitiveness
A stronger INR makes Indian exports more expensive in global markets, potentially reducing demand and export volumes, especially in price-sensitive sectors.
b) Lower Rupee Realizations
Exporters receive fewer rupees for the same foreign currency earnings, impacting revenues and profitability.
c) Pressure on IT and Services Sector
IT companies are particularly sensitive to INR appreciation, as even small currency movements can significantly affect margins due to large overseas revenues.
d) Benefits Through Lower Input Costs
A stronger INR reduces the cost of imported raw materials, energy, and capital goods. This benefits exporters with high import dependency and helps control cost inflation.
5. Volatility vs Direction: Why Stability Matters
For exporters, currency volatility is often more damaging than the direction of movement.
Sudden and sharp fluctuations make pricing difficult.
Long-term contracts become risky.
Forecasting revenues and costs becomes uncertain.
Stable and predictable currency movements allow exporters to plan investments, manage working capital, and negotiate long-term supply agreements effectively.
6. RBI’s Role in Managing INR Fluctuations
The Reserve Bank of India (RBI) plays a critical role in reducing excessive volatility.
Forex market intervention: Buying or selling USD to stabilize INR.
Forex reserves management: Using reserves as a buffer against external shocks.
Interest rate policy: Influencing capital flows and currency demand.
Macroprudential measures: Managing external borrowing and capital inflows.
RBI’s objective is not to target a specific exchange rate but to ensure orderly market conditions.
7. Export Sector Strategies to Manage Currency Risk
Indian exporters actively adopt risk management strategies to mitigate the impact of INR fluctuations.
a) Hedging Instruments
Forward contracts
Options and swaps
Natural hedging (matching import and export cash flows)
b) Market Diversification
Exporting to multiple geographies reduces dependency on a single currency like USD.
c) Value-Added Exports
Moving up the value chain reduces price sensitivity and currency impact.
d) Cost Optimization
Improving operational efficiency helps absorb currency-related cost pressures.
8. Long-Term Structural Impact on India’s Exports
Over the long term, currency movements alone cannot sustain export growth. Structural factors matter more:
Productivity improvements
Infrastructure development
Ease of doing business
Trade agreements
Skill development
Technological innovation
A competitive export sector requires not just a favorable INR but also strong fundamentals.
9. Sector-Wise Sensitivity Summary
Highly Sensitive: IT services, pharmaceuticals, textiles
Moderately Sensitive: Engineering goods, auto components
Less Sensitive: Commodities with global pricing power
10. Conclusion
INR fluctuations have a profound impact on India’s export sector, influencing competitiveness, revenues, costs, and investment decisions. While INR depreciation generally supports exports by improving price competitiveness and boosting rupee earnings, it also raises import costs and inflationary pressures. Conversely, INR appreciation challenges exporters but helps control input costs and inflation.
For sustainable export growth, stability in the currency is more important than extreme movements. A balanced approach by the RBI, combined with effective risk management by exporters and structural reforms by policymakers, is essential to harness the benefits of currency dynamics while minimizing risks. In the evolving global trade environment, the ability of Indian exporters to adapt to INR fluctuations will remain a key determinant of India’s export success.

India equity market outlook 2026 (Sensex & Nifty projections)📈1. Broad Market Outlook: 2025 Recap and 2026 Expectations
🧭 Where Things Stand
Indian equities (Sensex and Nifty 50) have had a mixed performance over 2025:
Markets underperformed global peers and emerging markets, with foreign institutional investors (FIIs) pulling funds due largely to tariff shocks and earnings downgrades.
While local domestic investment has provided some support, volatility has been elevated.
Early 2026 sessions saw indices consolidate with geopolitical and macro risks still influencing sentiment.
Still, analysts broadly expect positive momentum to return by mid-2026, supported by Indian macro resilience and corporate earnings stabilization.
📊 Macro Tailwinds
India’s economy remains one of the fastest-growing among major markets:
The IMF revised India’s growth outlook for FY 2026 to 7.3% — a strong relative pace versus global averages.
Strong nominal GDP growth and inflation within the RBI’s target range are expected to underpin corporate earnings and valuations.
These fundamentals matter because equity markets are ultimately a reflection of economic growth + corporate profit growth.
📌2. Sensex & Nifty 50: Forecasts and Target Ranges for 2026
Numerous brokers and strategists have published prices bands for the major indices by end-2026 or mid-2026. These vary somewhat based on scenario assumptions — but the picture is mostly constructive:
🔹 Consensus Target Ranges
Sensex
Bull case: ~105,000–107,000 by Dec 2026 (reflecting ~20–26% upside).
Base case: ~90,000–95,000 by Dec 2026.
Conservative/neutral: ~89,000–92,000 by mid-2026.
Nifty 50
Bullish targets: ~30,000–32,000 by Dec 2026.
Base case: ~28,500–29,300 by year-end.
Mid-year range: ~27,200 by mid-2026 in some surveys.
These projections aren’t precise predictions — they’re conditional on economic growth, corporate profits, interest rate trends, and global conditions.
🧠3. What’s Driving This Outlook?
📌 A. Earnings Growth Resumption
A key theme underpinning these forecasts is the expectation of a resurgence in corporate earnings growth after a period of downgrades:
Morgan Stanley expects earnings growth of ~17–19% annually through FY28, which supports higher valuations.
JPMorgan highlights domestic demand and fiscal policy as supportive for earnings expansion in 2026.
Stronger earnings often translate into higher index levels through rising EPS × valuation multiples.
📌 B. Valuation Normalization
Indian equities underwent a valuation correction post-pandemic and relative to other emerging markets. Some strategists argue this “reset” makes the market a more attractive entry point:
Morgan Stanley’s base case assumes a P/E of ~23–23.5x, close to long-term averages.
Normalized valuations may reduce downside and set the stage for risk-on sentiment if global conditions improve.
📌 C. Domestic Flows and Policy Support
Domestic institutional investors (DIIs) and retail participation have been structural supports, buffering the market against FII volatility:
Indian households and mutual funds haven’t retreated as sharply as FIIs, providing a stabilizing base.
Monetary policy easing or fiscal incentives could further enhance liquidity and investor confidence.
📌 D. Macro Stability
With inflation under control and growth remaining robust, macro conditions look supportive for 2026:
RBI policy is expected to remain accommodative if inflation stays within target.
GDP and consumption data continue to support robust corporate performance.
These core drivers help explain why most analysts maintain a moderate to strong bullish tilt for 2026.
⚠️4. Key Risks and Challenges
Despite the positive tilt, there are significant headwinds that could derail or slow the rally:
❗ Global Trade & Geo-political Risks
Trade tensions (e.g., U.S.–Europe tariff uncertainties) have caused risk-off moves, pushing volatility higher.
Geopolitical events can influence sentiment and capital flows.
❗ Foreign Investor Flows
FPI outflows have been pronounced recently. If this trend continues, it could keep valuations under pressure or slow index gains.
❗ Corporate Earnings Monitor
Weak earnings in key sectors (e.g., recent underperformance in some IT firms) can affect sentiment and index breadth.
❗ Global Macro Conditions
A global slowdown or higher interest rates in developed markets could make risk assets less attractive, impacting inflows.
❗ Valuation Risks
If valuations re-inflate too rapidly without earnings support, markets could become susceptible to corrections.
Taking these risks together implies that market moves won’t be linear — expect corrections, cycles, and periods of volatility even within a generally positive trend.
🏭5. Sector and Thematic Drivers
Equity performance won’t be uniform across sectors. Some key industry trends likely to influence 2026:
🔹 Financials & Banks
Banks often benefit from higher credit growth, rate stability, and improved asset quality — a backbone of the Indian index structure.
🔹 Technology and IT Services
IT sector growth is tied to global demand. Weakness in contract wins could generate volatility, as seen in recent earnings.
🔹 Domestic Cyclicals
Consumption-linked sectors (consumer goods, autos) may benefit from strong consumer demand and urbanisation trends.
🔹 Capital Goods/Infrastructure
If capex cycles revive (supported by government infrastructure spend), industrials and capital goods could outperform.
📏6. Practical Takeaways for Investors
🧩 Long-Term Lens
Equities historically reward patient investors. While year-to-year volatility is normal, the structural growth story of India is largely intact.
📊 Diversification Matters
Index gains could be consolidated in certain segments while others lag. Diversification helps mitigate sector-specific risks.
📉 Volatility Is Likely
Short-term fluctuations — due to geopolitical news, earnings surprises, or global risk events — should be expected.
📈 Domestic Flows + Policies
Domestic investor behaviour and policy actions will be key determinants of medium-term trends.
📦7. Summary Projection
Benchmark Base-Case Target (2026) Bull-Case Target (2026) Notes
Sensex ~90,000–95,000 ~105,000–107,000 Earnings rebound + macro tailwinds
Nifty 50 ~28,500–30,000 ~30,000–32,000 Domestic resilience + valuation normalisation
These ranges reflect collective broker views and are conditional, not guaranteed.
📊 Final Thought
India’s equity markets in 2026 appear poised for a continuation of the long-term growth trajectory, though characterized by selective risks and volatility cycles. Solid fundamentals — including strong GDP growth, supportive policy, and a resurgent earnings cycle — underpin the positive outlook. However, external shocks, geopolitical tensions, or slower global recovery could moderate performance or introduce cyclic retracements.
In navigation terms, 2026 likely won’t be a straight rally — but rather a trend with periodic corrections, with significant opportunities for investors who combine long-term conviction with risk awareness.

FII vs DII Flows : A Detailed ExplanationCapital markets are driven not only by company fundamentals and economic data but also by the flow of institutional money. Among the most influential participants in emerging markets like India are Foreign Institutional Investors (FIIs) and Domestic Institutional Investors (DIIs). Their investment flows significantly impact market direction, volatility, liquidity, and investor sentiment. Understanding the difference between FII and DII flows is essential for traders, long-term investors, and policymakers alike.
1. Understanding FIIs and DIIs
Foreign Institutional Investors (FIIs)
FIIs are investors or investment funds based outside the country where they invest. In India, FIIs include:
Foreign mutual funds
Pension funds
Hedge funds
Sovereign wealth funds
Insurance companies and investment banks
They invest in Indian equities, debt markets, derivatives, and other financial instruments, subject to regulatory norms set by SEBI and the RBI.
Domestic Institutional Investors (DIIs)
DIIs are institutional investors based within the country. In India, DIIs include:
Indian mutual funds
Insurance companies (LIC, private insurers)
Banks and financial institutions
Pension and provident funds
DIIs primarily manage domestic savings and channel household money into financial markets.
2. What Are FII and DII Flows?
Flows refer to the net amount of money bought or sold by these institutions in the market during a specific period (daily, monthly, yearly).
Positive flow: Net buying (more purchases than sales)
Negative flow: Net selling (more sales than purchases)
For example:
If FIIs buy ₹10,000 crore worth of shares and sell ₹8,000 crore, net FII flow = +₹2,000 crore
If DIIs sell more than they buy, their flow is negative
3. Key Differences Between FII and DII Flows
Aspect FII DII
Origin Foreign Domestic
Capital Source Global funds Indian household savings
Investment Horizon Often short-to-medium term Mostly long-term
Sensitivity Highly sensitive to global cues More stable and patient
Currency Risk Exposed to INR fluctuations No currency risk
Market Impact Can cause sharp moves Helps stabilize markets
4. Drivers of FII Flows
FII flows are influenced by global and macroeconomic factors, such as:
a) Global Interest Rates
When interest rates rise in developed markets (especially the US), FIIs tend to withdraw money from emerging markets and invest in safer assets like US bonds.
b) Dollar Strength
A strong US dollar often leads to FII outflows from India because currency depreciation reduces returns when converted back to dollars.
c) Global Risk Sentiment
During periods of risk-off sentiment (wars, financial crises, recessions), FIIs reduce exposure to emerging markets.
d) Relative Valuations
If Indian markets appear expensive compared to other emerging markets, FIIs may shift funds elsewhere.
e) Political and Policy Stability
Clear government policies, reforms, and political stability attract FII inflows, while uncertainty causes outflows.
5. Drivers of DII Flows
DII flows are largely influenced by domestic economic conditions and savings behavior:
a) SIP and Mutual Fund Inflows
Regular SIP investments from retail investors provide steady inflows to mutual funds, enabling DIIs to buy equities consistently.
b) Insurance and Pension Funds
Long-term funds from insurance premiums and retirement contributions are systematically invested in markets.
c) Domestic Economic Growth
Strong GDP growth, corporate earnings, and consumption trends encourage DIIs to increase equity exposure.
d) Market Corrections
DIIs often view market corrections as buying opportunities, especially in quality stocks.
e) Regulatory Environment
Policies promoting financialization of savings (like tax benefits on mutual funds or pension schemes) boost DII participation.
6. Impact of FII Flows on the Market
FII flows often set the short-term market trend:
Large FII buying can push indices sharply higher
Heavy FII selling can trigger market corrections or crashes
FII activity increases volatility due to large ticket sizes
Sectors heavily owned by FIIs—such as IT, banking, and large-cap stocks—are especially sensitive to FII flows.
7. Impact of DII Flows on the Market
DII flows act as a counterbalance to FII volatility:
DIIs provide stability during FII selling phases
Long-term buying helps form market bottoms
Consistent SIP-driven inflows reduce dependence on foreign capital
In recent years, strong DII participation has reduced the overall impact of FII outflows on Indian markets.
8. FII vs DII: Tug of War in Indian Markets
Indian markets often witness a tug of war between FIIs and DIIs:
When FIIs sell aggressively due to global concerns, DIIs often absorb the supply
When FIIs buy heavily, DIIs may book profits
This dynamic determines short-term price movements and market breadth.
Example:
During periods of global uncertainty, FIIs may be net sellers, but strong DII inflows (via mutual funds and insurance companies) can prevent sharp market falls.
9. Changing Trend: Rising Power of DIIs
Over the last decade, India has seen a structural shift:
Rising financial literacy
Growth in SIP culture
Increasing household participation in markets
As a result:
DIIs have become stronger and more influential
Market dependence on FIIs has reduced
Indian markets have become more resilient to global shocks
This marks a transition from foreign-driven markets to domestically supported markets.
10. How Retail Investors Should Interpret FII and DII Flows
Retail investors should use FII–DII data as a sentiment indicator, not a trading signal:
Persistent FII buying indicates global confidence
Heavy FII selling signals caution and volatility
Strong DII buying reflects domestic confidence in long-term growth
However, blindly following institutional flows can be risky. Flows should be analyzed along with:
Market valuations
Earnings growth
Technical levels
Macroeconomic indicators
11. Limitations of FII and DII Flow Analysis
Flows are reported with a time lag
They do not reveal stock-specific strategies
Institutions may hedge positions using derivatives
Short-term flows may not reflect long-term outlook
Hence, flow data should be used as context, not confirmation.
12. Conclusion
FII and DII flows are powerful forces shaping the Indian equity market. FIIs bring global capital, liquidity, and international perspective, but their money is highly sensitive to global conditions. DIIs represent domestic conviction, long-term capital, and market stability, increasingly acting as shock absorbers during periods of foreign selling.
The evolving dominance of DIIs reflects the growing maturity of India’s financial ecosystem. For investors, understanding the interaction between FII and DII flows provides valuable insight into market sentiment, risk appetite, and potential trend direction. Ultimately, a balanced market supported by strong domestic institutions and healthy foreign participation is ideal for sustainable long-term growth.
