AUDUSD LONG SETUP — Bullish Reversal from DemandAUDUSD has tapped into a strong demand zone aligned perfectly with a long-term ascending trendline, showing signs of potential bullish reversal. Price swept the previous intraday liquidity and reacted strongly, indicating buyers are stepping in.
This confluence makes this area a high-probability long setup.
Description
Price dropped into a well-defined demand zone around 0.66720–0.66650, which overlaps with the ascending trendline support drawn from previous higher lows. The sweep of liquidity below the zone suggests a fakeout and accumulation, increasing the probability of a bullish move.
If price maintains above the zone and starts forming bullish structure, we can expect a continuation towards the previous swing highs.
📝 Trade Plan (Suggestive)
Entry: 0.66798 (within demand zone)
Stop Loss: Below zone at 0.662
Take Profit 1: 0.67100 (previous structure high)
Take Profit 2: 0.67320 (premium zone)
Risk–Reward: ~1:2
🔍 Reasons to Take This Trade
✔ Demand Zone Reaction
✔ Trendline Confluence
✔ Liquidity Sweep Below Zone
✔ Strong Wick Rejection Showing Buyers
✔ Price in Discount (Buy-side value area)
Disclaimer: for educational purpose
Chart Patterns

NIFTY : Trading levels and Plan for 20-Jan📘 NIFTY Trading Plan – 20 Jan 2026
Timeframe: 15-minute
Gap Criteria Considered: 100+ points
Market Structure: Short-term corrective phase after rejection from upper range, base formation near intraday support
🔼 SCENARIO 1: GAP UP OPENING (100+ points) 🚀
If NIFTY opens above 25,667, it signals bullish intent with short-covering momentum.
Immediate resistance zone lies at 25,667 – 25,682 (Opening / Last Resistance).
Sustained price acceptance above 25,682 on a 15-min close can trigger upside continuation.
Upside targets to watch:
• 25,740
• 25,791
Expect minor pullbacks near resistance; fresh longs only on pullback + hold above broken levels.
Avoid chasing gap-up candles without retest confirmation.
📌 Options Strategy (Gap Up):
• Bull Call Spread (ATM Buy + OTM Sell)
• Avoid naked CE buying near resistance
• Trail profits aggressively as volatility expands 📈
➡️ SCENARIO 2: FLAT / RANGE OPENING ⚖️
If NIFTY opens within 25,529 – 25,568, market enters a balance / no-trade zone.
This zone acts as Opening Support Zone for flat markets.
Expect whipsaws and fake breakouts initially.
Upside trade activates only above 25,682.
Downside pressure increases below 25,529.
Best environment for patience and structure-based entries.
📌 Options Strategy (Flat Market):
• Short Strangle / Iron Condor (only for experienced traders)
• Focus on theta decay ⏳
• Keep strict SL on breakout from range
🔽 SCENARIO 3: GAP DOWN OPENING (100+ points) 📉
If NIFTY opens below 25,529, bears gain control early.
First support zone is 25,422 – 25,364 (Intraday Demand Zone).
Expect a technical bounce, but trend remains weak below resistance.
Breakdown below 25,364 can open deeper downside.
Avoid bottom fishing until strong bullish reversal candle appears.
📌 Options Strategy (Gap Down):
• Bear Put Spread preferred
• Avoid aggressive PE selling in trending markets
• Quick scalps only, book fast 📉
🧠 Risk Management Tips for Options Trading 🛡️
Risk only 1–2% of capital per trade.
Expiry week = faster premium decay & sharp moves.
Prefer spreads over naked option buying.
No revenge trading after SL hits.
Always wait for 15-min structure confirmation before entry.
📌 Summary & Conclusion ✨
NIFTY is currently trading near a short-term balance zone.
📍 25,529 – 25,568 is the key decision-making area.
📍 Sustained move above 25,682 may revive bullish momentum.
📍 Below 25,529, downside risk increases sharply toward 25,422.
Trade light, respect levels, and let price confirm direction.
⚠️ Disclaimer
This content is for educational purposes only.
I am not a SEBI registered analyst.
Markets are uncertain, and I can be wrong.
Please consult your financial advisor before trading.

Hidden Channels & Fib Golden Zone : Beauty of Price ActionObservational Post only Showcasing how price action works using historical price points only
Observe how price elegantly respects this counter trendline on the weekly chart (red line), forging consistent lower highs through precise rejections. A subtle parallel channel lurks beneath, acting as a hidden guardian. Channels like these shield against fakeouts, confirming pure breakouts only when breached alongside key lines.
Shifting to the monthly view, the Fib retracement from swing low to high highlights the golden zone (50 to 61%, white shaded), a magnet for retracements where price often pauses or reverses with stunning symmetry.
This interplay reveals price action's beauty: layers of structure working in harmony, rewarding patient observers.
Disclaimer: This is for educational purposes only, showcasing historical price action observations. Not financial advice. Always conduct your own analysis and manage risk appropriately.

RELIANCE may head for 1111 #RELIANCE is forming a NEAT 3-3-5 FLAT and should head for 1111. Anybody in EW kindly study and share views. In simple terms if you see the two DTF and WTF charts , the stock is forming a 3-3-5 FLAT correction STARTING 12 July 2024 where sub wave -a has three sub waves culminating at 1114 on 07 Apr 2025 and sub sub -c of this wave is ending as a 5 wave Ending Diagonal. Then we have sub wave-b going up in three sub waves again culminating at 1611 high on 03 Jan 2026. Now I am looking for sub wave -c going deep down to 1111 in five sub waves 1-2-3-4-5 as I have shown in the DTF Chart. ANALYSIS INVALIDATION 1611 ( or even 1575 may be good enough for invalidation). THIS DTF CHART ( Daily Time Frame).Lets C

“Liquidity Grab → Pivot Support Holds → Next Bullish Leg Loading🔍 Market Structure & Key Observations
Overall market structure remains bullish with clear higher highs & higher lows ✔️
Price is respecting the upward trendline, confirming ongoing bullish momentum 📈
The recent sharp drop was a liquidity sweep into the Pivot Point / Demand zone, followed by a strong bullish reaction → Smart Money accumulation 💼💰
Multiple POI (Point of Interest) reactions below show buyers are active on dips
Current consolidation above the Pivot Point zone suggests preparation for the next impulsive move up, not distribution
🎯 Suitable Target Zones (High Probability)
🎯 Primary Target (TP1)
➤ 4,615 – 4,625 🎯
Prior resistance / range high
Liquidity resting above recent consolidation highs
Most realistic short-term objective
🚀 Extended Target (TP2)
➤ 4,650 – 4,670 🚀💸
Measured move from the last bullish impulse
Upper expansion of the ascending structure
Valid if bullish momentum accelerates
📌 Optional BUY Trade Idea (Trend-Following)
🟢 Buy Zone (on pullback):
➤ 4,560 – 4,580
(confluence of Pivot Point + trendline support)
❌ Stop-Loss (invalidation):
➤ Below 4,540
🎯 Take Profit:
TP1: 4,620 🎯
TP2: 4,660 🚀
📊 Risk–Reward: approx. 1:2.5 – 1:3+
🧭 Market Outlook Summary
Factor Bias
Trend Bullish 📈
Momentum Buyers in control 💪
Structure Continuation pattern ✅
Liquidity Upside targets active 💧

Mirrored Repetition of Structure Possible?In the world of trading, "mirrored repetition of structure" is a core concept used by technical analysts to find order in the chaotic movement of prices. It is based on the idea that market psychology is cyclical—fear and greed repeat in predictable geometric shapes.Depending on how you view the market, this mirroring can be categorized into three main types:1. Mirror Levels (Support & Resistance Flip)This is the most common form of "mirrored structure." A price level that once acted as a ceiling (Resistance) is broken and then becomes the new floor (Support).The Logic: When price returns to a previous peak from above, traders who "missed out" on the original move now see it as a bargain, mirroring the previous rejection behavior but in the opposite direction.The Pattern: Often visualized as a "Break and Retest."2. Geometric Symmetry (Harmonic & Chart Patterns)Traders look for "Symmetrical Repetition" where the second half of a pattern mirrors the first.Double Tops/Bottoms: An "M" or "W" shape where the second peak/trough mirrors the first, indicating a structural rejection.ABCD Patterns: The market moves in a specific leg ($A$ to $B$), retraces ($B$ to $C$), and then repeats the first move almost exactly ($C$ to $D$). This is a literal repetition of structural distance and time.Symmetrical Triangles: Price is squeezed between two mirroring trend lines, indicating a "coil" where buyers and sellers are reaching a point of perfect, repeated equilibrium before a breakout.3. Fractal Structure (Self-Similarity)This is the most advanced form of mirrored repetition. In Fractal Theory (popularized by Benoit Mandelbrot), the structure of the market is mirrored across different timeframes.The Concept: A 5-minute chart might show a specific zigzag pattern that is a miniature version of a pattern currently forming on the Daily chart.Mirroring Scales: The "structure" repeats itself, meaning the way the market moves over 1 hour is often a mirrored or scaled-down version of how it moves over 1 year.

Reliance Industries Limited (RIL)Reliance is looking Good near 1380-1400 Rs support zone. RSI is also at oversold zone (26.70). Considering it for short term move with upside potential of 8 - 11 %.
1560 - 1575 Rs is a strong supply zone for it.
Target 1 : 1500-1510 RS
Target 2 : 1550 - 1560 Rs
Disclaimer : The Above shared Content is for information and education purposes only and should not be treated as investment or trading advice. Im not SEBI registered, Contact your financial advisor before any investment.

Nifty: Fear is there, but price is still fightingToday’s daily candle is clearly saying one thing. The market is not in surrender mode yet.
Yes, the index closed in red, but the structure is still intact.
The daily candle has a small body.
Selling came on the downside, but the close was not near the lows.
That tells us there is pressure, not panic.
Sentiment is weak, confidence is low, and retail participants are cautious.
Usually, in such conditions, prices fall fast.
But that is not happening here.
This is the most important clue.
Look at the price structure.
NSE:NIFTY has been pulling back from higher levels for the last few sessions,
but it has not given a clear breakdown yet.
Demand is repeatedly showing up near the 25500–25480 zone.
Intraday charts confirm this.
Down moves are not impulsive.
After every sell-off, price goes flat and gets absorbed.
So fear exists, but supply is not aggressive.
Sector behaviour supports the same story.
The broader market is weak, high beta stocks are under pressure.
But capital is not fully exiting the market.
FMCG and Pharma are showing relatively better strength.
This is a classic defensive rotation.
The market is not running away from risk, it is just shifting risk.
This does not mean a rally is about to start.
It simply means the market has not entered panic distribution.
For tomorrow, the structure-based scenarios are simple.
If the index holds above the 25500 zone
and selling remains shallow,
this is likely a time correction, not a crash.
If another dip comes due to fear
and that dip is again quickly absorbed,
it will point toward stronger base formation.
Real risk starts only if
price sustains below 25450 with heavy volume.
That behaviour is not visible yet.
Retailers are afraid.
Price is neutral to defensive.
Sector rotation is defensive.
All three signals are aligned.
The market is scared, but not broken.
In such phases, there is no need to be a hero.
Just stay disciplined and observe.
The market is speaking, not shouting.
Only those who listen survive.
That’s all for today.
Keep reading structure, stay away from emotions.
Tomorrow, the market will again show the next move on its own.

BANK NIFTY - Technical Analysis Bank Nifty is showing an interesting setup on the weekly chart.
After breaking out above its previous all-time high, the index has started contracting in a tight range, indicating healthy consolidation.
On the daily timeframe, it continues to take support near the 9 EMA, and during minor dips, it has also reversed from the 20 EMA, reflecting strong buying interest.
If Bank Nifty breaks out of this range with momentum, the upside potential remains open, sky’s the limit.
In case of a pullback, watch these key support zones:
🟩 57,500 – first immediate support
🟩 57,160 – secondary support
🟩 56,600 – third support
🟩 56,000 – major support zone if deeper retracement occurs
Overall market structure is Bullish, and a bit more consolidation or a short pullback will only strengthen the base for a sustained breakout.
✅ If you like my analysis, please follow me here as a token of appreciation :)
in.tradingview.com/u/SatpalS/
📌 For learning and educational purposes only, not a recommendation. Please consult your financial advisor before investing.

HEGHEG - The structure remains bullish.
The stock recently broke above a year-long resistance around 617 and then pulled back for a healthy retest. It found support near the 550 zone and around the 50 EMA, followed by a clear reversal.
Price has also respected the 0.618 Fibonacci (golden ratio) level, which adds strength to the setup. A breakout from the current range could lead to a fresh upside move.
Keep it on your watchlist.
✅ If you like my analysis, please follow me here as a token of appreciation :)
in.tradingview.com/u/SatpalS/
📌 For learning and educational purposes only, not a recommendation. Please consult your financial advisor before investing.

Investment pick NTPC@344 -fundamental ideaNot a SEBI registered, just sharing idea. Investment pick - NTPC @ 344. In future lot of data centers were build which require huge and continuous power supply. Future will be of Nuclear power plant - NTPC & Adani Power will foray into Nuclear field. NTPC agreement with NPCIL to build nuclear plant and adani power also going to build. Target - 3X or 5X ++

Bitcoin Bybit chart analysis JENUARY 19Hello
It's a Bitcoin Guide.
If you "follow"
You can receive real-time movement paths and comment notifications on major sections.
If my analysis was helpful,
Please click the booster button at the bottom.
Here's a Bitcoin 30-minute chart.
The Nasdaq is closed today.
I developed a strategy centered around the upper Gap 7.
*When the red finger moves,
One-way long position strategy.
1. $92,756.9 is the entry point for a long position. / Stop loss if the green support line is broken.
2. $95,506.9 is the first target price at the top -> Target prices are Good, Great, and so on.
If the strategy is successful, 94.5K is the point where I can re-enter the long position.
If the purple support line holds, a vertical rise is possible.
The first section below is a sideways market.
Below that is the bottom. The gray line is a mid-term uptrend line.
So, if the price holds at section 1 today, it's good for a long position.
Since the Nasdaq is closed,
Bitcoin also seems likely to move sideways.
As per the rule, I followed the trend-following strategy.
Up to this point, I ask that you use my analysis for reference only.
I hope you operate safely, with a focus on principled trading and stop-loss orders.
Thank you.

Bitcoin Bybit chart analysis JENUARY 16Hello
It's a Bitcoin Guide.
If you "follow"
You can receive real-time movement paths and comment notifications on major sections.
If my analysis was helpful,
Please click the booster button at the bottom.
This is Bitcoin's 30-minute chart.
There are no separate indicators released today.
Currently, the 6-hour MACD is forming a dead cross.
I've kept it as simple as possible.
*Long position strategy before and after the purple finger touches the top line
1. After the purple finger touches the first line (autonomous short)
-> Red finger: $95,235.6, long position entry point
/ Stop-loss price if the purple support line is broken
2. $97,512.1, long position first target
-> Target price from the top to 104.7K, sequentially over the weekend
If the top fails to touch the first line and immediately falls,
final hold on the long position at the second line (No.2) / Stop-loss price if the purple support line is broken
From the purple support line break,
Bottom -> Open to $93,555.6. If it falls to this level, the medium-term pattern will be broken again, so it may take a long time to rise.
*The price must not move sideways until the weekend,
and must not fall to the bottom.
It will hit 104.7K strongly and may see new highs starting next week.
Please use my analysis to this point for reference only.
I hope you operate safely, with principled trading and stop-loss orders essential.
Thank you.

XAUUSD (Gold) 45-Minute Chart – Bullish Trend Holding with MomenTrend & Structure:
Gold remains above the ascending trendline, confirming a valid short-term bullish trend. The recent candles show sideways consolidation after a strong impulsive rise, which typically favors continuation as long as support holds.
Price Action:
The market is forming higher lows while compressing below recent highs. This price behavior suggests indecision, not rejection—buyers are still defending dips.
RSI (14):
RSI is around 57–58, holding above the 50 level. This indicates bullish momentum, though momentum has stabilized rather than accelerated, consistent with consolidation.
Awesome Oscillator (AO):
AO bars remain above zero but decreasing, signaling that bullish momentum is cooling, not reversing. A fresh green expansion would confirm continuation.
MACD:
MACD histogram is slightly negative and contracting, while lines are flattening. This supports a pause within trend, not a confirmed bearish crossover.
Key Levels:
Immediate Support: Rising trendline / recent higher-low zone
Resistance: Consolidation highs near the recent swing top
Trend Failure: Strong close below the trendline

POLICYBZR – Textbook Tweezer Bottom at Trendline SupportPOLICYBZR has formed a perfect Tweezer Bottom exactly at a rising demand / support trendline, indicating strong buying interest at lower levels. Sellers tried to push price below this zone but failed twice, which confirms absorption of supply.
This reaction is not random — it’s happening:
At a well-defined support trendline
After a controlled decline
With immediate bullish response, showing rejection of lower prices
What this means structurally:
As long as price holds above the tweezer low, downside risk remains limited
The first upside test will be the nearby supply zone / previous consolidation area
A sustained move above that zone can shift the structure back toward higher highs
This is a low-risk observation zone, where price action confirmation matters more than speed.
No indicators needed — pure price behavior is speaking.

COLPAL – Compression Near Lower Channel | Early Strength EmerginCOLPAL has been moving inside a long-term falling channel, respecting both the upper resistance and lower support trendlines. Recently, price has rebounded from the lower channel support, indicating demand at lower levels.
The structure shows gradual compression near the support zone, suggesting selling pressure is reducing. Today’s move signals early strength, but the trend is not confirmed yet.
As long as price holds above the lower trendline, the structure remains constructive.
A decisive breakout above the falling channel would be the real confirmation of trend reversal.
Until then, this remains a wait-and-watch zone, where price behavior matters more than prediction.
Simple chart. Clear structure. Patience required.

Equitas Small Finance Bank – Swing Trade ViewPrice has broken out of a long-term falling channel, signaling a trend shift from bearish to bullish.
Post-breakout structure shows higher highs and higher lows, confirming strength.
Price has broken out of a long-term falling channel, signaling a trend shift from bearish to bullish.
Buy Zone :
₹66–₹67 on pullback to former resistance turned support
Or on daily close above ₹70 for continuation
Stop-Loss:
Below ₹65 (structure-based)
Targets:
T1: ₹73–₹75
T2: ₹78–₹80

EURJPY – High-Probability Reversal from Discount ZoneTrade Idea
EURJPY has tapped a major higher-timeframe discount zone and formed a strong reaction from the extreme demand area. Price swept the liquidity resting below 182.80–182.60, tapped the Strong Low, and instantly rejected with a long wick—signaling aggressive buy-side interest.
Key Confluences
Liquidity Sweep: Equal lows + previous liquidity at the discount zone fully taken.
Strong Demand Zone Tested: Price wicked into a deep discount FVG + demand block.
Rejection Candle: Strong bullish reaction, showing buyers defending the level.
Structure Context: Market is in a corrective down-move, but HTF trend remains bullish.
FVG Above as Magnet: A clean inefficiency up to 183.80–184.10, ideal for targets.
Entry: 182.85 – 183.05 (discount zone tested + confirmation wick)
Stop Loss: Below the sweep — 182.45
Take Profit 1: 183.50 (first FVG fill)
Take Profit 2: 183.90 (premium zone / previous BOS area)
Take Profit 3: 184.15 (HTF supply & equilibrium)
Risk-Reward: ~1:3.2 to 1:4 depending on entry refinement
Probability: High—due to liquidity sweep + demand tap + immediate rejection
EURJPY has reached a major higher-timeframe discount zone and swept downside liquidity. Price tapped into a strong demand block and instantly rejected, signaling potential bullish reversal. With clean imbalances above and prior structural levels acting as magnets, this area provides a high-probability long setup. As long as price holds above 182.60, bullish targets remain valid.
Disclaimer: for educational purpose only.

Gold Trapped in Liquidity Range – Expansion PendingGold is currently trading in a post-impulse environment after completing a clear Elliott Wave advance. With the higher-timeframe impulse exhausted, price action has transitioned into a controlled consolidation driven by liquidity, rather than trend continuation.
At this stage, the market is not trending — it is preparing.
Market Structure & Liquidity Context
Price is now boxed between a well-defined Equal High and Equal Low, forming a classic liquidity range. This structure suggests that Smart Money is engineering both sides of liquidity before committing to the next directional move.
The upper range aligns with premium pricing, where buy-side liquidity is resting.
The lower range sits in discount territory, overlapping with higher-timeframe demand.
This environment favors rotation and stop-hunt behavior, not impulsive expansion.
Key Trading Scenarios
🔴 Sell reaction at the highs
If price pushes above the Equal High and taps into the 4688–4690 premium zone , this area is expected to attract sell-side interest. A clear rejection or hesitation here would signal that buy-side liquidity has been taken, opening the door for a rotation back into the range.
🟢 Buy reaction at the lows
If price drops and reaches the 4388–4390 discount zone , this level becomes a key area to watch for support. Strong rejection or stabilization would suggest Smart Money defense, favoring a bounce back toward equilibrium.
Expectation & Bias
This is a rotation market, not a trend market.
Directional continuation should only be expected after a clear break and acceptance outside the range.
Until then:
Patience > prediction
Liquidity > indicators
Reaction > anticipation
Let price show its hand.
💬 Do you expect expansion to come from the highs or the lows first?
Your perspective matters — share your view.

Part 1 Technical Analysis VS. Institutional Trading Common Mistakes Traders Make
Buying OTM options expecting miracles
No stop-loss on option selling
Trading without understanding volatility
Getting trapped during reversal
Overtrading
Trading during low liquidity
Holding positions during events without hedges

HCLTECHHCLTECH
bullish trend is Showing on the chart.
buy signals in
technical indicators and
Ascending Channel chart pattern.
BUYING RANGE 1690/1700
Watch for a retest 1690/1700 to sustain the bullish trend. If the resistance holds, there could be a retest towards 1480/1500 and an uptrend from here.

iifl finance 5min chart pe clean bullish breakout iifl finance 5min chart pe clean bullish breakout dikh raha hai
price ne descending trendline ke upar strong breakout diya hai with volume support. consolidation ke baad higher highs & higher lows ban rahe hain, jo bullish continuation signal hai.
🔹 trade plan (intraday / short-term swing)
buy above: 651
stop loss: 639
targets:
t1: 6500
t2: 6530
🔹 technical view
trendline breakout confirmed
price vwap ke upar sustain kar raha hai
volume spike breakout candle pe visible
retest zone near 645–647 holding strong
jab tak price 639 ke upar hold karta hai, bullish bias intact rahega. below 639 close aane par setup invalidate ho jayega.
risk reward approx 1:2+

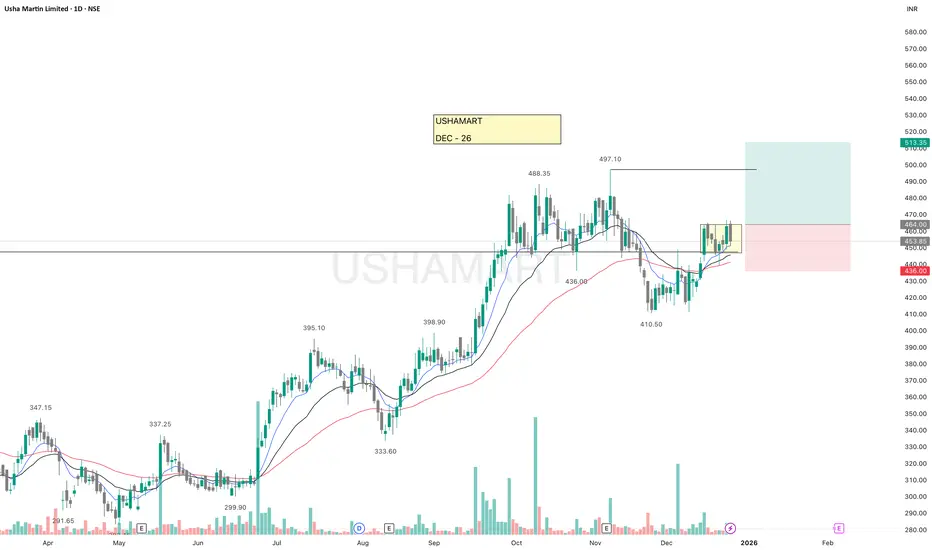
USHAMARTUSHAMART is looking good.
It recently broke above a key resistance and successfully retested the breakout zone. Since then, price has been consolidating in a tight range above all major EMAs and resistance, indicating strength.
The overall market structure remains bullish, suggesting a higher probability of further upside.
Keep this on your watchlist for paper trading and observation.
✅ If you like my analysis, please follow me here as a token of appreciation :)
in.tradingview.com/u/SatpalS/
📌 For learning and educational purposes only, not a recommendation. Please consult your financial advisor before investing.