Forex (Currency) Trading: A Comprehensive OverviewIntroduction
Forex, short for “foreign exchange,” is the largest and most liquid financial market in the world. Unlike stock markets, Forex operates 24 hours a day, five days a week, and involves the trading of currencies. It is a decentralized global marketplace where currencies are bought, sold, and exchanged at fluctuating prices. Forex trading is essential for international trade, investment, and global business, as it allows companies, governments, and individuals to convert one currency into another.
The Forex market is unique because it is over-the-counter (OTC), meaning transactions occur directly between participants, usually via electronic trading platforms or over the phone, rather than centralized exchanges like the NYSE or NASDAQ.
How Forex Trading Works
In Forex trading, currencies are quoted in pairs, such as EUR/USD, USD/JPY, or GBP/USD. The first currency in the pair is called the base currency, and the second is the quote currency. The price of a currency pair represents how much of the quote currency is needed to buy one unit of the base currency. For example, if EUR/USD = 1.1000, it means 1 Euro costs 1.10 US dollars.
Key Concepts:
Bid and Ask Price:
The bid price is the price at which the market is willing to buy a currency.
The ask price is the price at which the market is willing to sell a currency.
The difference between them is called the spread, which represents the broker’s profit.
Leverage and Margin:
Forex brokers offer leverage, allowing traders to control large positions with a small amount of capital. For example, 50:1 leverage allows a trader to control $50,000 with just $1,000.
Margin is the amount of money a trader must deposit to open a leveraged position. While leverage can amplify profits, it can also magnify losses, making risk management critical.
Lot Sizes:
Forex trades are executed in standard sizes called lots:
Standard Lot: 100,000 units of base currency
Mini Lot: 10,000 units
Micro Lot: 1,000 units
Nano Lot: 100 units
Choosing the right lot size is essential to balance potential profits with risk.
Pips and Pip Value:
A pip (percentage in point) is the smallest price movement in a currency pair. Most currency pairs are quoted to four decimal places, so 0.0001 USD is one pip for pairs like EUR/USD. Traders use pips to measure gains or losses.
Participants in the Forex Market
The Forex market includes a wide range of participants:
Central Banks and Governments:
They intervene to stabilize their national currency or implement monetary policy. For example, the Federal Reserve may buy or sell dollars to influence the USD’s value.
Commercial Banks and Financial Institutions:
They provide liquidity and trade on behalf of clients or for proprietary profit.
Corporations:
Companies engaged in international trade use Forex to hedge currency risk. For example, an Indian exporter receiving payments in USD might convert it to INR.
Retail Traders:
Individual traders speculate on currency price movements to profit. Retail Forex trading has grown rapidly thanks to online platforms and leverage.
Types of Forex Trading
Forex trading can be approached in multiple ways:
Spot Forex:
The immediate exchange of currencies at the current market price. Most retail traders participate in the spot market.
Forward Forex Contracts:
Agreements to exchange currencies at a future date and at a predetermined rate. Often used by corporations to hedge risk.
Futures Forex Contracts:
Standardized contracts traded on exchanges like CME, specifying the amount, price, and delivery date for currencies.
Options and CFDs:
Options give the right, but not the obligation, to buy or sell a currency at a future date.
CFDs (Contracts for Difference) allow speculation on currency movements without owning the actual currency.
Major, Minor, and Exotic Currency Pairs
Currencies are categorized based on liquidity and popularity:
Major Pairs:
Include the most traded currencies, always involving USD, e.g., EUR/USD, USD/JPY, GBP/USD, USD/CHF.
Minor Pairs (Crosses):
Pairs that do not include USD, e.g., EUR/GBP, AUD/NZD.
Exotic Pairs:
Combinations of a major currency with a currency from an emerging market, e.g., USD/TRY (US Dollar/Turkish Lira). Exotics tend to be more volatile and less liquid.
Factors Affecting Currency Prices
Currency prices fluctuate due to multiple factors:
Economic Indicators:
GDP growth, employment data, inflation, and trade balances influence currency value.
Central Bank Policy:
Interest rates and monetary policy decisions impact currency strength.
Political Stability:
Elections, geopolitical tensions, and policy changes create volatility.
Market Sentiment:
Traders’ perceptions, speculation, and risk appetite drive short-term movements.
Global Events:
Natural disasters, pandemics, and trade agreements can cause sharp currency swings.
Trading Strategies
Technical Analysis:
Traders analyze charts, trends, support/resistance levels, and indicators (RSI, MACD, moving averages) to predict price movements.
Fundamental Analysis:
Focuses on macroeconomic data, interest rates, and geopolitical events to make trading decisions.
Trend Following:
Traders follow prevailing market trends, buying in an uptrend and selling in a downtrend.
Range Trading:
Profiting from price fluctuations within defined support and resistance levels.
Scalping and Day Trading:
Short-term strategies focusing on small price movements, often using high leverage.
Risks in Forex Trading
While Forex trading offers opportunities, it is high-risk:
Leverage Risk:
Amplifies both profits and losses. A wrong trade can wipe out an account quickly.
Market Risk:
Unpredictable economic or geopolitical events can cause sudden swings.
Interest Rate Risk:
Changes in interest rates affect currency valuations.
Liquidity Risk:
Some exotic currencies may lack liquidity, leading to difficulty entering or exiting positions.
Psychological Risk:
Emotions like fear and greed can lead to impulsive trading decisions.
Advantages of Forex Trading
High Liquidity:
Trillions of dollars are traded daily, ensuring easy entry and exit.
24-Hour Market:
Traders can trade around the clock, accommodating different time zones.
Leverage Opportunities:
Allows small capital to control large positions.
Diverse Strategies:
Forex supports long-term investing, day trading, swing trading, and scalping.
Conclusion
Forex trading is a dynamic and complex financial market that offers vast opportunities for profit, hedging, and international business operations. However, its decentralized nature, high leverage, and rapid fluctuations make it a high-risk endeavor requiring knowledge, discipline, and a robust risk management strategy. Successful Forex traders combine technical and fundamental analysis, stay updated with global economic events, and maintain emotional control to navigate the market effectively.
In today’s digital era, retail traders have unprecedented access to Forex through online platforms, brokers, and educational resources. While it can be rewarding, Forex trading is not a “get-rich-quick” scheme—it demands patience, continuous learning, and practical experience. Understanding market mechanics, currency behavior, and risk management is key to achieving long-term success in this fast-paced and fascinating financial world.
Chart Patterns

Introduction to Cryptocurrency and Digital AssetsBlockchain Technology: The Backbone
At the heart of cryptocurrencies is blockchain technology, a distributed ledger system that records all transactions across a network of computers. A blockchain consists of a chain of blocks, each containing transaction data, timestamp, and a cryptographic hash of the previous block. This design ensures:
Transparency: All transactions are visible to network participants.
Security: Cryptographic algorithms protect against fraud and unauthorized alterations.
Decentralization: No single entity controls the ledger, reducing the risk of manipulation.
Immutability: Once recorded, transactions cannot be changed or deleted.
Beyond just financial transactions, blockchain enables smart contracts—self-executing agreements coded into the blockchain—which expand the utility of digital assets into areas like decentralized finance (DeFi), supply chain management, and digital identity verification.
Types of Cryptocurrencies and Digital Assets
1. Cryptocurrencies:
Cryptocurrencies are digital currencies designed to work as a medium of exchange. They include:
Bitcoin (BTC): The first and most well-known cryptocurrency, used as a store of value and medium of exchange.
Ethereum (ETH): A platform cryptocurrency that enables smart contracts and decentralized applications (dApps).
Stablecoins: Cryptocurrencies pegged to fiat currencies like USD (e.g., USDT, USDC), designed to reduce volatility.
Altcoins: Alternative cryptocurrencies with varied purposes, such as Ripple (XRP) for cross-border payments or Cardano (ADA) for sustainable blockchain operations.
2. Digital Tokens:
These are blockchain-based units that can represent a variety of assets:
Utility Tokens: Provide access to a platform or service, like Binance Coin (BNB) for exchange fee reductions.
Security Tokens: Represent ownership of real-world assets such as shares, bonds, or real estate, regulated under securities laws.
Non-Fungible Tokens (NFTs): Unique tokens representing ownership of digital or physical items like art, music, or collectibles.
3. Tokenized Assets:
Blockchain allows real-world assets—stocks, real estate, commodities—to be converted into digital form, making them easier to trade, fractionalize, and secure.
Use Cases of Cryptocurrencies and Digital Assets
Financial Transactions and Remittances:
Cryptocurrencies enable peer-to-peer payments without intermediaries, reducing fees and transaction times for international transfers.
Decentralized Finance (DeFi):
DeFi platforms use smart contracts to offer banking services like lending, borrowing, and yield farming without traditional banks.
Digital Ownership and NFTs:
NFTs revolutionize digital ownership, allowing artists, gamers, and content creators to monetize their digital creations and maintain provable ownership.
Investment and Speculation:
Cryptocurrencies and digital assets are increasingly seen as investment vehicles, attracting both retail and institutional investors seeking diversification and high returns.
Cross-Border Payments and Financial Inclusion:
Cryptocurrencies provide access to financial systems for unbanked populations, offering secure and cost-effective cross-border transactions.
Supply Chain and Identity Verification:
Blockchain’s transparency ensures traceability of goods, anti-counterfeiting measures, and secure digital identities.
Advantages of Cryptocurrencies and Digital Assets
Decentralization reduces reliance on central banks and financial institutions.
Transparency and security make financial operations more trustworthy.
Efficiency in cross-border transactions and settlements.
Innovation potential with smart contracts and tokenization.
Financial inclusion, particularly in regions with limited access to banking.
Challenges and Risks
Despite their promise, cryptocurrencies and digital assets face significant challenges:
Volatility: Prices can fluctuate wildly, making them risky for investors and unstable as currencies.
Regulatory Uncertainty: Governments vary in their approach to regulation, ranging from outright bans to active adoption.
Security Concerns: Hacks, scams, and loss of private keys pose risks to users.
Scalability Issues: Popular networks like Ethereum have faced congestion and high transaction fees.
Environmental Impact: Proof-of-work-based cryptocurrencies, such as Bitcoin, consume enormous amounts of energy.
Adoption Barriers: Limited understanding, technological literacy, and infrastructure issues slow mainstream adoption.
Regulation and Legal Landscape
Governments worldwide are exploring how to regulate cryptocurrencies and digital assets to prevent fraud, money laundering, and market manipulation while enabling innovation. Regulatory approaches include:
Licensing cryptocurrency exchanges.
Taxation on transactions and holdings.
Oversight of stablecoins and digital banking platforms.
Creating central bank digital currencies (CBDCs) as regulated alternatives.
Countries like Japan and Switzerland have embraced crypto-friendly regulations, whereas others like China have restricted trading and mining activities.
Future of Cryptocurrencies and Digital Assets
The future of digital assets is promising but uncertain. Key trends include:
Integration with traditional finance: Banks and financial institutions are increasingly exploring crypto custody, trading, and payment systems.
Expansion of DeFi: More financial services may migrate to decentralized networks.
Tokenization of assets: Ownership of real-world assets will become more flexible, liquid, and transparent.
CBDCs and hybrid models: Central banks are exploring digital currencies that combine regulation with blockchain efficiency.
Greater mainstream adoption: Merchants, consumers, and enterprises may increasingly accept cryptocurrencies for payments and investments.
The evolution of cryptocurrency and digital assets could redefine how value is stored, transferred, and created globally, challenging traditional financial systems while opening new opportunities for innovation, inclusion, and efficiency.
Conclusion
Cryptocurrencies and digital assets represent a revolutionary shift in the way people perceive and interact with money, ownership, and digital ecosystems. While they bring enormous opportunities for financial innovation, inclusion, and efficiency, they also carry inherent risks related to volatility, security, and regulation. The continued development of blockchain technology, smart contracts, tokenization, and decentralized finance is likely to shape the future of global finance, making it more transparent, accessible, and efficient. As adoption grows, understanding the fundamentals, potential, and pitfalls of cryptocurrencies and digital assets is essential for investors, policymakers, and the general public alike.
Speculative Path-1 for Bitcoin for 2026Bitcoin ( BITSTAMP:BTCUSD ) price action has been showing a lot of weakness lately, even though equities and metals are in bullish zones. That's the nature of the cycle of this asset class that we have to deal with.
In Q1, we may see Bitcoin drift to $74,000 levels, where it will make a local bottom. This scenario will be accompanied by a correction in equity and commodity markets due to the looming fear of recession.
With the possible change of helm at the Federal Reserve and the likelihood of interest rate cuts, we may observe a countertrend rally towards $87,000. And that will become an inflection point for two possible scenarios. Today, we are discussing the Part-1 scenarios that has higher possibility.
At $87,000, we may face resistance at the price levels and the 20WSMA/21WEMA, which can trigger a downward slide towards $68,000 in Q2. With a possible formation of a bearish head and shoulders pattern, with $74,000 as the neckline being breached, new short sellers will enter the market. But it's noteworthy to mention that the $65,000-$69,000 levels were the top of the 2021 bull market, which will act as a strong support going forward.
Again, a snappy countertrend rally can take the prices to $80,000 levels in Q3. The final bottom may happen in Q4 at around $65,000-$69,000 levels, where the prices will meet the 200WSMA. This moving average has been the single most important factor when it comes to searching for Bitcoin market bottoms.
Even on the BTC Power Law chart, we will then enter the ultimate bullish zone for buying. At the lowest gray band, between $66,000-$74,000 levels, long-term investors will step in.
With an unconvincing/incomplete bearish H&S pattern and a lot of shorts in the system, that's when the new bull market will start.
I will present the Part-2 scenario in a different post.

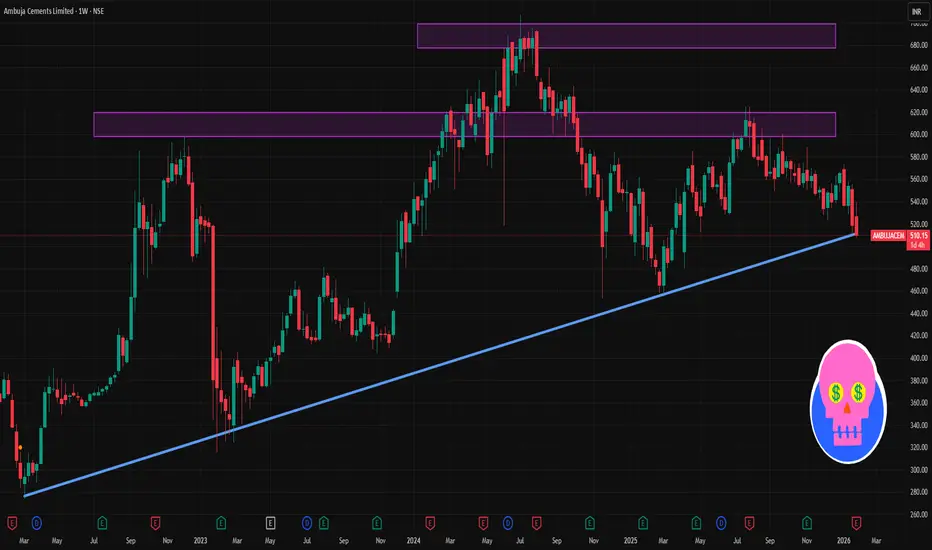
AMBUJACEM 1 Week Time Frame 📊 Current Price Context
The stock has recently traded around ₹510 – ₹536 after earnings‑related volatility.
The 52‑week range is roughly ₹455 (low) to ₹625 (high).
🔁 1‑Week Technical Levels (approx)
Key resistance (levels where sellers may step in):
₹542‑₹545: Near recent pivotal resistance zone.
₹552‑₹558: Secondary resistance cluster short‑term.
Key support (levels where buyers may defend):
₹527‑₹528: Initial support within the week.
₹521‑₹516: Next support zone if the dip extends.
₹500 – ₹495: Stronger longer‑term support if selling intensifies.
📉 Short‑Term Trend & Signal
Technical aggregators rate the stock as weak/neutral to bearish on the 1‑week timeframe — meaning downside risks currently outweigh upside signal.
Price below recent pivot and moving averages suggests bearish short‑term momentum absent close above resistance.
📌 Practical Swing Levels (Simple Guide)
Bullish trigger zone: closing above ₹545‑₹550 on weekly closes could make higher levels nearer ₹560+ possible.
Bearish trigger zone: closing below ₹520 may open path toward ₹500 and deeper.
HINDZINC 1 Month Time Frame 📍 Current Price Snapshot (latest close / recent trade)
HINDZINC is trading around ~₹628–₹630 on NSE/BSE — after some volatility in recent sessions. Its 52‑week high is ~₹733 and 52‑week low ~₹378.15, showing wide longer‑term movement.
🛠 1‑Month Technical Levels (Support & Resistance)
These are the key zones traders watch for a 1‑month period based on pivot analysis and recent price action:
🔼 Resistance Levels (Upside Targets)
1. ₹705 – ₹715: Immediate resistance zone around recent highs and pivot R1/R2 cluster.
2. ₹735 – ₹750: Next major supply/resistance area — crossing this would signal stronger upside continuation.
3. ₹760 – ₹780+: Extended breakout zone if sentiment turns sharply bullish (higher targets from pivot extensions).
📌 Overall, ₹705–₹715 is the near‑term hurdle the stock needs to clear for a bullish run.
🔽 Support Levels (Downside Price Floors)
1. ₹690 – ₹700: First strong support near recent consolidation lows/pivot S1.
2. ₹670 – ₹680: Secondary support — a deeper pullback zone.
3. ₹650 – ₹660: Key base area — breakdown below this can signal more downside pressure.
4. ₹620 – ₹630: Major structural support if broad market or metals weakness intensifies.
📌 The ₹670–₹700 band acts as the core support area this month.
⚠️ Quick Summary
✔ Above ₹705–₹715 = bullish continuation likely.
✔ Between ₹670–₹700 = consolidation zone.
✔ Below ₹650 = risk of deeper retracement.

Finolex Cables Daily Chart on Price action A daily price action with EMAs, trendlines, and RSI.
1. Price Action & EMAs: The stock is trading at ₹722.25 with a +1.61% gain. The price is below the EMAs (orange 200, green 100, blue 55, red 21), indicating a bearish trend in the short to medium term. The EMAs are sloping downward, suggesting continued weakness.
2. Trendline: A white ascending trendline acts as support near ₹700–₹710. The recent price is testing this line, showing potential for a bounce if it holds.
3. RSI: The RSI (purple line at the bottom) is around 40, indicating neutral to slightly bearish momentum with no extreme oversold or overbought conditions.
The RSI is forming a rising base, hinting at possible positive divergence. . This is a Bullish Divergence when the price makes a lower low, but the RSI forms a higher low. It suggests weakening downside momentum and a possible upcoming upward reversal.
4. The View: The stock shows signs of consolidation near the support trendline. A break above the nearest EMA (red line, ~₹740) could signal short-term bullishness, while a fall below the trendline may trigger further downside.
Divergence alone isn’t a trade signal; it warns of momentum shifts.
Combine with price action (breakouts, support/resistance) for confirmation.
RSI levels (40/70 or 60/80) can add context to divergence strength.
Over-reliance without confirming price action may lead to premature trades.
Possible Price Action:
Buy if Price crosses above the nearest EMA (red/short‑term EMA ≈ ₹740) with the EMA turning flat or upward.
Volume confirmation: The crossover occurs on above‑average volume (at least 1.5× the 20‑day average volume), showing strong buying interest.
Target: Close above ₹740–₹745, indicating a shift from bearish to bullish EMA alignment.
Exit (Sell) Conditions:
Profit target: Sell when the price reaches the next EMA resistance or target zone ₹780–₹800, accompanied by decreasing volume or profit‑taking signals.
Stop loss: Place a stop‑loss at ₹695–₹700 (below the trendline support and recent low) to protect against EMA breakdown. Trigger on high volume if the price breaches this level, confirming a reversal.

Introduction to Bonds and Fixed IncomeTypes of Bonds
Bonds can be categorized in several ways depending on the issuer, structure, and underlying risk:
Government Bonds:
These are issued by national governments and are generally considered low-risk investments because they are backed by the government’s credit. Examples include U.S. Treasury Bonds, UK Gilts, and Indian Government Securities (G-Secs). Government bonds are used to fund public projects, manage debt, and control money supply in the economy.
Corporate Bonds:
Issued by private or public corporations, these bonds typically offer higher yields than government bonds due to increased credit risk. Corporations issue bonds to raise capital for expansion, acquisitions, or refinancing existing debt. Corporate bonds are rated by credit agencies (like Moody’s, S&P) to indicate the issuer's creditworthiness.
Municipal Bonds:
Issued by state, city, or local governments, municipal bonds finance public projects like infrastructure, schools, or hospitals. In some countries, municipal bond interest is tax-exempt, making them attractive to investors in higher tax brackets.
Zero-Coupon Bonds:
These bonds do not pay periodic interest (coupons). Instead, they are sold at a discount to their face value, and investors earn the difference when the bond matures. They are often used for long-term goals, such as funding education or retirement.
Inflation-Linked Bonds:
Also known as Treasury Inflation-Protected Securities (TIPS) in the U.S., these bonds adjust the principal value with inflation, providing protection against rising prices. They are particularly useful for investors concerned about purchasing power erosion.
Convertible Bonds:
These are corporate bonds that can be converted into a specified number of shares of the issuing company. They combine the features of debt (interest payments) and equity (potential stock appreciation).
How Bonds Work
When an investor buys a bond, the issuer agrees to pay the investor:
Coupon Payments: Regular interest payments, typically semi-annual or annual. The coupon rate is set at issuance and remains fixed for most bonds, although some bonds have floating or variable rates tied to benchmarks like LIBOR or government rates.
Face Value / Principal: The amount invested, returned at the maturity date.
For example, a 10-year bond with a face value of $1,000 and a 5% annual coupon would pay $50 per year for ten years and return $1,000 at the end of the term.
Bond Pricing and Yield
The price of a bond and its yield have an inverse relationship. When interest rates rise, bond prices fall, and when interest rates fall, bond prices rise. This is because new bonds are issued at current rates, making older bonds with lower coupons less attractive.
Key terms include:
Yield to Maturity (YTM): The total return an investor can expect if the bond is held until maturity, including all coupon payments and capital gains or losses.
Current Yield: The annual coupon divided by the current market price of the bond.
Coupon Rate: The interest rate paid by the bond based on its face value.
Understanding these metrics is crucial for investors to compare bonds with different maturities, coupon structures, and credit qualities.
Risks in Bond Investing
Although bonds are generally safer than stocks, they are not risk-free. The main risks include:
Interest Rate Risk: Bond prices move inversely to interest rates. Long-term bonds are more sensitive to rate changes.
Credit Risk / Default Risk: The risk that the issuer may fail to pay interest or principal. Government bonds usually have lower credit risk compared to corporate bonds.
Inflation Risk: Fixed coupon payments lose value if inflation rises. Inflation-linked bonds can mitigate this risk.
Liquidity Risk: The possibility that an investor cannot easily sell a bond at a fair price. Bonds of smaller companies or municipalities may be less liquid.
Reinvestment Risk: The risk that coupon payments may be reinvested at lower rates than the original bond.
Fixed Income Investment Strategies
Investors use several strategies when investing in bonds:
Buy and Hold: Holding bonds until maturity ensures receipt of coupon payments and principal repayment, reducing market timing risks.
Laddering: Purchasing bonds with staggered maturities reduces interest rate and reinvestment risk.
Barbell Strategy: Investing in short-term and long-term bonds, avoiding intermediate maturities, balances liquidity and yield.
Bond Funds and ETFs: Investors can also gain exposure to diversified portfolios of bonds through mutual funds or exchange-traded funds (ETFs), which provide liquidity and professional management.
Role of Bonds in a Portfolio
Bonds play several critical roles in a diversified investment portfolio:
Capital Preservation: They protect the principal while providing steady income.
Income Generation: Regular coupon payments can serve as a reliable source of cash flow.
Risk Reduction: Bonds tend to be less volatile than equities and can offset stock market fluctuations.
Liquidity Management: Bonds with shorter maturities or highly liquid government bonds can be used for near-term cash needs.
Inflation Protection: Inflation-linked bonds help preserve purchasing power over time.
Global and Indian Bond Market Overview
Globally, the bond market is larger than the equity market. The U.S. Treasury market is the most liquid and widely followed benchmark for interest rates and economic health. Other developed markets, such as Europe and Japan, also have significant bond markets, while emerging markets like India, Brazil, and China are rapidly growing.
In India, bonds are issued by the government (G-Secs, T-Bills), corporates, and municipalities. The Reserve Bank of India (RBI) regulates government securities, while SEBI oversees corporate bonds. The Indian bond market has been growing, driven by institutional investors such as banks, insurance companies, and mutual funds, along with retail investors seeking stable returns in a low-interest-rate environment.
Conclusion
Bonds and fixed income securities are indispensable tools for both issuers and investors. They provide predictable returns, diversify investment portfolios, and offer stability in volatile markets. Understanding the types of bonds, how they work, pricing, yields, and associated risks allows investors to make informed decisions tailored to their financial goals and risk tolerance.
In a world where equity markets are volatile and uncertain, bonds remain a cornerstone for conservative investors, retirees, and institutions seeking steady income and capital preservation. Combining bonds with equities and other asset classes creates a balanced, resilient portfolio that can withstand market fluctuations while achieving long-term financial objectives.

Advanced Technical Analysis: A Comprehensive Guide1. Principles of Advanced Technical Analysis
At its core, technical analysis is based on three main principles:
Price Discounts Everything: All information — news, fundamentals, market sentiment — is reflected in the price. Advanced TA accepts this as a foundation, emphasizing price action over external factors.
Price Moves in Trends: Markets trend in three ways — uptrend, downtrend, and sideways. Advanced analysis focuses on identifying the start and end of these trends with precision using sophisticated tools.
History Repeats Itself: Patterns, behaviors, and psychology tend to repeat due to human nature. Advanced TA uses pattern recognition and statistical methods to capitalize on these repetitive behaviors.
Advanced TA combines these principles with quantitative methods and behavioral insights to increase accuracy.
2. Advanced Chart Patterns
While basic patterns include head and shoulders, double tops, and triangles, advanced patterns are more nuanced:
Harmonic Patterns: These patterns, like the Gartley, Butterfly, Bat, and Crab, use Fibonacci ratios to identify precise reversal zones. Unlike basic patterns, harmonic patterns offer a mathematically-defined framework for entry and exit.
Elliott Wave Theory: Developed by Ralph Nelson Elliott, this theory identifies recurring waves in price movement — impulsive (trend-following) and corrective (counter-trend) waves. Advanced traders use Elliott Wave to forecast multi-timeframe trends and market cycles.
Market Profile: This tool analyzes the distribution of traded volume at different price levels to identify value areas, points of control, and price acceptance zones. Market Profile is highly useful for intraday and institutional trading strategies.
3. Advanced Technical Indicators
Beyond moving averages and RSI, advanced traders rely on more sophisticated indicators:
Ichimoku Kinko Hyo: Often called the “one-glance indicator,” it provides support, resistance, trend direction, and momentum in one chart. The Kumo (cloud) identifies trend strength and potential reversals.
Fibonacci Extensions & Retracements: Advanced traders use Fibonacci levels not just for retracements, but for projecting price targets and stop-loss levels. Confluences with other indicators improve accuracy.
MACD with Histogram Divergence: While the basic MACD identifies trend and momentum, analyzing divergences between MACD and price uncovers early reversal signals.
Volume-based Indicators: Tools like On-Balance Volume (OBV), Chaikin Money Flow (CMF), and Volume Price Trend (VPT) help identify accumulation or distribution phases, indicating potential breakouts or breakdowns.
Adaptive Indicators: Indicators like Adaptive Moving Average (AMA) and Kaufman’s Efficiency Ratio adjust to market volatility, providing a more responsive approach than static indicators.
4. Multi-Timeframe Analysis
Advanced traders rarely rely on a single timeframe. Multi-timeframe analysis involves examining multiple chart intervals — from monthly to intraday — to identify trends and align trades with higher-probability setups. Key principles include:
Top-Down Approach: Start with a higher timeframe to identify the major trend, then use lower timeframes to refine entries and exits.
Timeframe Confluence: Trades are stronger when multiple timeframes agree on trend direction, support/resistance, and momentum.
Fractal Patterns: Price movements repeat across timeframes, allowing traders to anticipate behavior in smaller or larger scales using fractal analysis.
5. Advanced Price Action Techniques
Price action analysis is the study of raw price behavior without relying heavily on indicators. Advanced techniques include:
Order Flow Analysis: Examining the flow of buy and sell orders in real-time markets to understand institutional activity and anticipate price moves.
Candlestick Confluence: Combining multiple candlestick patterns across higher and lower timeframes to validate reversals or continuation signals.
Support/Resistance with Precision: Using historical highs/lows, pivot points, Fibonacci levels, and volume clusters to identify high-probability zones for entries and exits.
Trend Exhaustion Signals: Recognizing signs of overextension, like long wicks, shrinking volume, or divergence in oscillators, to anticipate reversals.
6. Quantitative and Statistical Methods
Professional technical analysis increasingly incorporates quantitative methods:
Statistical Indicators: Bollinger Bands, Standard Deviation Channels, and Keltner Channels help identify volatility, mean reversion, and breakout points.
Correlation Analysis: Examining how assets or indices move in relation to each other to hedge or amplify trades.
Backtesting and Algorithmic Validation: Advanced traders validate strategies using historical data, Monte Carlo simulations, and statistical models to measure risk and probability of success.
7. Risk Management and Trade Psychology
Advanced technical analysis is incomplete without rigorous risk management:
Position Sizing: Using volatility, ATR, or percentage-based methods to determine trade size.
Stop-Loss Placement: Placing stops beyond key support/resistance, volatility levels, or pattern invalidation points.
Reward-to-Risk Optimization: Targeting trades with at least a 2:1 or 3:1 reward-to-risk ratio ensures long-term profitability.
Psychological Discipline: Advanced traders maintain emotional control, avoid overtrading, and adhere strictly to plan-based trading.
8. Integration with Fundamental and Sentiment Analysis
Though TA focuses on price, advanced practitioners often combine it with fundamental and sentiment insights:
Macro Events: Interest rates, earnings, or geopolitical developments can amplify technical setups.
Market Sentiment Indicators: Commitment of Traders (COT) reports, VIX index, and news sentiment can provide context to technical signals.
Confluence Approach: Trades with alignment between technical setups, fundamental catalysts, and market sentiment tend to have the highest probability.
9. Algorithmic and Machine Learning Approaches
Modern advanced technical analysis increasingly incorporates algorithmic trading and AI:
Pattern Recognition AI: Machine learning models can detect complex chart patterns faster and more accurately than humans.
Predictive Analytics: Using historical price, volume, and alternative data to predict probabilities of trend continuation or reversal.
Automated Execution: Advanced traders often use bots and automated scripts to execute trades when conditions are met, reducing emotional bias and ensuring precision.
10. Key Takeaways
Advanced technical analysis is more than chart reading; it is an integrated science of price, volume, momentum, and psychology. Key principles for mastery include:
Understanding multi-timeframe trends.
Combining advanced indicators, harmonic patterns, and Elliott Wave.
Using quantitative validation and backtesting for strategy reliability.
Integrating price action with institutional order flow and sentiment data.
Implementing strict risk management and psychological discipline.
By combining these tools, techniques, and analytical frameworks, traders can increase the probability of success, adapt to changing market conditions, and make informed decisions beyond simple guesswork. Advanced technical analysis is not about finding “guaranteed” trades but about stacking probabilities in your favor.
$XRP is currently sitting at the lower trendline support CRYPTOCAP:XRP is currently sitting at the lower trendline support of a falling wedge on the daily timeframe. This is a sensitive area where price usually decides between relief bounce or deeper continuation — and right now, pressure is clearly building.
The 1.71 level is the key line in the sand.
Bearish continuation scenario🔽
If 1.71 gets lost with acceptance:
Structure breaks down
High probability move toward 1.58
Further weakness can drag price into 1.40 zone
This would confirm a deep correction, not just a pullback.
Bullish recovery scenario 🔼
For bulls to regain control:
Price must reclaim and hold above 1.80
Acceptance above this region opens room for: 2.00 - 2.20
Until then, any bounce remains corrective, not trend-changing.
This is a wait-for-confirmation zone.
Let the level decide — not hope.

STARHEALTH 1 Week View📌 Current Reference Price: ~₹469 (last session high ~₹478, low ~₹446) (not real‑time).
📊 Weekly Time Frame Levels (Support & Resistance)
🔺 Weekly Resistance Levels
These are areas where price may face selling pressure or pause on upward moves:
R1: ~₹478–₹480 zone — recent short‑term rejection area near high of week.
R2: ~₹492–₹495 — next weekly resistance from pivot projections.
R3: ~₹514–₹516 — extended weekly resistance from standard pivot/levels.
Key Breakout Level:
➡️ Weekly close above ~₹480–₹485 would signal stronger upside continuation on the weekly chart.
🔻 Weekly Support Levels
Important zones where buyers may step in on pullbacks:
S1: ~₹450–₹455 area — near pivot support & intermediate support.
S2: ~₹430–₹435 — broader weekly support cluster.
S3: ~₹408–₹420 — structural support from longer pivot zones.
Key Breakdown Level:
➡️ Weekly close below ~₹430–₹435 could open deeper correction toward the ₹408–₹420 area.
📈 Weekly Pivot Context (Classic/Fibonacci)
From wider pivot calculations for weekly timeframe:
Weekly Pivot (Center): ~₹454–₹460
Weekly Fibonacci Resistances: ~₹478 (R1), ~₹492 (R2)
Weekly Fibonacci Supports: ~₹431 (S2), ~₹393–₹408 range lower support.
This means the current weekly range is roughly ₹430–₹480, with the pivot/cycle zone around ₹454–₹460 providing a reference for bias (bullish above, bearish below).
📌 Weekly Technical Bias
Weekly momentum on some platforms shows mixed/neutral signals (RSI near neutral, price around pivot).
Shorter price action suggests recent rejection near higher levels (~₹478–₹480).
Interpretation:
📌 Bullish weekly view as long as price holds above ~₹450–₹455.
📌 Bearish weekly view if price closes below ~₹430 weekly, which could risk deeper support tests.

STAR 1 Day View 📌 Live Price Snapshot
• Current price: ~₹877.00 on NSE (Last traded)
• Today’s range: ₹791 – ₹908.40
• 52-Week range: ₹513.05 – ₹1,025.00
📊 Daily Pivot & Key Levels (1-Day Timeframe)
These are approximate pivot, support and resistance levels based on the most recent pivot analysis published today:
📍 Pivot Point
Central Pivot: ~ ₹850.8
🛑 Resistance Levels
R1: ~ ₹868.1
R2: ~ ₹891.0
R3: ~ ₹908.3
(These are short-term upside barriers where price may slow/reverse)
🟩 Support Levels
S1: ~ ₹827.9
S2: ~ ₹810.6
S3: ~ ₹787.7
(These are immediate downside zones where price could find buying interest)
📌 How to Use These Levels Today
✔ Bullish view:
• Above Pivot ₹850.8 → watch for closing above R1 (~₹868) to strengthen upside bias.
• Breaking and holding above R2 (~₹891) could extend toward R3 (~₹908).
✔ Bearish/Range view:
• Failure below Pivot ₹850.8 or S1 (~₹827.9) increases odds of deeper correction toward S2/S3.
• Intraday rejections at R1/R2 can signal short-term sellers.

USDT Dominance Inverted H&S breakout?? USDT Dominance in the system indicates the risk appetite of traders to stay with the risk assets (BTC, ETH, etc.) or migrate towards risk-free assets (USDT). The higher the value, the more bearish it is for risk assets.
Currently, the chart indicates that there is potential formation of an inverted head & shoulder pattern. This means that if the USDT dominance manages to close above 6.21% on a weekly basis, there is a good chance that we are heading towards Crypto winters, i.e. bear market.

Breakout in Coca ColaThe stock formed a triangle and gave a breakout. The levels marked with red lines will act as a support in case we see a retreat to breakout levels. Expecting the stock to be overall in bull trend in next months

Petronet LNG weekly price action analysis for Feb-Mar 2026Analysis date: 31-Jan-26
Please note: This analysis is for education purpose only for those who seek to understand price action.
Forthcoming Budget/Qtrly Results may render this analysis invalid.
Please consult with your financial advisor before taking any decisions.
Petronet LNG seems to have formed a good base/support in 285-265 region spending almost 6 months forming a cluster of HH/HL/LH/LL as seen on the charts.
If the stock comes near 285 to 265 region it may take support for targets near 305/320 levels. Keep SL at 260
Happy Trading!

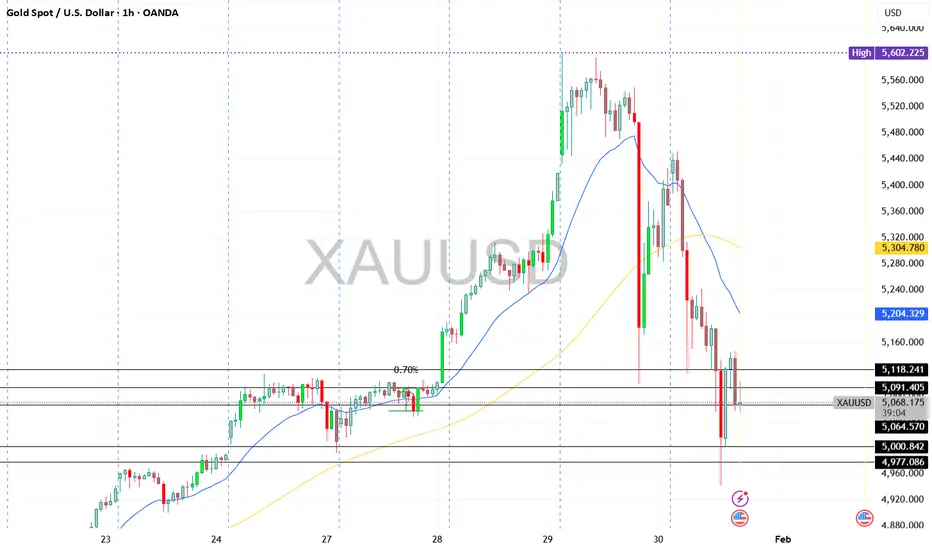
XAUUSD – Historic Volatility Doji at 1.618 | Exhaustion SignalXAUUSD – HTF Exhaustion at 1.618 | Major Volatility Signal Formed
GOLD HAS PRINTED ITS BIGGEST DOJI IN ENTIRE HISTORY OF DAY CANDLE NEARLY 490$ FROM LOW TO HIGH AND ENDED WITH INDECISION. LETS SEE WHAT HAPPENS NEXT . WAIT FOR LOW AND HIGH OF DOJI.......?
Gold has reacted precisely from the 1.618 Fibonacci extension zone (~5600), where price printed a high at 5597.04 and faced strong rejection.
The current Daily candle is forming an exceptionally large indecision candle (Doji-like structure) after a strong impulsive move.
With an intraday range of nearly 490$, this candle highlights clear exhaustion and aggressive profit-taking at premium prices.
Technical Perspective
Clear rejection from the 1.618 extension resistance
Strong volatility spike following a vertical price expansion
Daily candle structure suggests weakening bullish momentum
Key HTF Levels to Watch
Resistance / Supply: 5580 – 5615
Immediate Reaction Zone: 5350 – 5400
Major Support / Rebalancing Area: 5000 – 4900
HTF Value Area Low: Below 4900 (only if bearish momentum accelerates)
Expectation (Next Sessions / 1–2 Weeks)
As long as price remains below the 1.618 rejection zone, probability favors:
Consolidation or corrective price action
Gradual rotation toward 5000–4900 HTF demand
No immediate V-shaped recovery unless strong acceptance above 5600 is seen

STYLEBAAZA | Bullish Continuation Alert – Flag PatternDISCLAIMER: This is solely an observation and should not be considered a trade recommendation. Please conduct your own analysis before making any trading decisions.
Market Snapshot
- CMP: 325.15
- Pattern: Flag formation
- Status: Pole completed; flag currently in progress
- Volume: Recently showing notable increase
Key Levels
- Breakout Trigger: Daily close above 345.25 could signal strong upward momentum
- Target: 460
- Stop Loss: Flag low

Bank Nifty spot 59610.45 by Daily Chart view - Weekly UpdateBank Nifty spot 59610.45 by Daily Chart view - Weekly Update
- Support Zone 58850 to 59350 for Bank Nifty
- Resistance Zone 59900 to ATH 60437.35 for Bank Nifty
- Bank Nifty seems more matured then Nifty to contain the unwarranted Geo-Political scenario and trending up for New ATH

DAILY FOREX SCAN Session – 22 30 01 26Scanning multiple forex pairs to filter high-quality trade setups. No trades are forced—only structure-based opportunities.
Note: There may be a delay in this video due to upload processing time.
Disclaimer: FX trading involves high leverage and substantial risk, and losses can exceed your initial investment. This content is for educational purposes only and should not be considered financial advice. Trade at your own risk.

XAUUSD – INTRADAY🔴 Market Structure
Overall trend: Bearish
Price making lower highs
Current bounce = pullback into resistance
✅ ENTRY (BEST AREA)
Sell between: 5085 – 5100
Or sell on rejection below 5105
🎯 TARGETS
Target 1: 🎯 5045
Target 2: 🎯 5000
Target 3 (extension): 🎯 4945
🛑 STOP LOSS (STRICT)
SL: ❌ 5140

Bharat Electronics Limited Weekly Chart
4 EMA Analysis: The stock is trading above the 21, 55, 100, and 200 EMAs(Red, Blue, Green & Orange respectively) indicating a bullish trend. The EMAs are also in a positive alignment, suggesting a strong uptrend.
Volume Analysis: The breakout was supported by healthy volume expansion, validating the move. There's no major selling pressure visible near the breakout zone.
RSI Indicators: The RSI has crossed 60, reflecting healthy strength without signs of exhaustion.
Based on these indicators, the technical analysis suggests:
The trend is bullish, with buyers maintaining control above key demand zones.
The stock is likely to continue its uptrend, with potential targets at ₹460-₹480 (positional).
Support levels to watch: ₹428 - ₹420.
Further prediction:
A daily close above ₹422 could trigger stronger moves, opening room for fresh highs.
If the resistance holds, there could be a retest towards ₹340-₹360, followed by an uptrend.
Keep an eye on the volume and RSI for any signs of exhaustion or reversal. Majorly trend looks positive .

US30Greetings!
Welcome traders.
By choosing to "Follow", you can stay updated with the latest information promptly. Kindly consider clicking "Boost" as well.
Wishing you a pleasant day.
🎯Risk 1% per trade
🎯Risk management is the key to be successful in this game
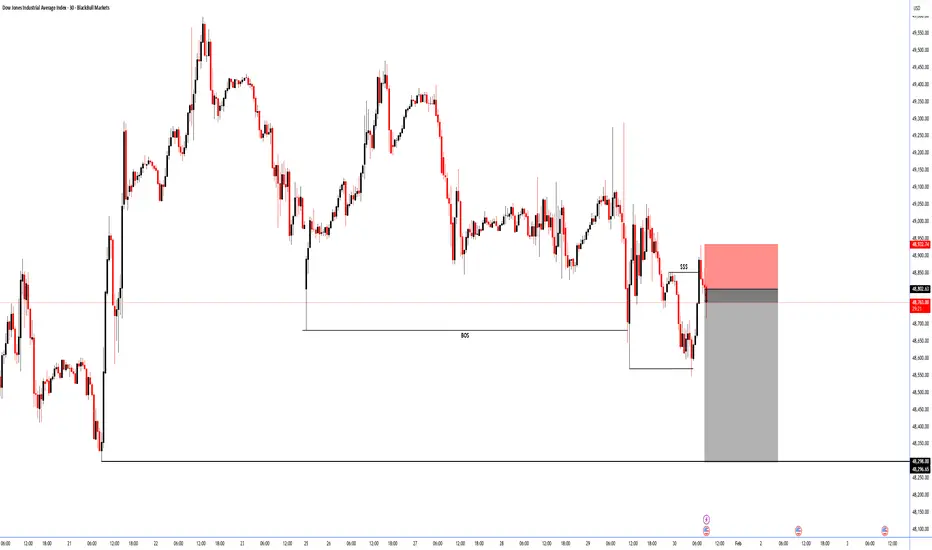
BTCUSD Demand Zone in Focus After Strong Bearish MoveBTCUSD is currently trading after a strong bearish move, where price broke below the earlier sideways structure with high selling momentum. The market clearly respected a downward trend, forming lower highs and showing consistent selling pressure. The resistance area around 89,800–90,400 worked as a strong selling zone, where price faced rejection and sellers regained control, leading to a sharp fall.
After this decline, price has now reached a major demand zone near 83,500–84,000. This area is supported by earlier buying activity and base formation, making it an important support level. The present reaction from this zone indicates that sellers are slowing down and buyers are trying to hold price. As long as BTCUSD stays above this demand, short-term stability or a corrective move can be seen.
The risk area below demand shows where downside pressure may increase if support breaks. A clear move below this zone would strengthen the bearish trend further. For now, price is consolidating near support, and volatility is expected around these levels. Overall market bias remains cautious, with bearish control still active, but short-term recovery chances remain while demand holds.
Disclaimer: This analysis is for educational purposes only. It is not financial advice. Trading involves risk and uncertainty.

GOLD MARKET VOLATILITY - REALITY CHECK Noise is high around XAUUSD with headlines like “trillions wiped out” and “gold crashing”.
Let’s keep it factual.
Gold is volatile due to profit-booking after a historic rally, geo-political uncertainty, and US policy expectations.
This is correction + consolidation, not a confirmed crash.
💡 “Trillions wiped out” = notional intraday value swings, not permanent losses.
Key Levels to Watch (XAUUSD)
Resistance: 5250 – 5300
Support: 5080 – 5000 (major demand zone)
Below 5000: Only if volatility expands with strong volume
Key Takeaway for Traders 🎯
High volatility ≠ clear direction
Avoid revenge or blind trades
Let price settle → trade with risk control
🛑 Staying out is also a strategy
📊 Focus on Forex / Crypto / Indices if Gold is unstable
Risk management > FOMO