Medplus Health Services cmp 814.85 by Weekly Chart view since liMedplus Health Services cmp 814.85 by Weekly Chart view since listed
- Support Zone 720 to 780 Price Band
- Resistance Zone 865 to 915 Price Band
- Next Resistance Zone 975 to 1045 Price Band
- Stock Price unable to Break 2nd Resistance Zone
- Support Zone well tested retested on Daily Chart view
- Volumes need improvement been below the avg traded qty
- Bullish Rounding Bottoms retraced at 2nd Resistance Zone neckline
Chartpatternanalysis

Nifty 50 spot 26042.30 by Daily Chart view - Weekly UpdateNifty 50 spot 26042.30 by Daily Chart view - Weekly Update
- Nifty has closed fairly above the Support Zone
- Support Zone steadfast at 25710 to 26010 for Nifty Index
- Resistance Zone grounded at 26200 to ATH 26325.80 for Nifty Index
- Volumes have fallen well below the average traded quantity thru the week
- Falling Resistance Trendline and the Resistance Zone rejection remain intact

Bank Nifty spot 59011.35 by Daily Chart view - Weekly UpdateBank Nifty spot 59011.35 by Daily Chart view - Weekly Update
- Bank Nifty has yet again closed within Support Zone range
- Support Zone been sustained at 58850 to 59375 for Bank Nifty
- Resistance Zone stands ground at 59825 to ATH 60114.30 for Bank Nifty
- Volumes have fallen well below the average traded quantity thru this week
- Falling Resistance Trendline still hovering on as Bank Nifty closed below trendline

Blackbuck cmp 670.70 by Daily Chart viewBlackbuck cmp 670.70 by Daily Chart view
- Support Zone 625 to 643 Price Band
- Resistance Zone 670 to 694 Price Band
- Volumes in good sync with avg traded quantity
- Falling Resistance Trendline Breakout seem attempted
- Both of the Rising Support Trendline are well respected
- Bullish Rounding Bottoms under Resistance Zone neckline

COCHINSHIP 1 Day Time Frame Current Price (approx)
• Around ₹1,640–₹1,650 on NSE/BSE.
📈 Daily Pivot / Support & Resistance Levels
(from classic pivot / daily pivot calculations)
Pivot Point (Daily)
• 1653–1654 – central pivot reference.
Resistance Levels (Daily)
• R1: ~₹1,565–1,570
• R2: ~₹1,580–1,585
• R3: ~₹1,600–1,610
Support Levels (Daily)
• S1: ~₹1,520–1,525
• S2: ~₹1,490–1,495
• S3: ~₹1,475–1,480
These pivot‑based levels are useful for short‑term intraday or next‑session trading ranges.
📊 Alternate Daily S/R (from NSE pivot style)
(from other common pivot indicators)
Immediate Support:
✔ ₹1,530–₹1,540 zone
✔ ₹1,500–₹1,510 lower cushion
Immediate Resistance:
✔ ₹1,570–₹1,580 near‑term cap
✔ ₹1,600+ stronger barrier above
📌 How to Use These for 1‑Day Trading
Bullish setups:
• Watch for break & close above ~₹1,580–1,600 for short‑term upside continuation.
Bearish setups:
• If price breaks ₹1,520 major support, next down near ₹1,490–1,475.

ASIANTILES 1 Day Time Frame 📊 Current Price Context
Asian Granito India is trading around ₹72–73 on the NSE in today’s session.
📈 1‑Day Key Levels (based on recent pivot/technical data)
🔹 Pivot Point (daily reference): ~ ₹73 (central level)
📌 Resistance Levels:
R1: ~ ₹75 – Immediate upside hurdle (recent 52‑week high area)
R2: ~ ₹77 – Secondary resistance if price breaks above R1
R3: ~ ₹79 – Extended resistance zone
📉 Support Levels:
S1: ~ ₹72 – Nearest support below the pivot
S2: ~ ₹70 – Short‑term support zone
S3: ~ ₹68 – Deeper support if market weakens
🛠️ How to Use These Levels
Bullish entry: Above the daily pivot (~₹73) with volume confirmation.
Stop loss: Below ₹70–₹68 if long.
Profit targets: ₹75 → ₹77 → ₹79 on sustained upside.

Chart Patterns CHART PATTERNS
Chart patterns represent big-picture market structures formed over dozens or hundreds of candles. They reveal accumulation, distribution, reversal, and continuation phases.
Patterns are grouped into:
A. Reversal Chart Patterns
B. Continuation Chart Patterns
C. Bilateral / Indecisive Patterns
Chart Patterns
Larger structures for strong trades
Indicate trend continuation or reversal
Higher reliability when combined with candles
Help set clear targets & stop-loss levels

NSDL cmp 1081.40 by Daily Chart viewNSDL cmp 1081.40 by Daily Chart view
- Support Zone 1040 to 1085 Price Band
- Resistance Zone 1135 to 1185 Price Band
- Bullish Triple Bottom at 1037 to 1049 Price Band
- Volumes flattish and under average traded quantity
- Price trending within Support Zone thru December 2025
- Falling Resistance Trendline Breakout seems taking process

Real Knowledge of Chart Patterns CHART PATTERNS (Market Structure Patterns)
Chart patterns are formed by price movements over a longer period and help traders understand the bigger picture. They indicate whether the trend is likely to continue, reverse, or break out after consolidation. These patterns can be grouped into three major categories:
1. Continuation Patterns
These suggest that the existing trend (uptrend or downtrend) will likely continue after a temporary pause.
2. Reversal Patterns
These indicate a possible change in trend direction.
3. Bilateral Patterns
These can break either up or down, signaling indecision.
Let’s study them in detail.

MCX 1 Day Time Frame 📌 MCX Latest Daily Price Snapshot
Approx. Last Traded Price: ~₹10,172 – ₹10,307 range (recent sessions)
Today’s Intraday Range: ~₹10,181 – ₹10,365 (approx)
52‑Week High: ~₹10,847 and 52‑Week Low ~₹4,408
📊 Daily Time‑Frame Levels (1D)
🔹 Pivot Point
Daily Pivot: ~₹10,386 – ₹10,442 zone (central reference)
🔸 Resistance Levels
R1: ~₹10,519 – ₹10,600
R2: ~₹10,596 – ₹10,650
R3: ~₹10,729 – ₹10,800
These levels act as potential upside barriers on daily closes. A sustained breakout above R1/R2 suggests strength into the next resistance zone.
🔻 Support Levels
S1: ~₹10,309 – ₹10,300
S2: ~₹10,176 – ₹10,170
S3: ~₹10,020 – ₹9,993
If price breaks below S1/S2 on daily close, deeper support may be tested near S3.
📈 Trend & Technical Tone
Technical indicators on daily charts signal a bullish bias / strong buy on daily based on moving averages and buy signals vs. sell signals.
📊 How to Use These Levels (1‑Day)
Bullish View
Long/buy setups near S1‑S2 with targets around R1‑R
A breakout above R2 could extend toward R3
Bearish/Correction View
Failure at R1/R2 with reversal momentum could target S1/S2

Godawari Power GPIL cmp 250.50 by Daily Chart viewGodawari Power GPIL cmp 250.50 by Daily Chart view
* Support Zone 224 to 236 Price Band
* Resistance Zone 249 to 263 Price Band
* Support Zone tested retested since a month
* Volumes building up for Resistance Zone Breakout

JSWENERGY 1 Day Time Frame📌 Live Price (Approx Latest)
Current price: ~ ₹478.2 – ₹478.3 per share (latest close/near real‑time) on the NSE.
Today’s range: Low ~ ₹468.3 | High ~ ₹479.9 (intraday range).
📊 Daily Key Levels (1‑Day Time Frame)
🔹 Pivot (Daily Reference)
Pivot Point: ~ ₹475.5 – central reference for daily trend.
📈 Resistance Levels
R1: ~ ₹482.7
R2: ~ ₹487.1
R3: ~ ₹494.3
(Higher resistances mark potential upside targets if the price moves up today.)
📉 Support Levels
S1: ~ ₹471.1
S2: ~ ₹463.9
S3: ~ ₹459.5
(Below these, risk of deeper pullbacks increases.)
📌 What These Levels Mean Today
✅ Bullish scenario:
A sustained trade above ₹482–₹487 could push toward ₹494+ resistance zones.
❌ Bearish scenario:
A break below ₹471 may open the path to ₹464–₹459 support.
📊 Pivot reference:
Trading above the pivot ~₹475–₹476 suggests positive short‑term bias; below it leans bearish.

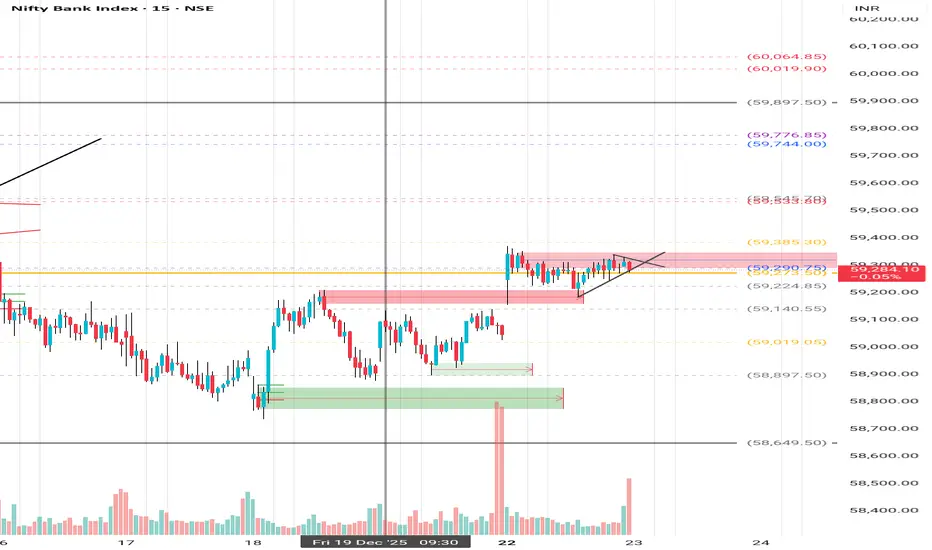
Bank Nifty - 23rd December Levels with TrendLines Bank Nifty – 23rd December Levels with Trendlines
Yesterday, only supply was created.
On Friday, that supply turned into demand.
If the market opens with a gap-up, then 23rd December supply will act as demand.
Check my Fibonacci levels – they are the most important for understanding the overall monthly direction.
CRISIL cmp 4322.10 by Weekly Chart viewCRISIL cmp 4322.10 by Weekly Chart view
- Support Zone 3960 to 4300 Price Band
- Resistance Zone 4600 to 4940 Price Band
- Support Zone tested retested for 3rd week now
- Rising Support Trendline seems to be well respected
- Volumes are keeping well above average traded quantity
- Continued Selling but Buying keeps Price above Support Band
- Price reversal from Support Zone maybe in making by Chart Status

Kirloskar Brothers cmp 1647.20 by Daily Chart viewKirloskar Brothers cmp 1647.20 by Daily Chart view
- Support Zone 1510 to 1610 Price Band
- Resistance Zone 1760 to 1860 Price Band
- Support Zone tested retested over past 2 weeks
- Support Zone sustained thou price dipped below 3 times
- Volumes synced with avg traded qty with heavy spikes too
- Rising Support Trendline since May 2024 seems well respected

Bank Nifty spot 59069.20 by the Daily Chart view - Weekly UpdateBank Nifty spot 59069.20 by the Daily Chart view - Weekly Update
- Bank Nifty has closed within the Support Zone range
- Support Zone sustained at 58850 to 59375 for Bank Nifty
- Resistance Zone stands firmly at 59825 to ATH 60114.30 for Bank Nifty
- Volumes in close sync with avg traded quantity over with intermittent spikes
- Falling Resistance Trendline weighing hard for Bank Nifty has closed below trendline

IDFC First Bank cmp 83.79 by Weekly Chart viewIDFC First Bank cmp 83.79 by Weekly Chart view
- Support Zone 66 to 75 Price Band
- Resistance Zone 84 to 93 then ATH 100.70
- Bullish Cup and Handle setup made on the chart
- Falling Resistance Trendlines Breakouts well sustained
- Volumes are in close sync with the average traded quantity

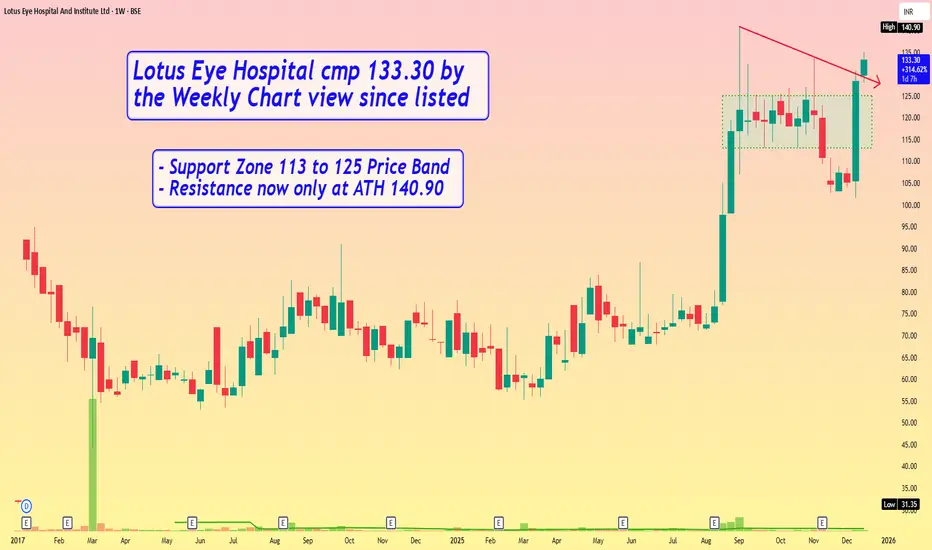
Lotus Eye Hospital cmp 133.30 by Weekly Chart view since listedLotus Eye Hospital cmp 133.30 by Weekly Chart view since listed
- Support Zone 113 to 125 Price Band
- Resistance now only at ATH 140.90
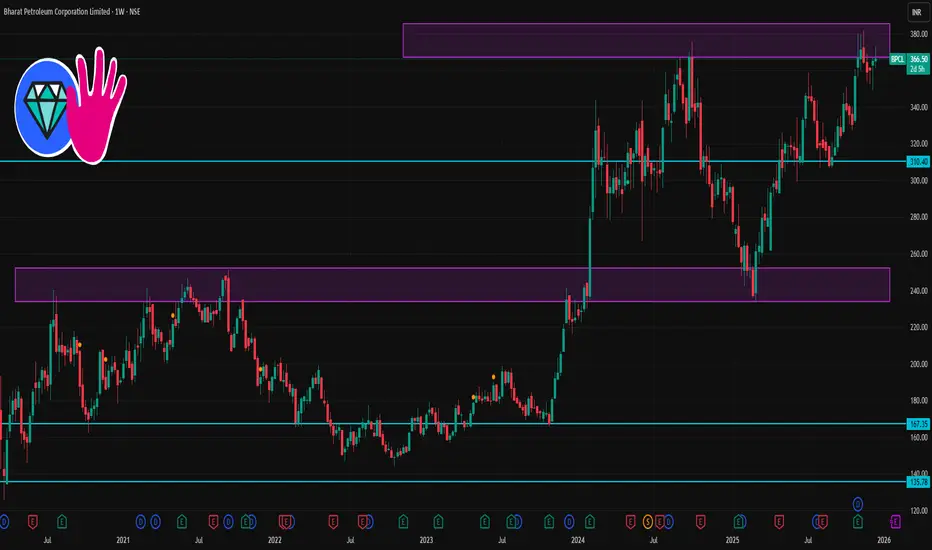
BPCL 1 Week Time Frame 📌 Current Price Context (approx):
BPCL is trading around ₹360–₹366 on NSE in recent sessions.
📈 1-Week Key Levels (Weekly Timeframe)
🔹 Resistance Levels (Upside Targets)
These are important zones where price may pause or reverse if buying pressure weakens:
~₹370–₹372 — Immediate weekly resistance zone where bulls face first hurdle.
~₹374–₹378 — Secondary resistance range on strength.
~₹380+ — Major resistance (also near recent 52-week highs).
Break above ~372–378 with volume could lead to continuation toward higher weekly targets.
🔻 Support Levels (Downside Floors)
These are key support zones where buying interest may emerge:
~₹357–₹360 — Immediate first support — closely aligned with current trading range.
~₹353–₹355 — Next support zone if price dips further.
~₹347–₹350 — Stronger weekly support — break below here could signal deeper correction.
Sustained holds above ~357–360 reinforce bullish/momentum bias on the weekly chart.
BAJFINANCE 1 Week Time Frame 📍 Current Price (Approx)
₹1,015 – ₹1,018 range on NSE as of latest close.
📊 Weekly Timeframe Levels (Support & Resistance)
🔹 Weekly Pivot‑Based Levels
(Using weekly pivot calculations — more relevant for weekly timeframe traders)
Resistance
R1: ~₹1,004 – ₹1,018
R2: ~₹1,018 – ₹1,034
R3: ~₹1,034 – ₹1,042
Pivot Zone / Mid
Weekly Pivot: ~₹988 – ₹992
Support
S1: ~₹973 – ₹986
S2: ~₹957 – ₹973
S3: ~₹943 – ₹957
📌 Key Weekly Range: approximately ₹973 – ₹1,042.

IRIS Clothing cmp 35.66 by Weekly Chart viewIRIS Clothing cmp 35.66 by Weekly Chart view
- Support Zone 28 to 31 Price Band
- Resistance Zone 36.50 to ATH 40.71 Price Band
- Volumes above average traded quantity over past 2 weeks
- Darvas Box - Price trending between 30 to 35.50 since June 2025
- Long Bullish Rounding Bottom followed by small one's made within Darvas Box

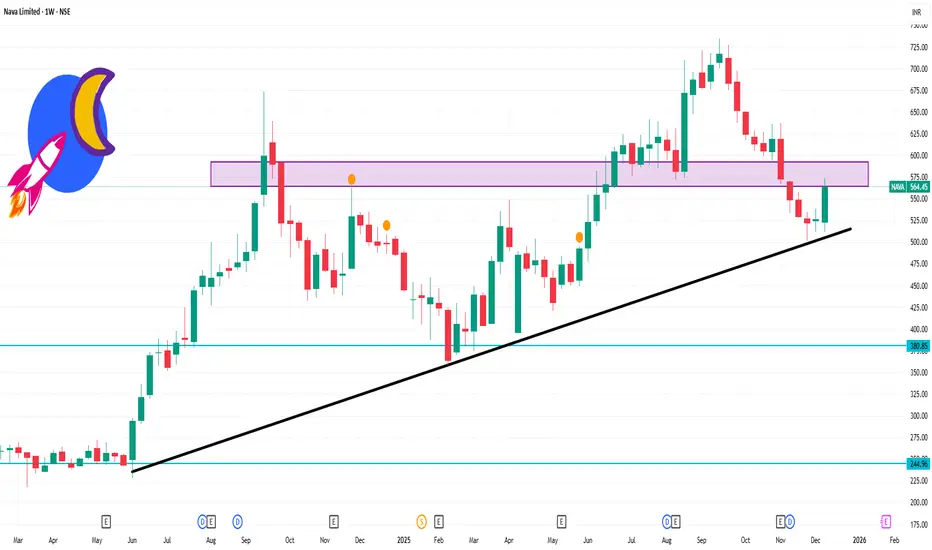
NAVA 1 Week Time Frame 📌 Current Price Snapshot
Last traded / recent price: ~₹560–₹567 on NSE/BSE (varies by source; live changes intraday)
52‑week range: ₹356 (low) to ₹735 (high)
📊 Weekly Timeframe Levels (Support & Resistance)
For a 1‑week (weekly candle) view you want levels that matter over the entire trading week — not just intraday:
🔹 Weekly Pivot & Key Levels (from pivot and technical sources)
Immediate Pivot (weekly): ~₹552–₹563
Weekly Resistance Zones:
R1: ~₹566–₹570 (near recent swing highs)
R2: ~₹587–₹590 zone
R3: ~₹600+ if momentum persists
Weekly Support Zones:
S1: ~₹531–₹535 (first strong support)
S2: ~₹517–₹520 (secondary weekly support)
S3: ~₹496–₹500 (deeper support if selling extends)
Summary of weekly levels:
📈 Bullish break‑above: ₹570–₹590
🧊 Neutral pivot zone: ₹552–₹565
🛑 Bearish below: ₹531 → ₹500
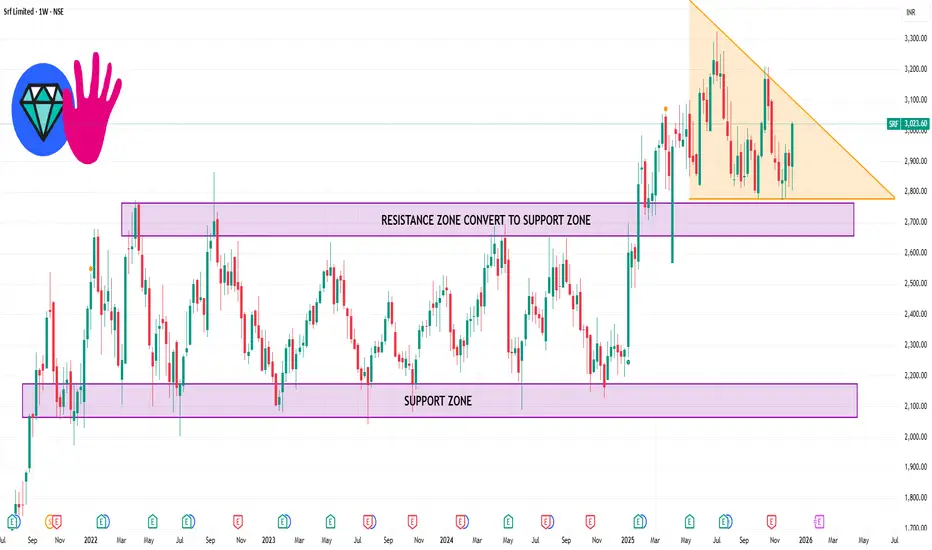
SRF 1 Week Timw Frame 📌 Current Price Context (as of latest close):
• SRF was trading around ₹3,023–₹3,024 recently.
📊 Weekly / Short-Term Key Levels
📈 Resistance Levels
These are possible upside targets where price may face supply pressure:
R1 (Immediate resistance): ~₹2,971–₹2,990 — key level to break for near-term upside.
R2: ~₹3,007–₹3,031 — next hurdle after R1.
R3 / Higher Resistances: ~₹3,060–₹3,100+ zones if momentum continues.
A close above ₹3,000–₹3,030 on the weekly chart often signals stronger short-term bullish bias.
📉 Support Levels
These are downside floors that may act as buyers’ interest zones:
S1 (Immediate support): ~₹2,873–₹2,900 — first key support area.
S2: ~₹2,811 — deeper support if the first level breaks.
S3: ~₹2,775 or lower — if broader weakness materialises.
📌 Weekly Pivot Level
• Pivot zone around ₹2,950–₹2,990 can act as a gauge of short-term trend direction. Above it = bullish bias; below it = bearish bias.