MAS Financial cmp 313 by Daily Chart viewMAS Financial cmp 313 by Daily Chart view
- Support Zone 275 - 295 Price Band
- Resistance Zone 325 to 345 Price Band
- Falling Resistance Trendline Breakout seems been sustained
- Repeat Bullish Rounding Bottoms done with last in making process
- Volumes are seen to be in decent sync with the average traded quantity
- Good accumulation since August 2025 within Support and Resistance Zone
Chartpatternanalysis

ZYDUSWELL 1 Day Time Frame 🔎 Current snapshot
Recent quoted share‑price: ~ ₹419.7 as on close of market.
52‑week high / low ~ ₹530.9 / ₹298.6.
✅ What this implies (for today / next trading session)
If price moves upward and clears ₹456–₹463, next target zone could be ₹470–₹475 — and if momentum persists, maybe up to ₹485–₹487.
If price falls, keep an eye on ₹441–₹453 as first support; a break below ₹420–₹422 could open risk of deeper slide.
Given current price (~₹420), the stock is nearer to support side — so a modest bounce is possible if broader market or sector sentiment improves.
⚠️ What to watch out for
Daily technicals work best with volume confirmation — weak volume may render levels less reliable.
Mid‑term factors (earnings, fundamentals, market news) can overrule technical‑only moves.
Given the stock’s 52‑week high/low spread, volatility remains significant — so manage risk (stop‑loss, position sizing) carefully.

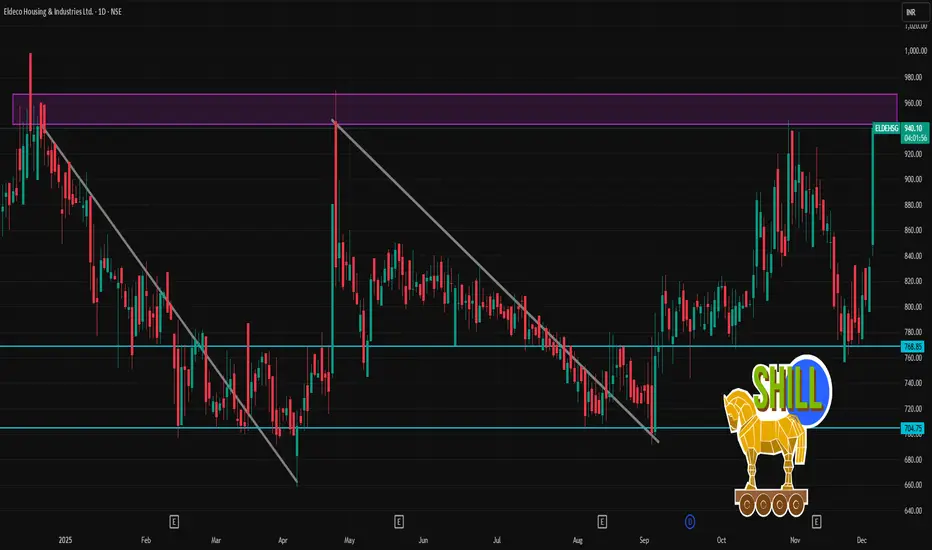
ELDEHSG 1 Day Time Frame 📈 Key Recent Price & Stats
According to a recent quote, ELDEHSG traded around ₹ 940.00 during a session where it jumped ~13% on the day.
52‑week range: ₹ 658.10 (low) — ₹ 998.90 (high).
VWAP for the day (on one snapshot) was ~₹ 924.48.
⚠️ What to Watch Out For / Consider
The stock appears volatile: large swings (e.g. from ~₹ 800s to ~₹ 940 in a day) — intraday volumes and momentum matter.
The valuation is relatively high (P/E ratio is elevated; book value vs price indicates premium).
Given volatility and wide 52‑week range, risk of sharp retracement — if market sentiment or sectoral/regulatory triggers change — remains.
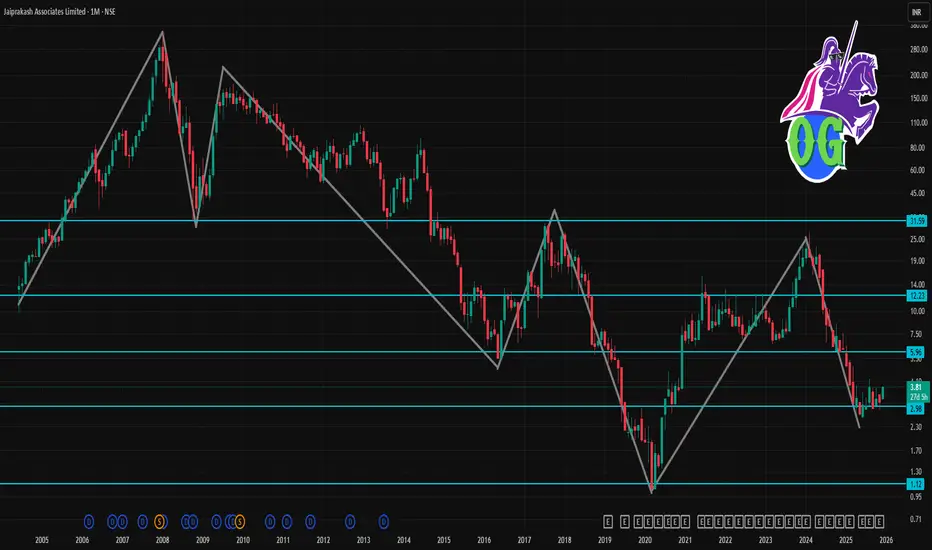
JPASSOCIAT 1 Month Time Frame 🔎 Current snapshot
Recent price (early Dec 2025): ~ ₹ 3.60–₹ 3.81.
52-week high / low: ~ ₹ 7.57 / ₹ 2.56.
Company remains under resolution/insolvency proceedings. Its balance sheet, according to data, shows negative book value and poor earnings metrics over recent years.
Because of this, the stock is highly volatile and speculative. Analysts have repeatedly flagged that such small-cap, distressed companies are “easy to enter but difficult to exit.”
🎯 My view (1-month horizon)
Given high uncertainty, best to treat this as a speculative trade rather than a “safe bet.”
Short-term upside is possible if there is news on resolution/acquisition or better-than-expected restructuring.
But downside risk remains high — if negative developments emerge, the stock may slip back.
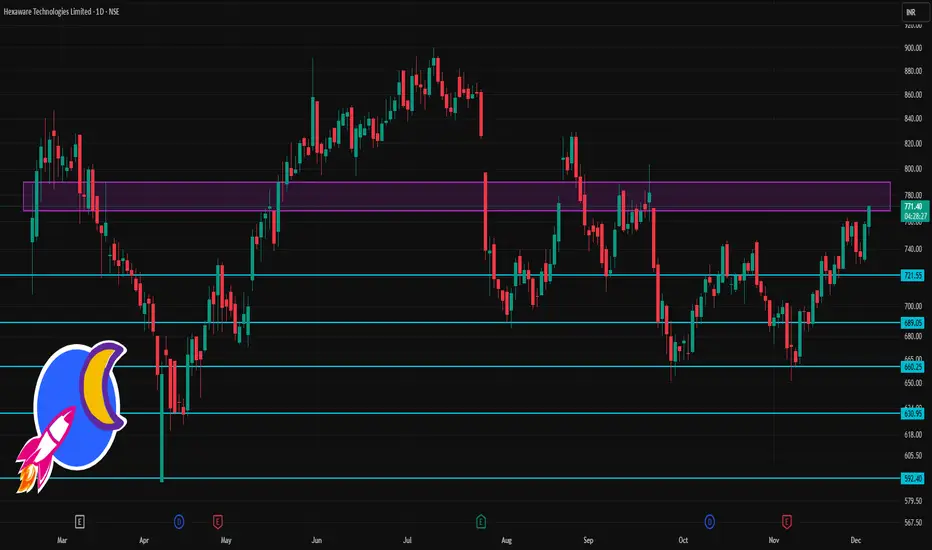
HEXT 1 Day Time Frame 🔎 Current Context & Price
Latest price: ~ ₹770–771.
Day’s trading range seen: roughly ₹750–772.
52-week range: ₹590.30 (low) – ₹900 (high).
⚠️ What to Watch / Risk Zones
If price falls below ~₹745–750 (support zone), risk of more significant slip toward ₹738–740.
Resistance around ₹775–785 could trigger profit-taking or consolidation — strength of buying volume matters.
As with all mid-cap IT stocks, macro factors (global demand, forex, sector sentiment) may override technicals.
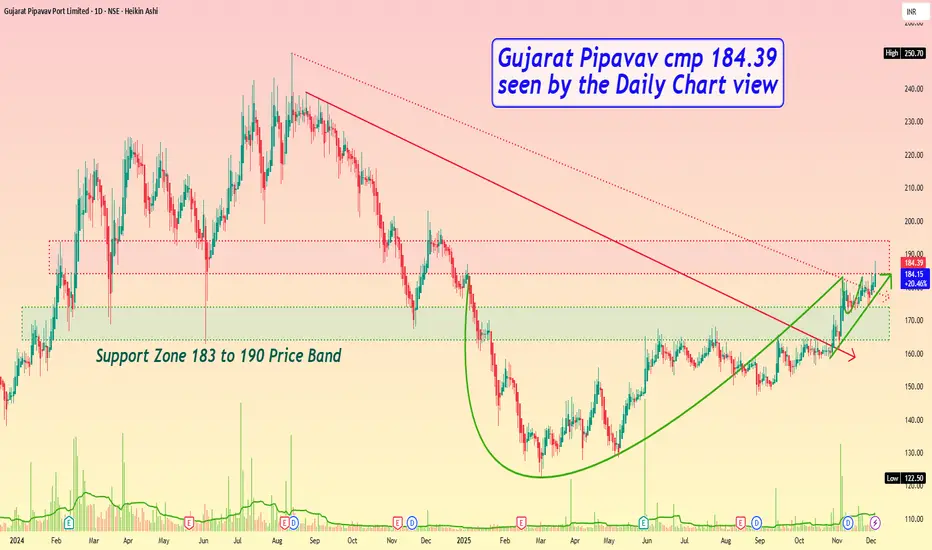
Gujarat Pipavav cmp 184.39 by Daily Chart viewGujarat Pipavav cmp 184.39 by Daily Chart view
- Support Zone 164 to 174 Price Band
- Resistance Zone 184 to 194 Price Band
- Bullish Cup & Handle formed by Resistance Zone neckline
- Breakout from both Falling Resistance Trendline well sustained
- Volumes spiking heavily to well above and in sync with avg traded qty
- Positively trending Technical Indicators BB, EMA, MACD, RSI, SAR, SuperTrend
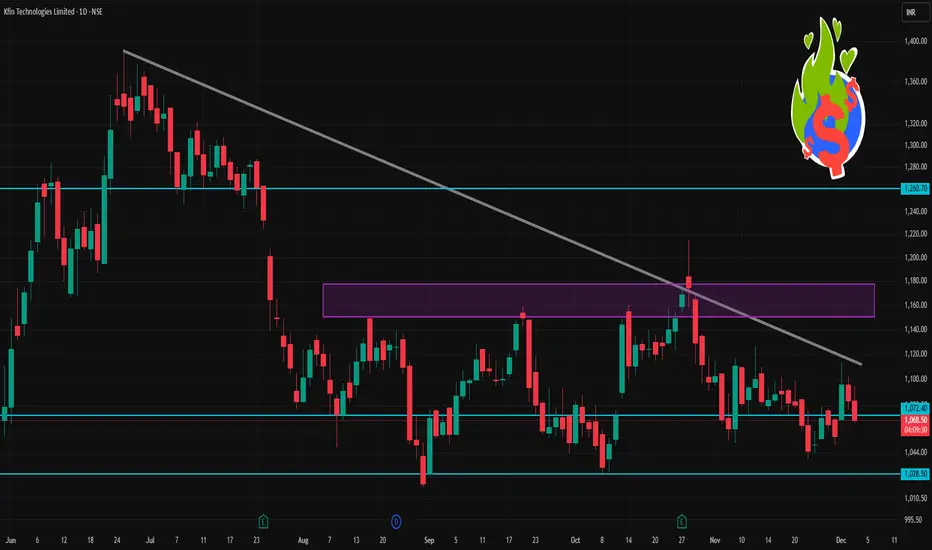
KFINTECH 1 Day Time Frame 📊 Current Snapshot (as of right now)
Reported day’s trading‑range so far: ~ ₹ 1,066.70 (low) to ~ ₹ 1,095.00 (high)
Opening price: ~ ₹ 1,083.80
Previous close: ~ ₹ 1,083.40
Market‑wide context: 52‑week high ~ ₹ 1,641.35, 52‑week low ~ ₹ 784.15
📌 Key Intraday / Short‑Term Levels (Classic Pivot‑Style)
Using the standard pivot‑point formula (Pivot = (High + Low + Close)/3) plus support/resistance calculations.
Here’s what that yields roughly for today — with High = 1,095.00, Low = 1,066.70, Close (yesterday) ≈ 1,083.40:
Level Approximate Price (₹)
Pivot (PP) ~ 1,081.70
Support 1 (S1) ~ 1,068.40
Support 2 (S2) ~ 1,050.40
Resistance 1 (R1) ~ 1,108.90
Resistance 2 (R2) ~ 1,131.00
Interpretation:
If the price stays above PP (~1,082) — bullish bias; otherwise, cautious/bearish.
S1 (~1,068) may act as “first floor”: if price drops near there and holds, watch for bounce.
A break below S2 (~1,050) might lead to deeper correction or volatility.
On upside, a strong move above R1 (~1,109) could challenge R2 (~1,131).
HEROMOTOCO 1 Day View📈 Current Technical Snapshot
As of the most recent close, Hero MotoCorp is trading around ₹ 6,174–₹ 6,175.
Medium‑ to long‑term moving averages (20‑day, 50‑day, 100‑day, 200‑day) are all below current price — indicating a bullish trend on daily timeframe.
Momentum indicators (e.g. MACD, RSI, CCI) remain positive in recent technical overlays — reflecting continued bullish bias.
🧭 What this means (short‑term bias)
As long as the stock remains above ~ ₹ 6,098–6,100, positive bias likely remains intact — supports may hold if there’s a pullback.
A break above ₹ 6,200–6,205 could open near‑term upside toward ₹ 6,250–6,300+ (near recent highs / psychological resistance).
On downside — if price breaks convincingly below ~ ₹ 6,000, next real support comes only near ₹ 5,995–6,000.
⚠️ What to Watch / Limitations
Technical levels are zones, not precise lines — price may overshoot briefly before reaction.
Market‑wide factors or news (macroeconomic, demand for two‑wheelers, policy, daily volume) can override technicals.
These levels are short‑term / 1‑day to few‑day oriented. For swing or long‑term holdings, combine with weekly / monthly chart analysis.

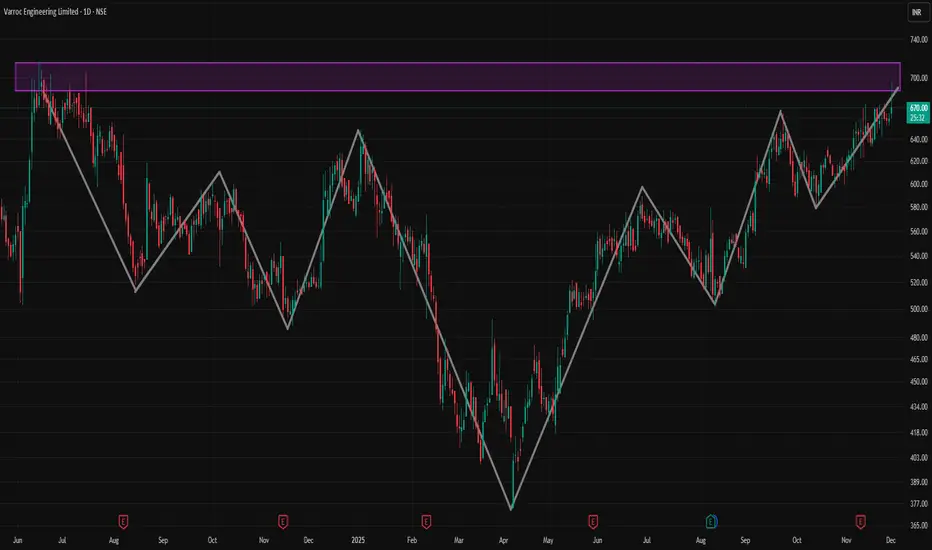
VARROC 1 Day Time Frame 📈 Where VARROC stands now
Recent quotes put VARROC around ₹ 659 – ₹ 692 per share.
On a 1‑day / very short‑term basis, the stock recently showed a jump of ~4‑5%.
The 52‑week range for the stock has been roughly ₹ 374 – ₹ 674–689 — so current levels are near the upper end of that band.
⚠️ What to keep in mind / Risks in 1‑day frame
The stock remains relatively volatile — intraday swings (highs/lows) have been wide in recent sessions.
Short‑term moves may be driven more by news/event‑driven sentiment (like EV contract wins) than by underlying long‑term fundamentals; such moves can reverse quickly if news is not sustained.
✅ My take (for a 1‑day horizon)
If you are looking at a 1‑day trade: VARROC could still have some upside — especially if momentum continues, given recent positive news + technical breakout. But treat it as a high‑risk, high‑reward speculative trade.
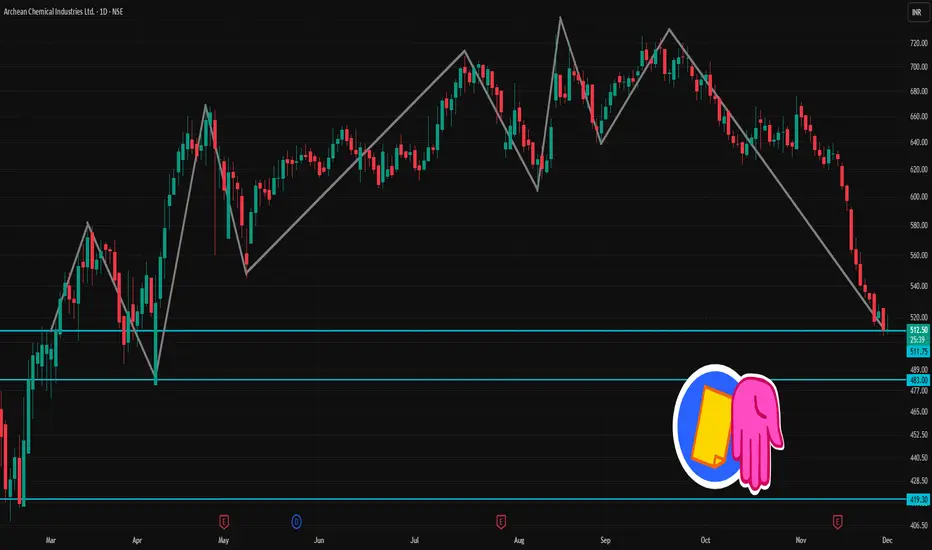
ACI 1 Day Time Frame 📊 Latest snapshot
Recent price ~ ₹ 512 – ₹ 513
52-week range: ~ ₹ 408 (low) to ~ ₹ 730 (high)
Recent technical-analysis summary: Mixed/Neutral to bearish — some moving averages give bullish bias but oscillators appear weak.
⚠️ Technical Signals (Short-Term)
According to one technical summary, short-term trend is marked as “sell”.
Oscillators (e.g. RSI/Stochastic) recently suggest weak or bearish momentum.
✅ What to Watch / Trading Cautions
Momentum is weak; oscillators don’t suggest a strong bullish bounce yet.
If price drops below support (~₹ 508), downside risk increases; need close stop-loss discipline.
Volume & broader market/sector conditions could swing price sharply — stay alert for volatility.
On a bounce, watch if resistance zones get challenged — a breakout may change short-term trend.
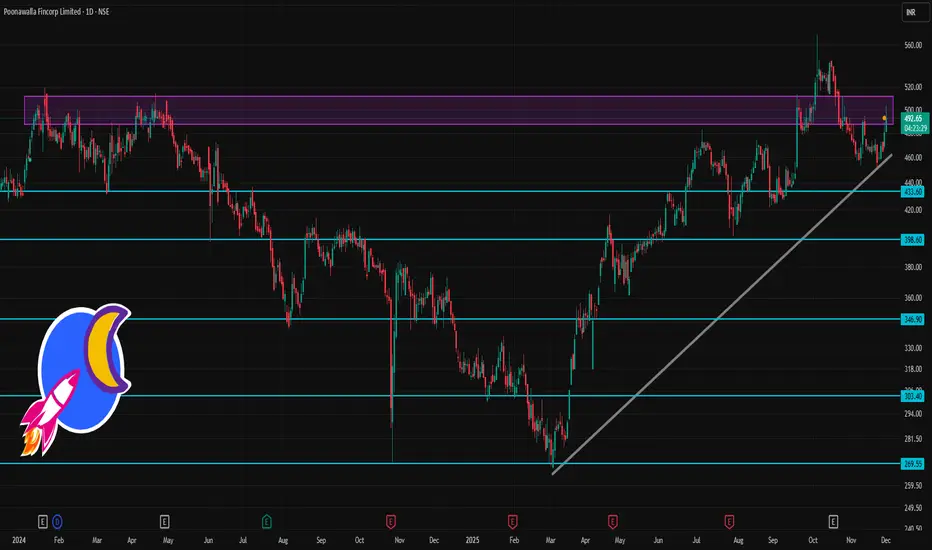
POONAWALLA 1 Day Time Frame 📌 Latest price & context
On one of the latest snapshots, the share price was ~ ₹ 492.65 (as per a public chart)
The stock remains among relatively volatile mid-cap / NBFC counters, with a fairly high beta (i.e. sensitivity to market swings).
✅ Technical Momentum & Risk Profile
Technical sources currently signal a “bullish / buy-leaning” bias based on moving averages (from short-term to long-term) for Poonawalla.
But high volatility & elevated beta mean risk — sharp swings are possible in either direction depending on market sentiment, NBFC-sector news, and macro cues.
⚠️ What to watch out for
The pivot-based levels assume relatively normal volatility — big sector-wide moves, news, or NBFC-specific developments can render them less reliable.
As an NBFC / mid-cap, the stock remains sensitive to interest-rate outlook, credit-sector sentiment, and macroeconomic conditions — not just its own chart.
The “buy bias” from moving averages doesn’t guarantee a smooth upward path — you should watch volume, daily chart pattern, and broader market context.
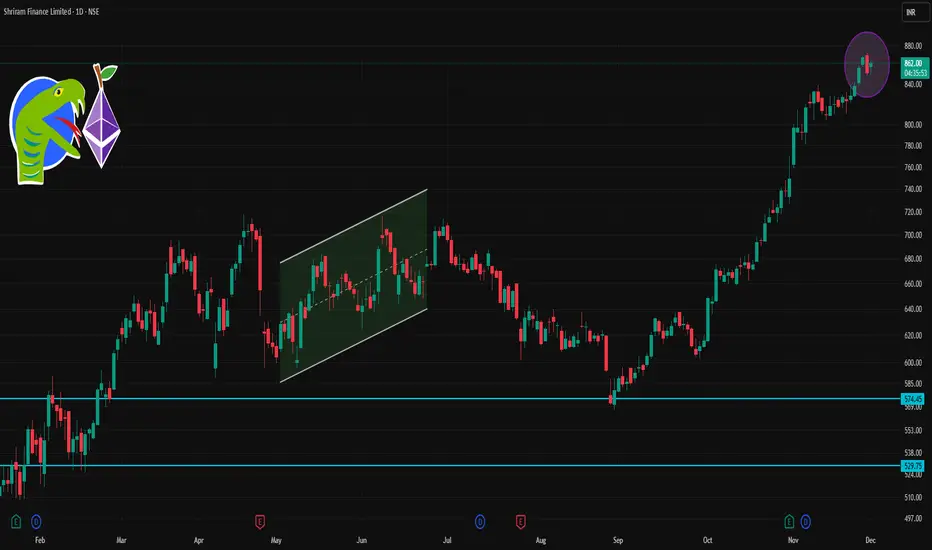
SHRIRAMFIN 1 Day Time Frame 📊 Current Snapshot
Latest live price: ~ ₹852–857 (depending on trade moment).
Today’s high / low range: ~ ₹861.95 high / ~ ₹850.40 low.
52-week range: ₹493.35 (low) ↔ ₹872.00 (high).
✅ What This Means for Intraday / Next Sessions
If price stays above ~₹857–858 (pivot) — bias remains bullish → could target ₹866 → ₹880–881.
If price dips but finds support near ₹842–843, watch for bounce (possible buying opportunity).
A break below ₹834 → ₹820 downward zone might signal risk of further downside — monitor overall market and sector trend.
Use stop-loss (if trading) near support zones to manage risk, given volatility and sensitivity to overall market moves.
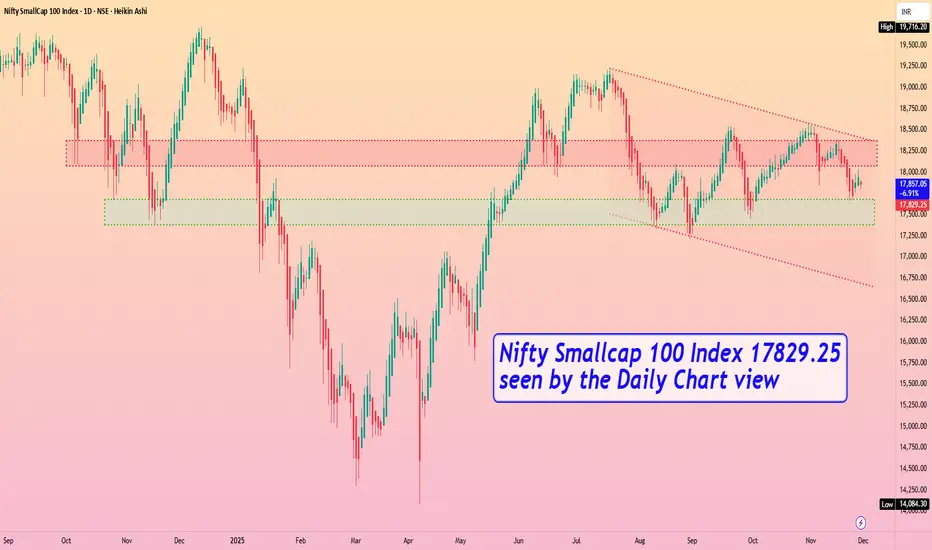
Nifty Smallcap 100 Index 17829.25 by Daily Chart viewNifty Smallcap 100 Index 17829.25 by Daily Chart view
- Support Zone 17375 to 17675 Index Band
- Resistance Zone to 18075 to 18375 Index Band
- Index formed Lower High Lower Lows since mid of July 2025
- Current status indicating Support Zone shoulder for probable upside
- Let us all hope for the best to happen and keep our fingers crossed 🤞🏽🤞🏽🤞🏽🤞🏽🤞🏽
- IF ..... next full week we see closure above Support Zone with breach into Resistance Zone then fresh upside breakout may be anticipated.
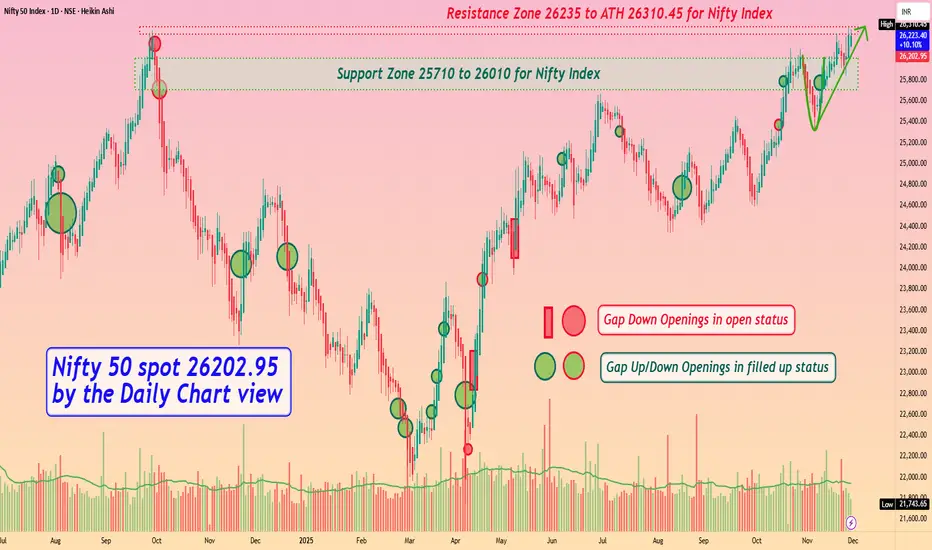
Nifty 50 spot 26202.95 by Daily Chart view - Weekly updateNifty 50 spot 26202.95 by Daily Chart view - Weekly update
- Support Zone 25710 to 26010 for Nifty Index
- Resistance Zone 26235 to ATH 26310.45 for Nifty Index
- Finally after 14 months Nifty 50 hit New Lifetime High Milestone 26310.45
- Hope to see Bullish momentum continue for Nifty 50 with positive expectation
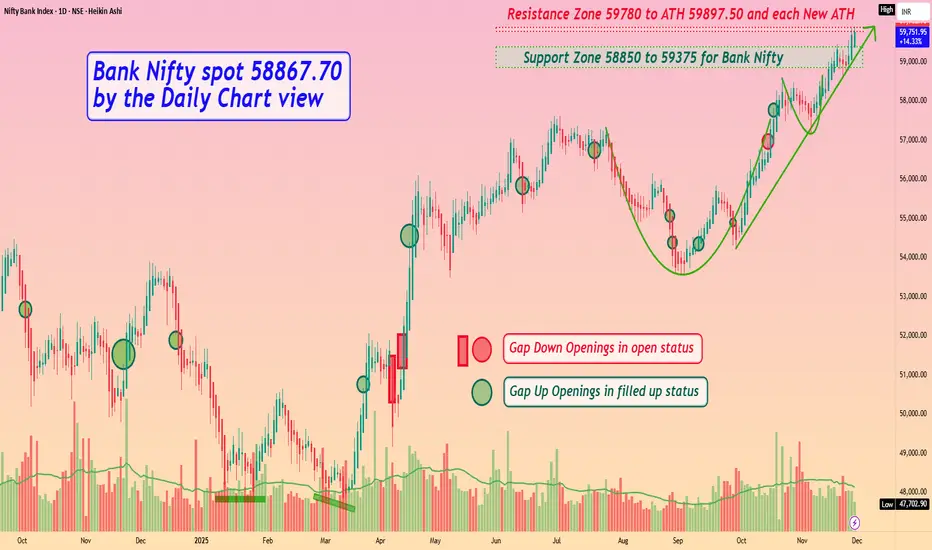
Bank Nifty spot 58867.70 by Daily Chart view - Weekly updateBank Nifty spot 58867.70 by Daily Chart view - Weekly update
- Support Zone 58850 to 59375 for Bank Nifty
- Resistance Zone 59780 to ATH 59897.50 and each New ATH
- Bank Nifty seems gotten in a habit to create ATH every other day
- Bullish momentum well trending on Bank Nifty and expect more to come
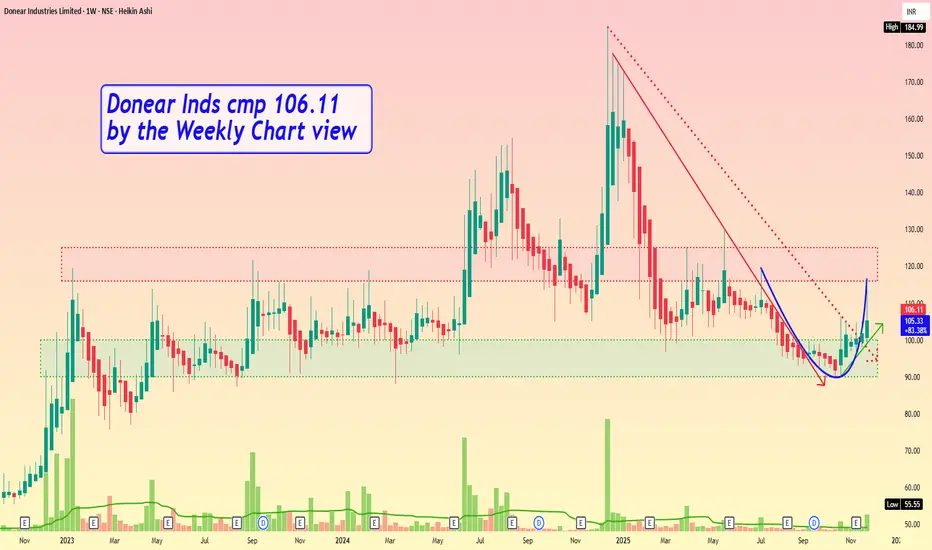
Donear Inds cmp 106.11 by the Weekly Chart viewDonear Inds cmp 106.11 by the Weekly Chart view
- Support Zone 90 to 100 Price Band
- Resistance Zone 116 to 125 Price Band
- Price shouldering along the Rising Support Trendline
- Breakout from Falling Resistance Trendline well sustained
- Bullish Rounding Bottom done by Resistance Zone neckline
- Support Zone tested retested prior to price moved to upscale
- Volumes are intermittently spiking heavily over past few weeks
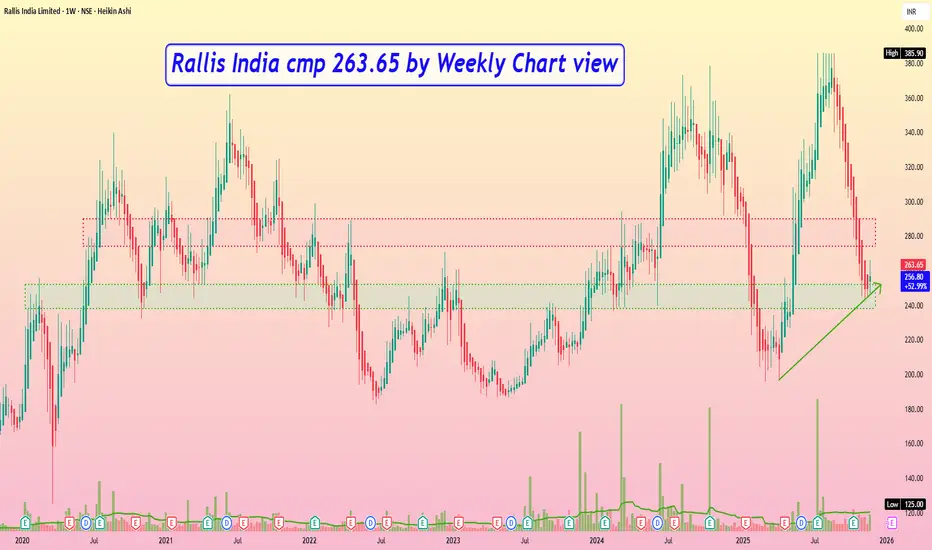
Rallis India cmp 263.65 by Weekly Chart viewRallis India cmp 263.65 by Weekly Chart view
- Support Zone 238 to 252 price Band
- Resistance Zone 274 to 290 price Band
- Stock fell from ATH 385.90 by Bearish Top formation
- Support Zone (since Sept 2014) tested retested for fresh up move
- Volumes below avg traded qty need to increase for upward price movement
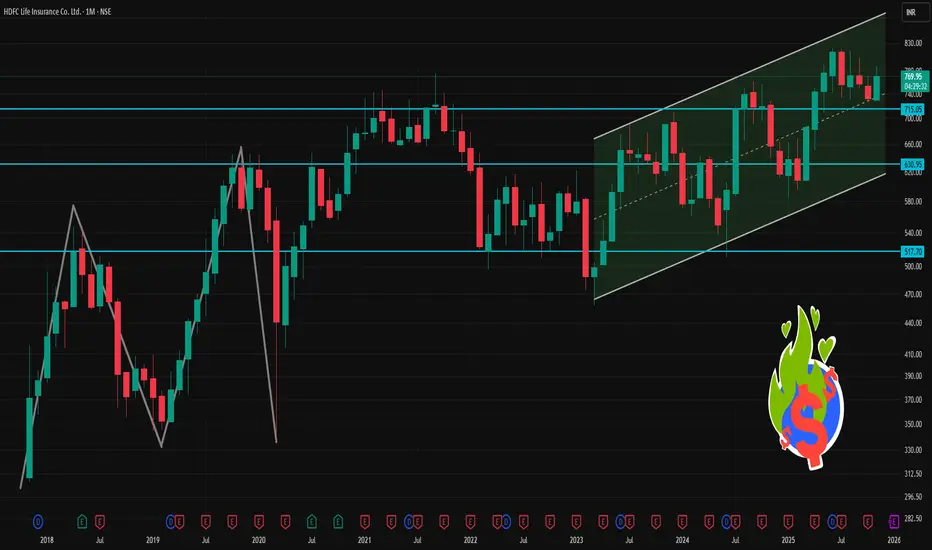
HDFCLIFE 1 Month Time Frame 📊 Current price & recent moves (1‑month)
As of 26 Nov 2025, the stock was trading at around ₹787.55.
As per another source on 28 Nov 2025, the price is ~ ₹772.40.
The 52‑week trading range is roughly ₹584.30 (low) to ₹820.75 (high).
Technical data suggests the share price is above its 50‑day and 200‑day simple moving averages — a sign of medium‑term strength.
🧮 What this “level view” indicates
The stock is currently closer to its 52‑week high than to its recent lows — indicating investor confidence or positive sentiment.
The 1‑month return is decent (6‑8%), attractive for short‑term holders/traders.
Support levels (around ₹730‑₹750) seem to be respected, which gives a cushion against sharp downside (unless broader markets disrupt).
The fact that price is above both 50-day and 200-day SMAs suggests the medium‑term trend remains bullish or at least stable.
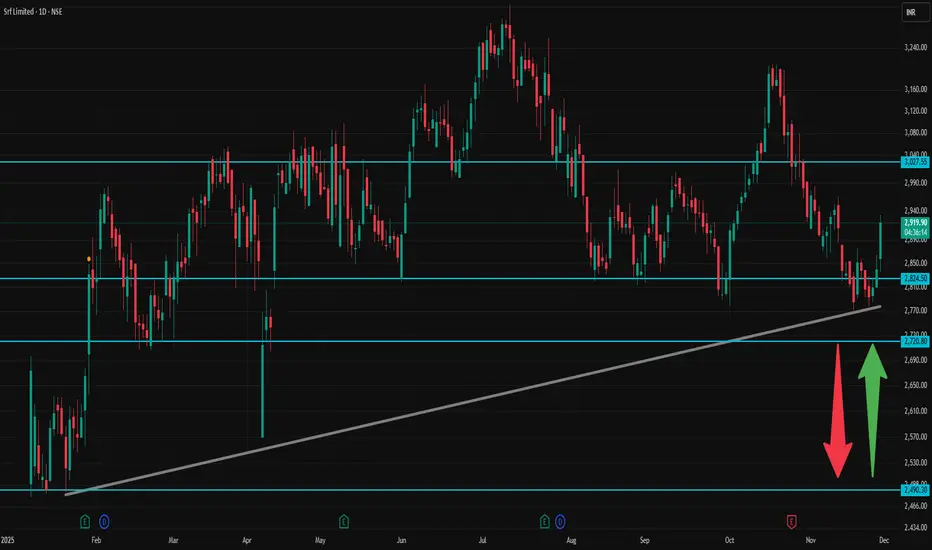
SRF 1 Day Time Frame ✅ Current context
According to public price data, SRF’s recent high for the day is ~ ₹ 2,933, low ~ ₹ 2,836.80.
As per a technical‑analysis summary: moving averages (short-to-medium term) and oscillators on daily timeframe show a bullish bias (Strong Buy on many signals).
🎯 How to interpret / trade with these levels
As long as price stays above Pivot (~₹ 2,866), bias remains mildly bullish — look for R1 → R2 → R3 as possible targets.
If momentum is strong (volume + positive broader market), a break above R2 (~₹ 2,920) could push toward R3 (~₹ 2,933–2,937+).
On downside, supports at ₹ 2,811.93 → ₹ 2,783.87 → ₹ 2,757.73 are key — loss of S1 may open S2/S3.
For conservative traders: good entry or add-on zones could be near S1 or pivot, with stop‑loss a little below S2/S3 depending on risk tolerance.
⚠️ Important caveats
These are static pivot-based levels, and real market moves may overshoot or not respect them depending on news, volume, macro‑market sentiment.
Given volatility (as seen in day’s high-low range), levels above R2 or below S2 can get tested — intraday discipline (stop-loss, position sizing) is crucial.
Always watch volume, overall index trend (Nifty/Sensex), sector news — technical levels work better when confirmed by context.
Inventurus Knowledge cmp 1696 by Daily Chart view since listedInventurus Knowledge cmp 1696 by Daily Chart view since listed
- Support Zone 1475 to 1575 Price Band
- Resistance Zone 1755 to 1855 Price Band
- Falling Price Channel Breakout well sustained
- Resistance Zone Breakout maybe decently expected
- Rising Price Channel Uptrend momentum going firmly
- Volumes are in close sync with average traded quantity
- Bullish Rounding Bottoms or considerate Cup and Handle don

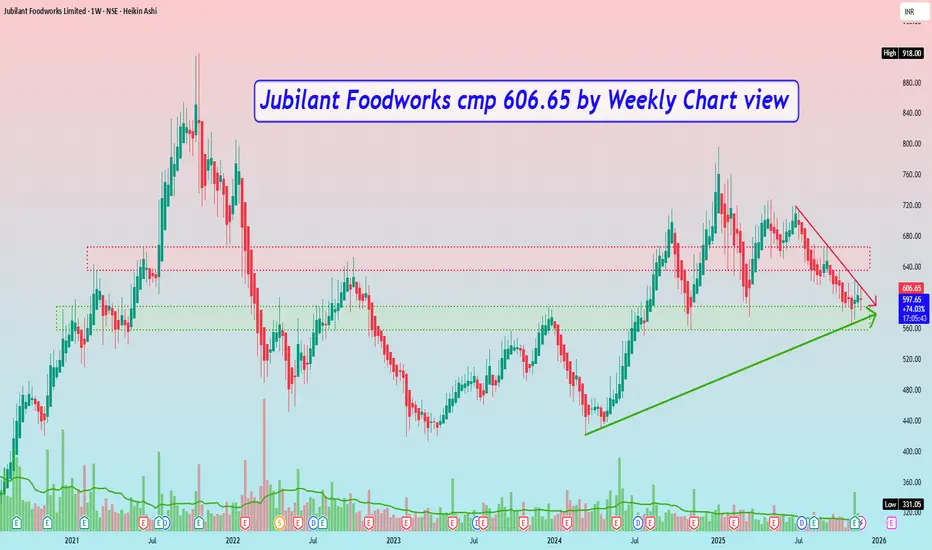
Jubilant Foodworks cmp 606.65 by Weekly Chart viewJubilant Foodworks cmp 606.65 by Weekly Chart view
- Weekly Support Zone 558 to 588 Price Band
- Weekly Resistance Zone 635 to 665 Price Band
- Volumes in close sync with average traded quantity
- Support Zone been tested retested over past few days
- Rising Support Trendline shouldering up-trending price move
- Falling Resistance Trendline tested retested by Breakout attempts
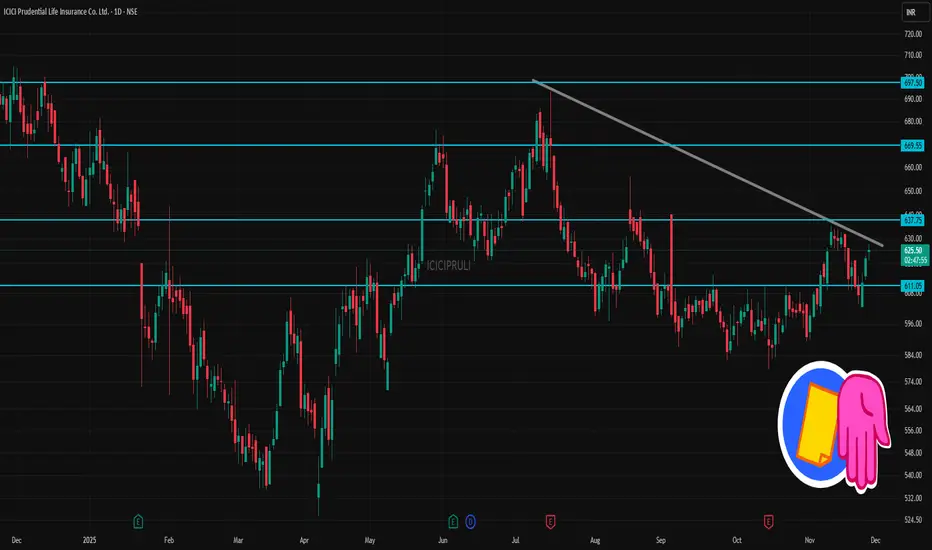
ICICIPRULI 1 Day Time Frame 📌 Latest Price & Context
Recent traded price: ~ ₹ 625–626.
52‑week range: Low ~ ₹525.80 — High ~ ₹704.70.
📈 What It Suggests (For 1‑Day / Short‑Term View)
As long as price remains above ~₹ 623–625, there is a short‑term bullish bias — next target could be ~₹ 630–635.
Dip toward ~₹ 615–620 could offer a buy‑on‑dip type entry (for traders), if volume and overall market sentiment stay supportive.
If price breaks below ~₹ 605–600, it may head toward the lower support zone — then caution/adapt strategy.
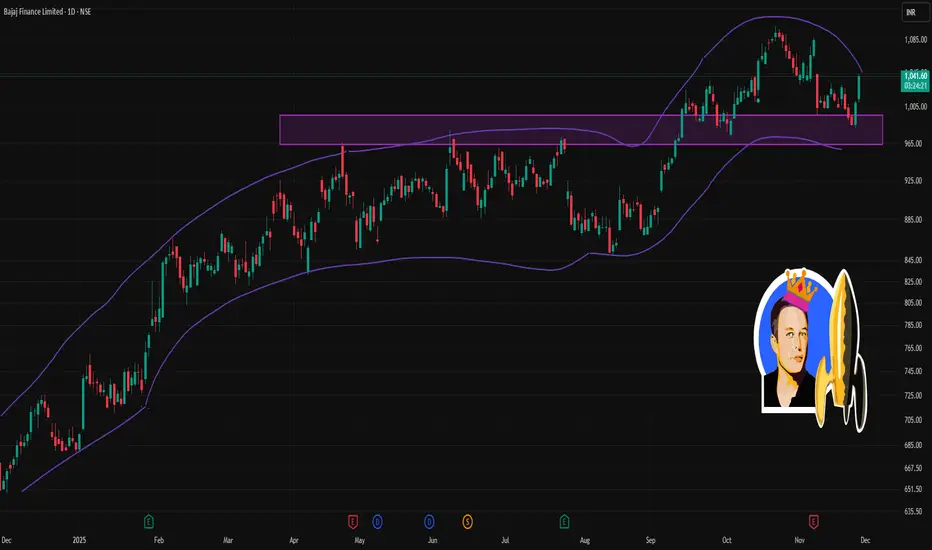
BAJFINANCE 1 Day Time Frame ✅ What we know now (as of latest available data)
1. The latest publicly quoted price for Bajaj Finance is ~ ₹1,042 – ₹1,044.
2. According to a recent report, the stock touched an intraday high of ₹1,042.20.
3. The stock is above its short‑ and long‑term moving averages, which suggests current bullish momentum.
⚠️ Important Notes / Context
These are technical levels derived using standard pivot‑point / support‑resistance calculation methods. They are not guaranteed — markets may overshoot or violently gap.
Always consider fundamentals (company news, sector, broader market sentiment) along with technicals before acting.
Use stop‑loss / risk management because intraday volatility can cause swings beyond these levels.