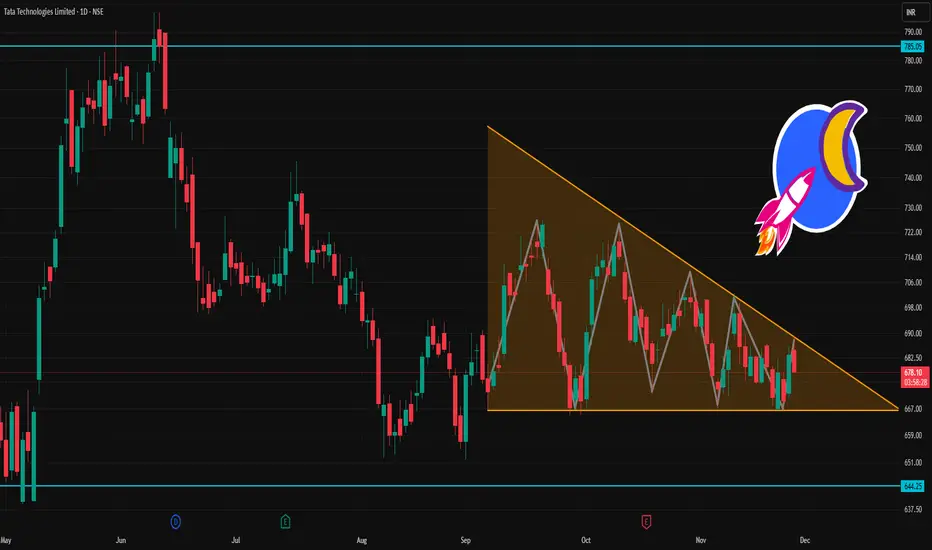
TATATECH 1 Day Time Frame 📌 Key recent data (approx as of last close):
Last traded price: ~ ₹676.75.
Day high / low: ~ ₹679 / ₹670.25.
52‑week high: ~ ₹973.85; 52‑week low: ~ ₹597.
🧮 What this suggests for today (intraday / short‑term only):
If Tata Tech trades above ₹672.7, it could aim for ₹677–684 as short‑term resistance.
A fall below ₹672.7 might push price toward ₹665–661 as support.
₹684–696 could act as a more extended intraday upside zone, if there’s bullish momentum.
🔎 Context & What to Watch Out For
The 52‑week high is still much higher — so in a broader sense, the stock remains far off prior highs.
On short‑term charts, some indicators (e.g. moving‑average crossovers / candle‑pattern heuristics) recently gave bearish / neutral signals.
Volatility and broader market sentiment (especially in the auto / engineering‑services / global tech outsourcing space) can swing prices significantly — so these levels are very approximate.
Chartpatternanalysis
RR Kabel cmp 1420 by Weekly Chart view since listedRR Kabel cmp 1420 by Weekly Chart view since listed
- Support Zone 1285 to 1350 Price Band
- Resistance Zone 1525 to 1600 Price Band
- Resistance Zone Breakout in the making process

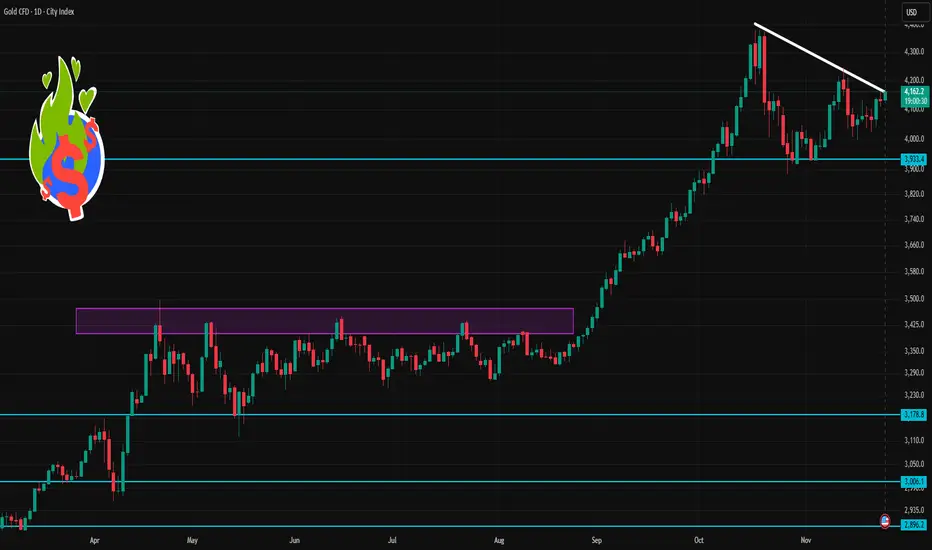
Gold 1 Day Time Frame 🔎 Current Context
1. Gold currently trades around US $4,160–4,165/oz.
2. Many technical-analysis services show daily momentum as bullish: moving averages, RSI/MACD and other indicators point toward a positive bias.
3. But macro factors (strong USD, Fed policy, global risk sentiment) remain important and may cause sharp swings.
⚠️ What to Watch Out For
Volatility: Gold remains sensitive to macro events — USD strength, rate expectations, major economic data — so price can easily break support/resistance zones.
False Breakouts: Even if price crosses a level, it may revert quickly. Combine with other indicators (volume, price action, confirmations) before acting.
Trend Shifts: A major change in global risk sentiment or central-bank moves can rapidly change trend direction, invalidating technical levels.
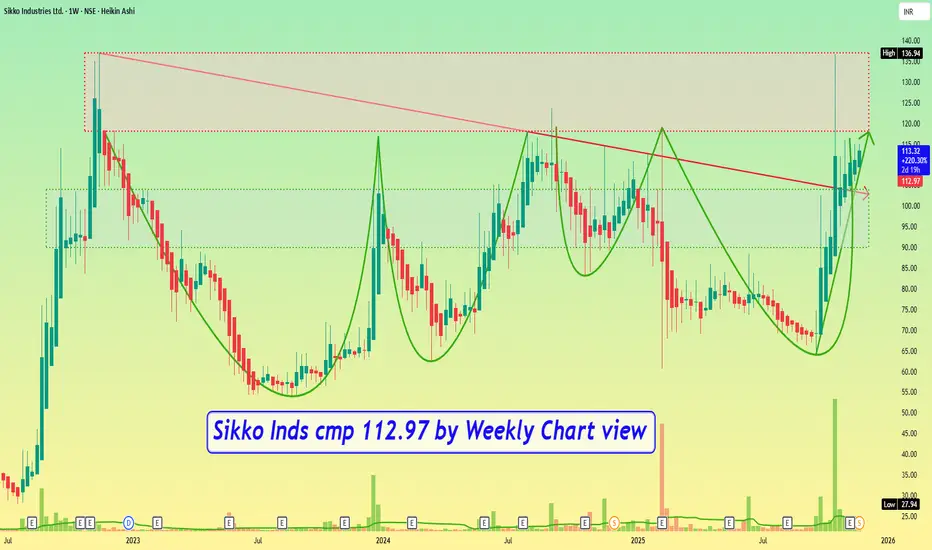
Sikko Inds cmp 112.97 by Weekly Chart viewSikko Inds cmp 112.97 by Weekly Chart view
- Support Zone 90 to 104 Price Band
- Resistance Zone 118 to ATH 136.94 Price Band
- Volumes in good sync with average traded quantity
- Bullish Rounding Bottoms by Resistance Zone neckline
- Resistance Zone holding strongly at each breakout attempts
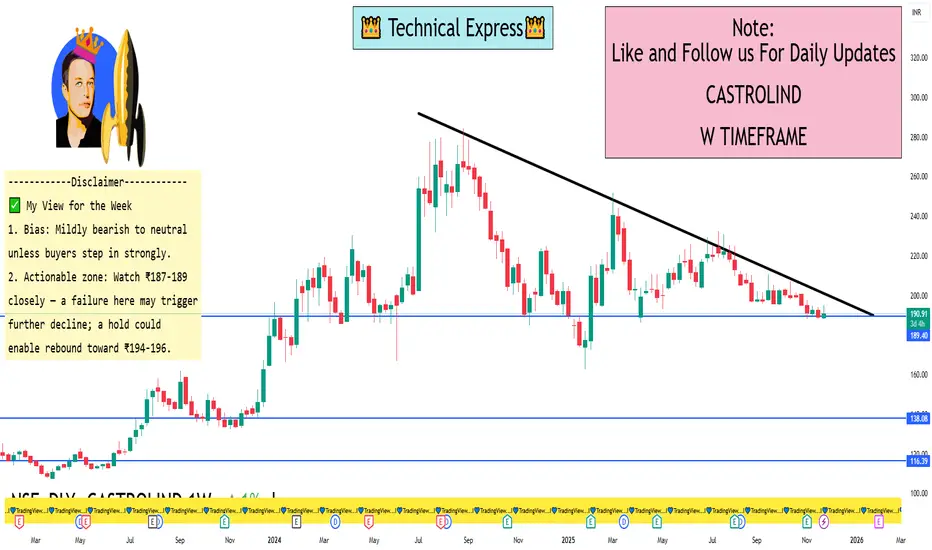
CASTROLIND 1 Week View 🔍 Key Levels
Based on recent technical data:
Support zone: ~ ₹187 – ₹189 (ET Money shows S3 ≈ ₹185.42, S2 ≈ ₹186.71)
Pivot / near-term equilibrium: ~ ₹190 – ₹191 (Weekly central pivot ~₹190.42)
Upside resistance: ~ ₹194 - ₹196 (Weekly R1 ~₹192.83, R2 ~₹196.64)
📈 Short-Term Bias & Likely Scenarios
The momentum indicators (RSI ~33, CCI negative) show the stock is under downward pressure/weak momentum.
If the price stays above ₹187-189, one could anticipate a bounce up into the ₹194-196 zone this week.
If it breaks below ~₹187-189 decisively, support further down could be ~₹183-185 (based on extension levels)
✅ My View for the Week
Bias: Mildly bearish to neutral unless buyers step in strongly.
Actionable zone: Watch ₹187-189 closely — a failure here may trigger further decline; a hold could enable rebound toward ₹194-196.
If you want a more aggressive trade setup (with stop-loss, reward ratio), I can map that too.
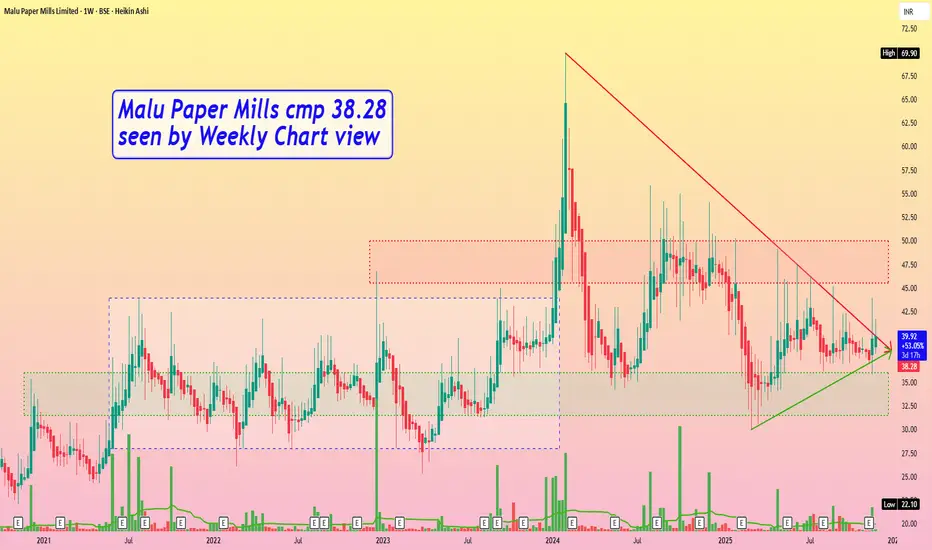
Malu Paper Mills cmp 38.28 by Weekly Chart viewMalu Paper Mills cmp 38.28 by Weekly Chart view
- Support Zone 31.50 to 36 Price Band
- Resistance Zone 45.50 to 50 Price Band
- Darvas Box Strategy Breakout done in Jan 2024
- Volumes spiking regularly over the past few weeks
Infibeam Avenues cmp 19.67 by Daily Chart viewInfibeam Avenues cmp 19.67 by Daily Chart view
- Support Zone 16.00 to 18 Price Band
- Resistance Zone 21.50 to 23.50 Price Band
- Falling Resistance Price Channel Breakout sustained
- Rising Support Price Channel going in a uptrend mode
- Bullish Rounding Bottoms by Resistance Zone neckline
- Volumes spiking at regular intervals over past few weeks

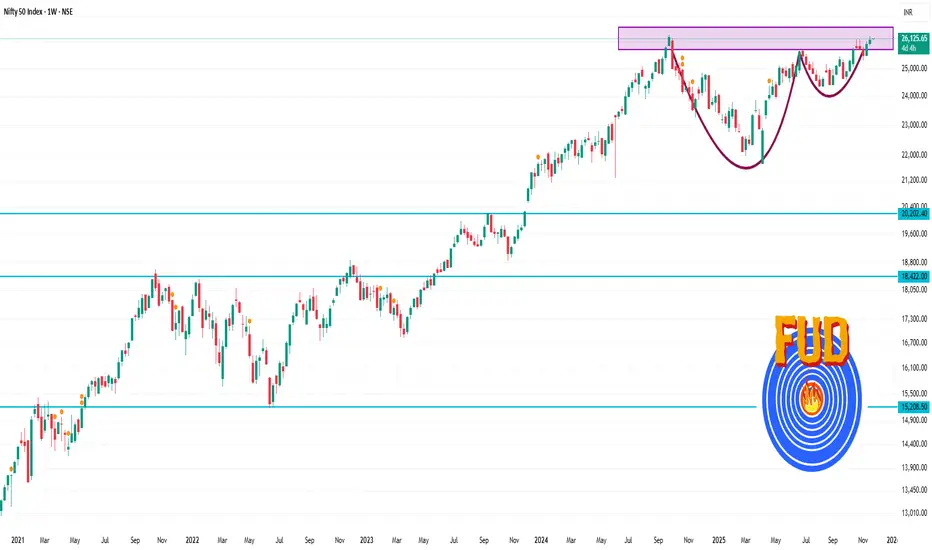
Nifty 50 1 Week Time Frame - Approximate value: ≈ 26,129.4 as of today.
- Weekly technical pivot support/resistance:
Weekly Bollinger Band top: ~ 26,166.78
Weekly Bollinger Band bottom: ~ 24,099.21
BEL 1 Month Time Frame📌 Key Levels & Observations
Current price: approximately ₹ 416.35 per share.
Recent range: Daily highs ~₹ 423–424, lows ~₹ 415.50.
52-week high ~₹ 436 and 52-week low ~₹ 240.25.
🎯 Short-Term (1-Month) Important Levels
Support zone: ~₹ 405-410 — falling below this may weaken short-term structure.
Resistance zone: ~₹ 430-435 — breaking above this could open scope toward ₹ 440.
Near-term target range: If bullish momentum holds, look toward ~₹ 430-440.
Risk zone: If momentum falters and the support zone fails, price may drift back toward ~₹ 400 or lower.
⚠️ Caveats
These levels are technical estimates, not fundamental valuations or guarantees.
Market sentiment, order flows (for BEL), defence‐policy changes, etc. can shift the picture quickly.
Always use stop-loss or risk controls.

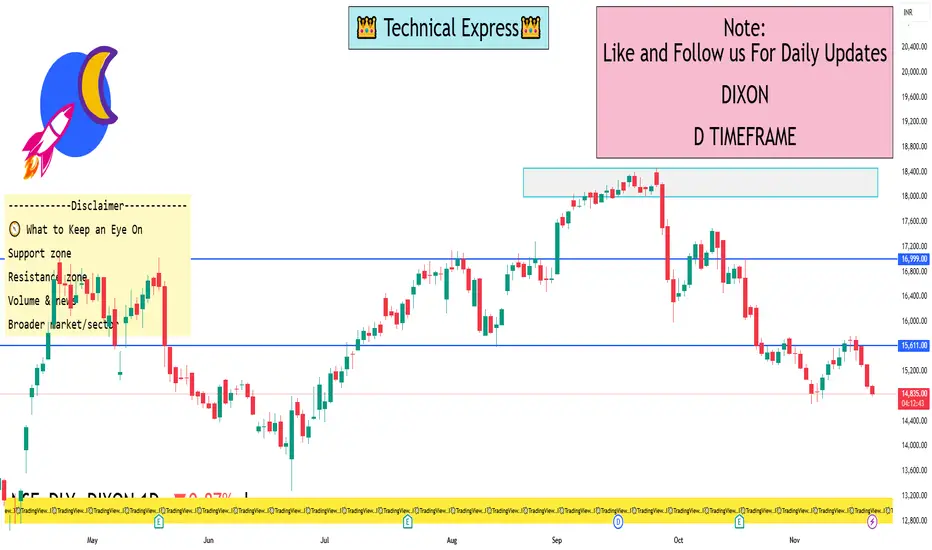
DIXON 1 Day Time Frame 🔍 Price & Pivot Levels to Watch
1. Latest live price: ~ ₹14,825 (as of intraday in India) from Groww.
2. Pivot levels (classic) for the day (based on Moneycontrol data):
Pivot ~ ₹15,065
S1 ~ ₹14,820
R1 ~ ₹15,209
3. Key moving-average resistances:
50-day SMA ~ ₹15,578 (price is below)
200-day SMA ~ ~₹15,738 – ~₹15,789 range (price is well below).
🧭 What to Keep an Eye On
Support zone: Near the S1 pivot (~₹14,820) and possibly the intra-day low zone (~₹14,700-14,800)
Resistance zone: The pivot (~₹15,065) and then R1 (~₹15,209) and the nearby moving averages (~₹15,500-15,600)
Volume & news: A sharp uptick in volume or a positive corporate/catalyst event could change the short-term dynamic.
Broader market/sector: Since Dixon is in electronics manufacturing, macro sentiment, export incentives, and input cost changes matter.
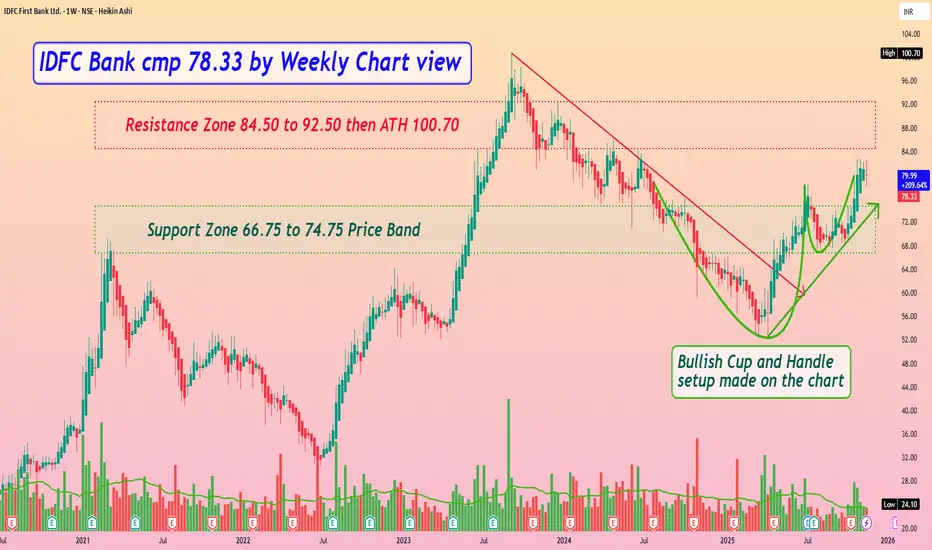
IDFC Bank cmp 78.33 by Weekly Chart viewIDFC Bank cmp 78.33 by Weekly Chart view
- Support Zone 66.75 to 74.75 Price Band
- Resistance Zone 84.50 to 92.50 then ATH 100.70
- Bullish Cup and Handle setup made on the stock chart
- Volumes are in good sync with the average traded quantity
- Rising Support Trendline well sustained and trending positively
- Resistance Zone Breakout by increased volumes to pave way for New ATH
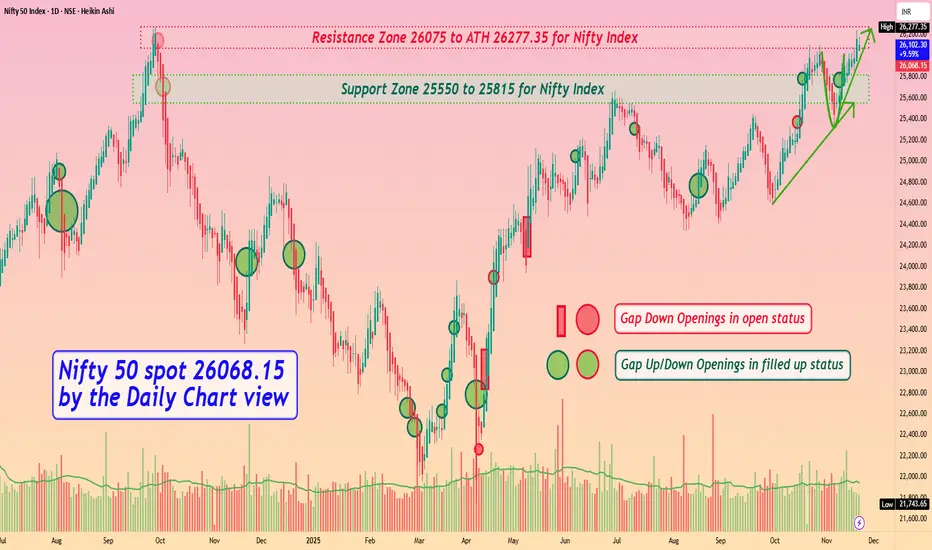
Nifty 50 spot 26068.15 by the Daily Chart view - Weekly updateNifty 50 spot 26068.15 by the Daily Chart view - Weekly update
- Support Zone 25550 to 25815 for Nifty Index
- Resistance Zone 26075 to ATH 26277.35 for Nifty Index
- Nifty keeping off to create ATH by Domestic and Geo Political events
- Bullish momentum intact but general Global paleness keeps New ATH distant
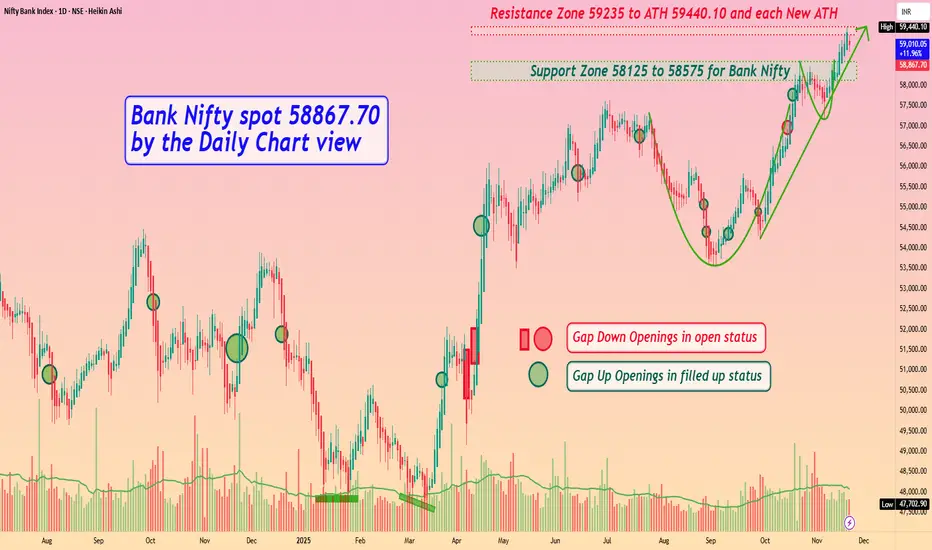
Bank Nifty spot 58867.70 by Daily Chart view - Weekly updateBank Nifty spot 58867.70 by Daily Chart view - Weekly update
- Support Zone 58125 to 58575 for Bank Nifty
- Resistance Zone 59235 to ATH 59440.10 and each New ATH
- Bullish momentum intact, aiding New ATH pretty much on daily basis
- Domestic and Geo Political events kept Bank Nifty off from creating New ATH
IDBI Bank cmp 104.62 by Monthly Chart viewIDBI Bank cmp 104.62 by Monthly Chart view
- Support Zone at 64 to 84 Price Band
- Resistance Zone at 108 to 128 Price Band
- Breakout attempted from Falling Resistance Trendline
- Bullish Head and Shoulders by the Resistance Zone neckline
- Monthly Volumes spiking regularly over a year since Sept 2024
- Positively trending Technical Indicators BB, EMA, MACD, RSI, SAR, SuperTrend

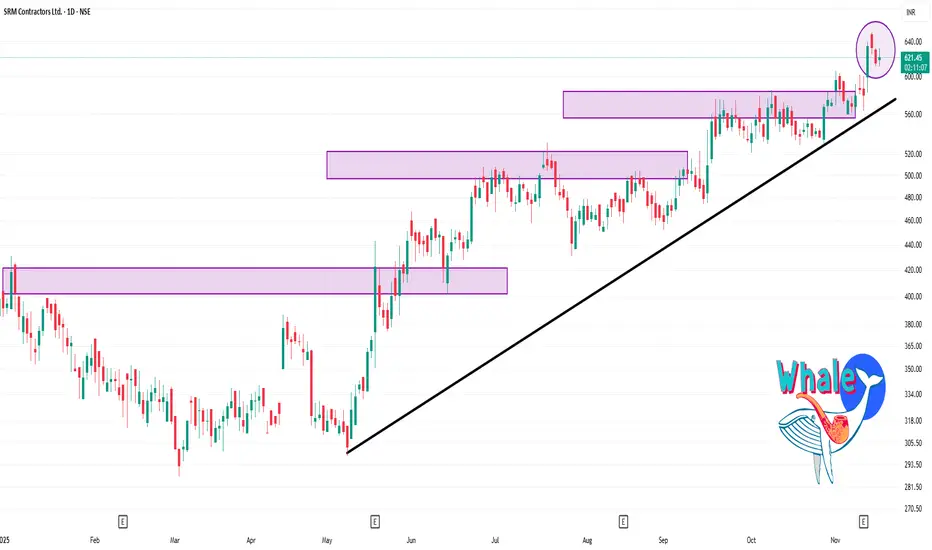
SRM 1 Day Time Frame 🔍 Key Levels (Daily Pivot / Support / Resistance)
Based on classic pivot calculations from recent prices:
Pivot: ~ ₹626.4 approx.
Resistance Zones:
R1 ~ ₹636.8
R2 ~ ₹645.3
R3 ~ ~ ₹655.7
Support Zones:
S1 ~ ₹617.99
S2 ~ ~ ₹607.6
S3 ~ ~ ₹599.1
🎯 My Short-Term View
Bullish setup: If the stock holds above the pivot ~₹626 and the support zone near ~₹617-620, it has room to test ~₹636-645 and potentially ~₹655.
Risk / caution area: If price drops back below ₹617-620 convincingly, then support near ~₹607-600 becomes important.
Ideal buy: A pull-back to the ~₹620 region with confirmation (volume/support) could offer a good risk/reward. Alternatively, a breakout above ~₹645 with strong volume could trigger further upside.
Stop / risk control idea: For a long trade, one could consider a stop below ~₹600-607 depending on risk tolerance.
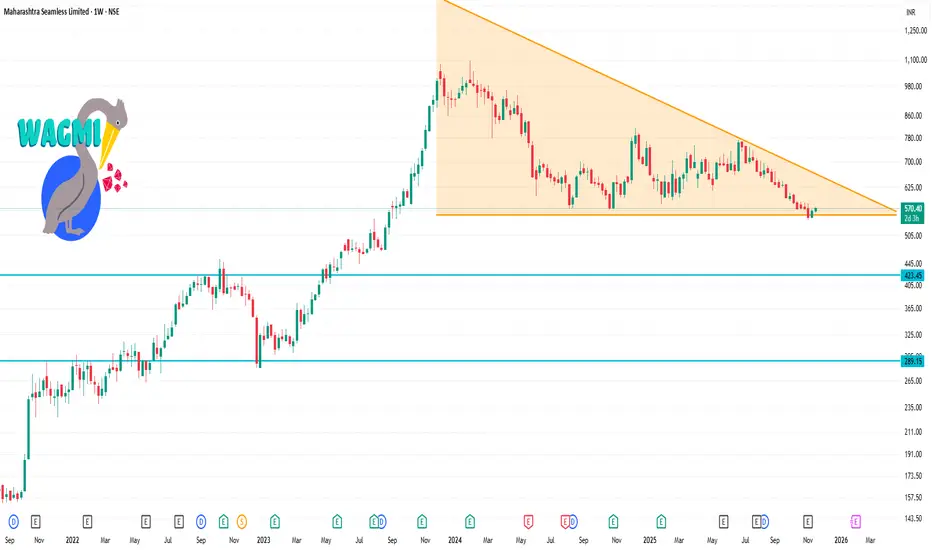
MAHSEAMLES 1 Week Time Frame 🔍 Current Price & Context
Latest price ~ ₹570 (on NSE as of today)
52-week low ~ ₹540.50, 52-week high ~ ₹814.30
On the daily technicals: recent signals show moving averages (shorter term) are positive, but the 200-day MA is still signalling “sell”.
📏 Weekly Timeframe Key Levels & Structure
Based on pivot-levels, support/resistance calculations and previous ranges:
Weekly pivot (Standard) around ~ ₹571.30
Support zone:
~ ₹557-560 region (S1) from pivot table.
A major structural support near ~ ₹540-550, given the 52-week low and previous reaction zone.
Resistance zone:
Immediate resistance ~ ~₹579-580 region (R1-R2) from weekly pivot table.
Broader resistance / upside hurdle near ~ ₹600+, and medium term near ~ ₹650-700+ (based on higher pivots & prior highs)
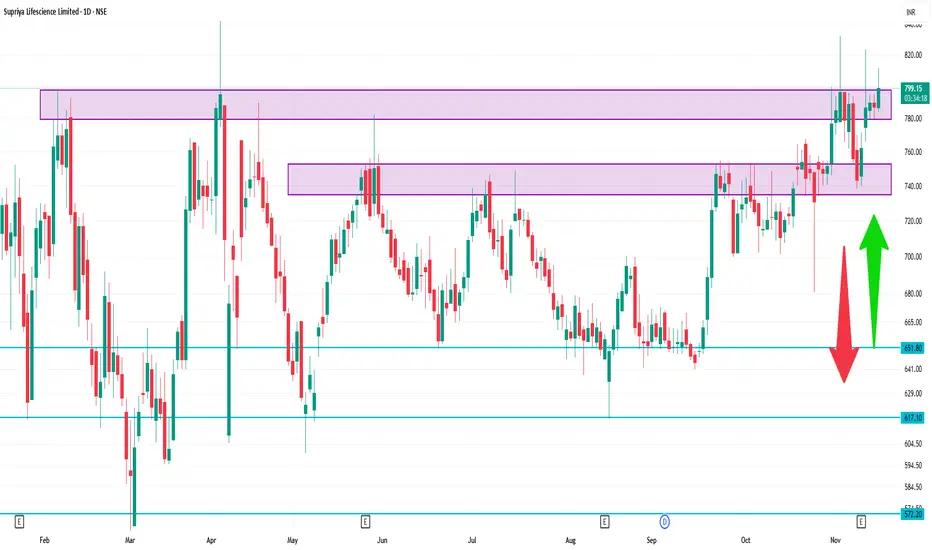
SUPRIYA 1 Day Time Frame Level ✅ Latest Price Snapshot
Most recent price: ~ ₹ 789.70 according to Groww.
Previous close in other sources: ~ ₹ 743.35 (Moneycontrol) for an earlier timestamp.
Day’s trading range (recent): ~ ₹ 779.45 – ₹ 795.10
📊 Key Levels (1-Day)
From recent pivot, support & resistance calculations:
Pivot / central range
Daily pivot approx: ~ ₹ 792.05
Another reference: pivot ~ ₹ 782.65
Resistance levels
R1 ~ ₹ 803 (approx)
R2 ~ ₹ 816
Longer-term upper band: ~ ₹ 842 (52-week high)
Support levels
S1 ~ ₹ 769
S2 ~ ₹ 748
S3 ~ ₹ 735
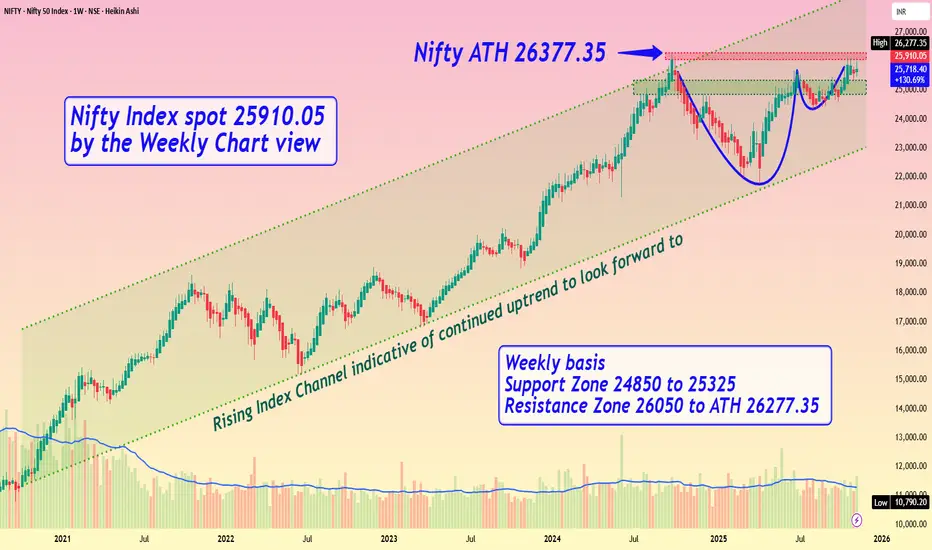
Nifty Index spot 25910.05 by the Weekly Chart viewNifty Index spot 25910.05 by the Weekly Chart view
- Weekly basis - Support Zone 24850 to 25325
- Weekly basis - Resistance Zone 26050 to ATH 26277.35
- Rising Index Channel indicative of continued uptrend to look forward to .....
- Bullish Cup and Handle pattern shows breakout expectation from Resistance Zone
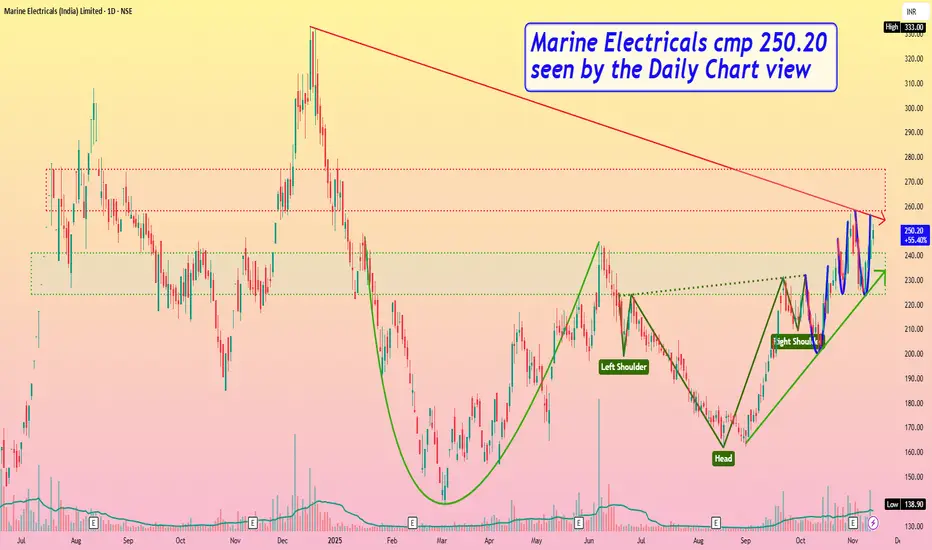
Marine Electricals cmp 250.20 by Daily Chart viewMarine Electricals cmp 250.20 by Daily Chart view
- Support Zone 224 to 241 Price Band
- Resistance Zone 258 to 275 Price Band
- Bullish Chart setup by Rounding Bottoms, pre and post Head & Shoulders
- Volumes seen spiking very heavily and well above the average traded quantity
- Positively trending Technical Indicators BB, EMA, MACD, RSI, SAR, SuperTrend, VWAP
- Breakout attempted above Falling Resistance Trendline and Rising Support Trendline sustained
- Fresh Breakout probable subject to Resistance Zone crossing and closure sustained above it for few days
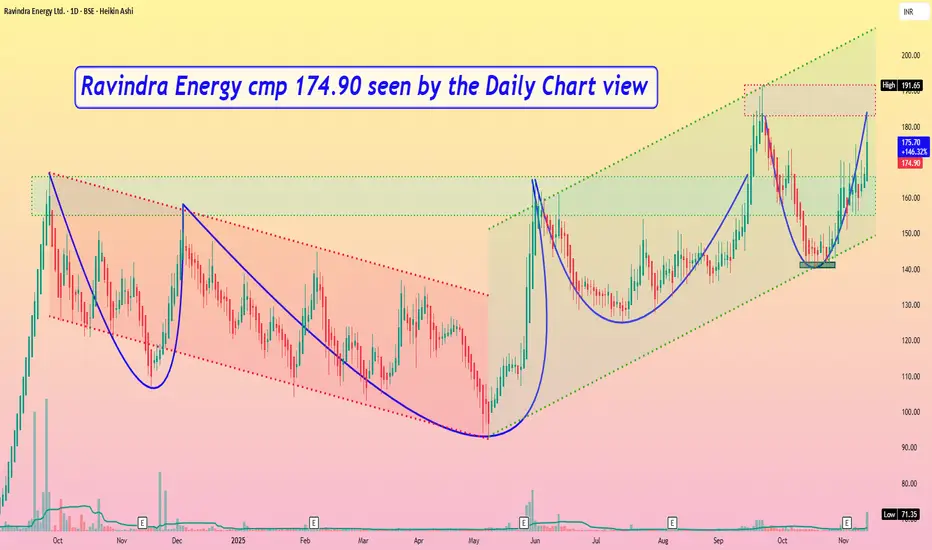
Ravindra Energy cmp 174.90 by Daily Chart viewRavindra Energy cmp 174.90 by Daily Chart view
- Support Zone 155 to 166 Price Band
- Resistance Zone 183 to ATH 191.60 Price Band
- Bullish Triple Bottom formed at 140 to 142 price band
- Repeated Bullish Rounding Bottoms with considerate VCP too
- Volumes spiking in good numbers intermittently over past few weeks
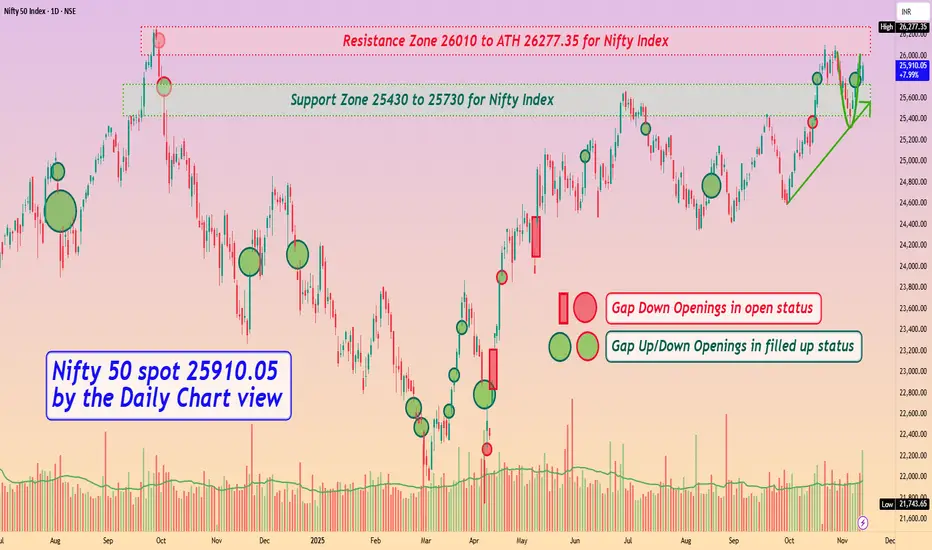
Nifty 50 spot 25910.05 by Daily Chart view - Weekly UpdateNifty 50 spot 25910.05 by Daily Chart view - Weekly Update
- Support Zone 25430 to 25730 for Nifty Index
- Resistance Zone 26010 to ATH 26277.35 for Nifty Index
- Rising Support Trendline seems respected by weekly positive closure
- Rounding Bottom Bullish momentum by Resistance Zone neckline seems sustained
- Nifty timidly shy from creating a New Lifetime High by crossing ATH final hurdle remains effectively elusive
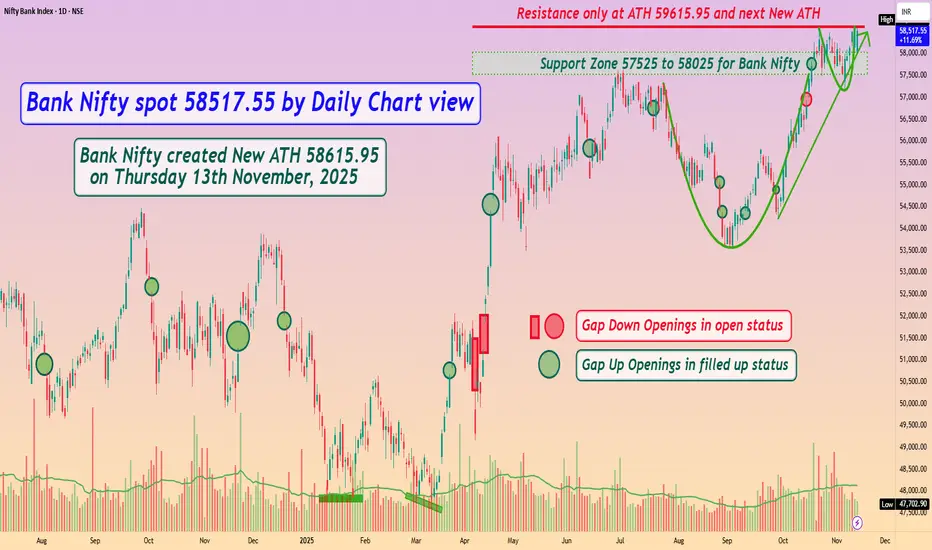
Bank Nifty spot 58517.55 by Daily Chart view - Weekly UpdateBank Nifty spot 58517.55 by Daily Chart view - Weekly Update
- Support Zone 57525 to 58025 for Bank Nifty
- Resistance only at ATH 59615.95 and next New ATH
- Bank Nifty created New ATH 58615.95 on Thursday 13th November, 2025
- Bullish momentum of Rounding Bottoms by Support Zone and Resistance Zone necklines well sustained
TECHM 1 Week TIme Frame 📌 Current snapshot
The latest quoted price is around ₹1,442-₹1,451.
The 52-week range: low ~ ₹1,209 and high ~ ₹1,807.
On its daily chart, the stock is trading below its 52-week high and closer to recent support zones.
🎯 Potential trade / strategy scenarios
Bullish trigger: Break above ≈ ₹1,470 with volume → could open the way towards ~₹1,500+.
Bearish trigger: Break below ≈ ₹1,430-₹1,440 convincingly → risk of drop to ~₹1,395 or even ~₹1,350.
Range scenario: If it continues to trade between ~₹1,440-₹1,470 without breakout, then expect consolidation (sideways moves).
