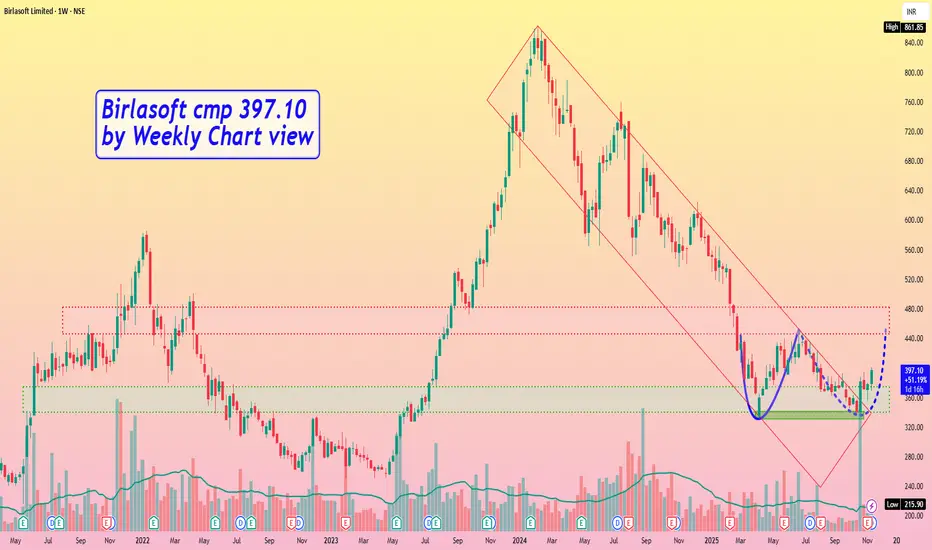
Birlasoft cmp 397.10 by Weekly Chart viewBirlasoft cmp 397.10 by Weekly Chart view
- Support Zone 340 to 375 Price Band
- Resistance Zone 446 to 482 Price Band
- Falling Price Channel Breakout seems been sustained
- Bullish "W" Double Bottom seems to be in the making process
- Fresh Breakout subject to Resistance Zone crossover and closure above it for few days
Chartpatternanalysis
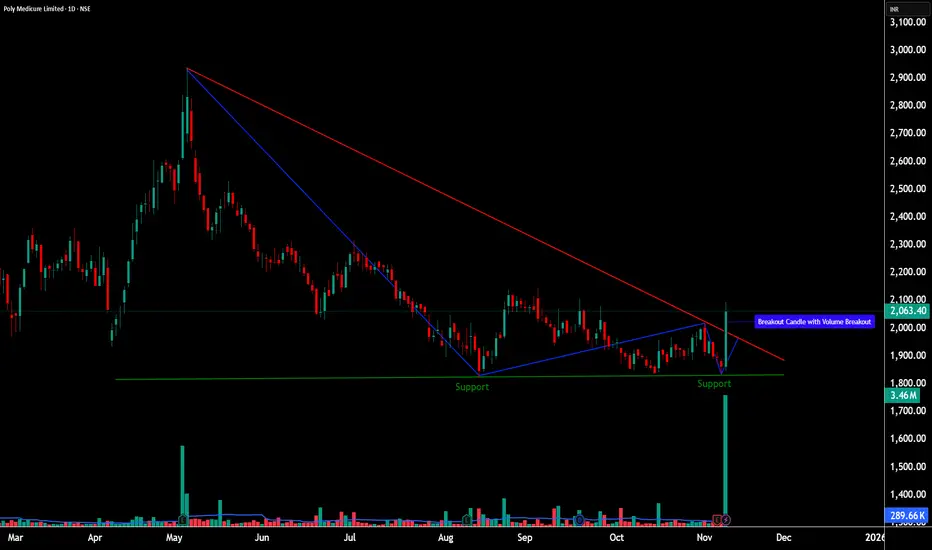
POLYMED - Breakout from Descending Triangle with Volume💹 Poly Medicure Ltd (NSE: POLYMED)
Sector: Healthcare & Diagnostics | CMP: ₹2,063.40 | View: Descending Triangle Breakout + 52-Week Volume Expansion
📊 Price Action
Poly Medicure finally broke out from a six-month descending structure with a sharp bullish candle. The move came after sustained compression near ₹1,800–₹1,850 support and resulted in a clean trendline breakout with the highest daily volume of the year.
Chart Pattern: Descending Triangle (Breakout in Progress)
Candlestick Pattern: Bullish Engulfing (Formed at Lower Boundary of Triangle – Base Support Zone ₹1,800–₹1,850)
📈 STWP Trading Analysis
STWP Trade Setup
Bullish Breakout: ₹2,094.30
Stop Loss: ₹1,829.30
Possible Intraday Demand Zone: 1869.50 - 1850.20
Possible Swing Demand Zone: 1869.50 - 1832.90
Momentum: High
Volume: 52-week breakout
This marks the possible conviction zone — where price, pattern, and participation align perfectly.
🧭 Support & Resistance
Support 1: ₹1,908 – immediate retest zone
Support 2: ₹1,752 – mid-base accumulation area
Support 3: ₹1,659 – final demand base
Resistance 1: ₹2,156 – near-term resistance
Resistance 2: ₹2,249 – previous supply pocket
Resistance 3: ₹2,404 – key breakout target zone
🔢 Fibonacci Levels
Retracement from the ₹3,000 high to ₹1,700 low shows:
38.2% level: ₹2,160
50% level: ₹2,350
📈 Volume & Momentum Setup
RSI: back above 61 — momentum returning
MACD: bullish crossover with growing histogram
CCI: high but justified by volume expansion
The breakout candle printed the highest daily volume in a year, confirming institutional accumulation.
While the weekly chart remains in recovery mode, the daily structure is already in breakout alignment.
🧩 STWP Summary View
Momentum: Strong
Trend: Early Reversal Attempt
Volume: Extremely High
Risk: Moderate (Stop below ₹1,830)
Bias: Bullish above ₹2,100 | Neutral below ₹1,850
________________________________________
⚠️ Disclosure & Disclaimer – Please Read Carefully
This post is created purely for educational and informational purposes and does not constitute investment advice or a buy/sell recommendation.
I am not a SEBI-registered investment adviser. All observations are based on technical studies and publicly available information.
Trading and investing involve risk; please manage position size and stop-loss discipline as per your risk profile.
Always consult a SEBI-registered financial advisor before making trading decisions.
________________________________________
Position Status: No active position in (POLYMED) at the time of analysis.
Data Source: TradingView & NSE India
💬 Found this useful?
🔼 Boost this post if you value clean, structured analysis.
💭 Drop your views — can Torrent Pharma sustain this breakout above ₹3,835?
🔁 Share this with traders who track institutional breakouts.
👉 Follow for more price-action based institutional setups.
🚀 Stay Calm. Stay Clean. Trade With Patience.
Trade Smart | Learn Zones | Be Self-Reliant 📊
________________________________________
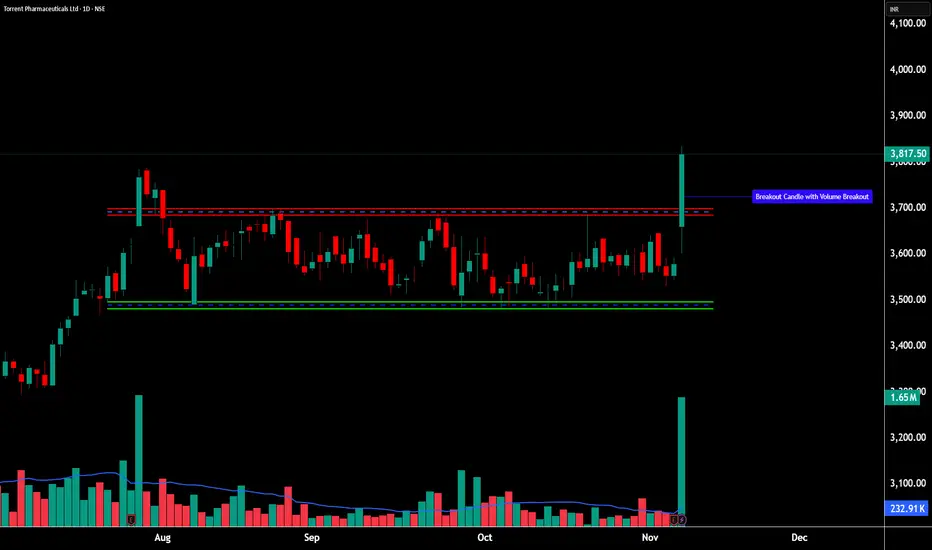
TORNTPHARM - 52-Week Breakout With Institutional Conviction________________________________________
💹 Torrent Pharmaceuticals Ltd (NSE: TORNTPHARM)
Sector: Pharmaceuticals | CMP: ₹3,817.50 | View: 52-Week Breakout With Institutional Conviction
________________________________________
📊 Price Action:
Torrent Pharma delivered a powerful 52-week breakout candle backed by exceptionally high volume, confirming strong institutional participation and renewed leadership momentum within the pharma space.
After consolidating for several weeks between ₹3,400–₹3,650, the stock broke through resistance with a wide-range bullish candle, signaling a structural shift from accumulation to expansion.
The follow-through strength and delivery volume highlight conviction buying, positioning Torrent Pharma for potential short- to medium-term trend continuation.
________________________________________
💼 HNI Trade Levels (STWP Setup):
Aggressive Entry: ₹3,817–₹3,835 | Stop Loss: ₹3,660
Low-Risk Entry: ₹3,770 | Stop Loss: ₹3,594.09
The breakout session recorded 1.65M shares vs 0.23M average, confirming institutional footprints.
Price structure has cleanly shifted into higher territory, with ₹3,665–₹3,700 now acting as the new demand base.
Sustaining above this zone keeps the bias firmly bullish with room for further upside extension.
________________________________________
📉 Chart Pattern Analysis – 52-Week Breakout (Institutional Structure):
Torrent Pharma has been in a multi-week compression phase, forming a tight base under the ₹3,700 resistance zone.
Such base formations often precede high-conviction institutional breakouts, and the explosive candle with volume confirmation validates that the breakout is not speculative but driven by genuine accumulation.
The move aligns with sectoral strength seen across quality pharma counters, where price action is transitioning from range-bound to trending behavior.
This breakout now places Torrent Pharma in the leadership bracket within the pharma index structure, supported by momentum and delivery expansion.
________________________________________
📈 STWP Trading Analysis:
Bullish Breakout: ₹3,817–₹3,835 | Stop Loss: ₹3,660.06
The breakout candle exhibited strong momentum with a 7x volume surge, indicating clear participation from institutions and long-only funds.
Price has decisively closed above short- and medium-term EMAs, confirming trend alignment across daily and weekly timeframes.
Holding above ₹3,665–₹3,700 will maintain the bullish bias, keeping the setup active toward ₹3,935–₹4,015 in the short term.
A sustained close above ₹3,935 can potentially open the next expansion leg toward ₹4,145 levels.
________________________________________
📈 Candlestick Structure – Bullish Strength Confirmation:
The breakout candle represents a strong bullish engulfing formation, signaling complete control by buyers.
The large body-to-wick ratio and volume expansion confirm institutional momentum entry rather than retail-driven strength.
Such candles following a multi-week base often mark early-stage uptrend resumption phases, where risk-to-reward remains highly favorable if trend levels hold.
________________________________________
📏 Fibonacci Analysis:
From swing low ₹3,079 to swing high ₹3,835:
61.8% retracement @ ₹3,436 → Major base support
50% retracement @ ₹3,457 → Structural accumulation zone
23.6% retracement @ ₹3,666 → Confirmed demand zone
Sustaining above the 23.6% level keeps the momentum firmly intact, while a clean close above ₹3,935 validates continuation toward ₹4,145–₹4,185 Fibonacci extension levels.
________________________________________
🧭 STWP Support & Resistance:
Resistances: ₹3,901 | ₹3,984 | ₹4,134
Supports: ₹3,667 | ₹3,518 | ₹3,344
The ₹3,665–₹3,700 area remains the immediate accumulation pocket, aligning with EMA support and Fibonacci confluence.
The breakout above ₹3,835 confirms strength, while supports around ₹3,500 represent deeper institutional demand zones.
________________________________________
📊 STWP Volume & Technical Setup:
Today’s session saw 1.65M shares traded vs 0.23M average, validating strong institutional accumulation and conviction buying.
Indicators confirm trend strength:
RSI (70+) – sustaining above bullish zone.
MACD – positive crossover maintained.
CCI & Stochastic – both elevated, reflecting momentum expansion.
Overall alignment across daily and weekly charts confirms trend continuation potential.
Trend Direction: UPTREND | Volume Confirmation: Strong Institutional Activity
________________________________________
🧩 STWP Summary View:
Final Outlook:
Momentum: Strong | Trend: Bullish | Risk: Moderate | Volume: High
Torrent Pharma’s breakout signifies a transition from accumulation to expansion, supported by clear institutional conviction and strong technical structure.
As long as the price sustains above ₹3,665–₹3,700, the bias remains bullish with targets toward ₹3,935–₹4,145 in the near term.
The setup continues to display a clean risk–reward framework within an evolving leadership trend in the pharma sector.
________________________________________
⚠️ Disclosure & Disclaimer – Please Read Carefully
This post is created purely for educational and informational purposes and does not constitute investment advice or a buy/sell recommendation.
I am not a SEBI-registered investment adviser. All observations are based on technical studies and publicly available information.
Trading and investing involve risk; please manage position size and stop-loss discipline as per your risk profile.
Always consult a SEBI-registered financial advisor before making trading decisions.
________________________________________
Position Status: No active position in (TORNTPHARM) at the time of analysis.
Data Source: TradingView & NSE India
💬 Found this useful?
🔼 Boost this post if you value clean, structured analysis.
💭 Drop your views — can Torrent Pharma sustain this breakout above ₹3,835?
🔁 Share this with traders who track institutional breakouts.
👉 Follow for more price-action based institutional setups.
🚀 Stay Calm. Stay Clean. Trade With Patience.
Trade Smart | Learn Zones | Be Self-Reliant 📊
________________________________________
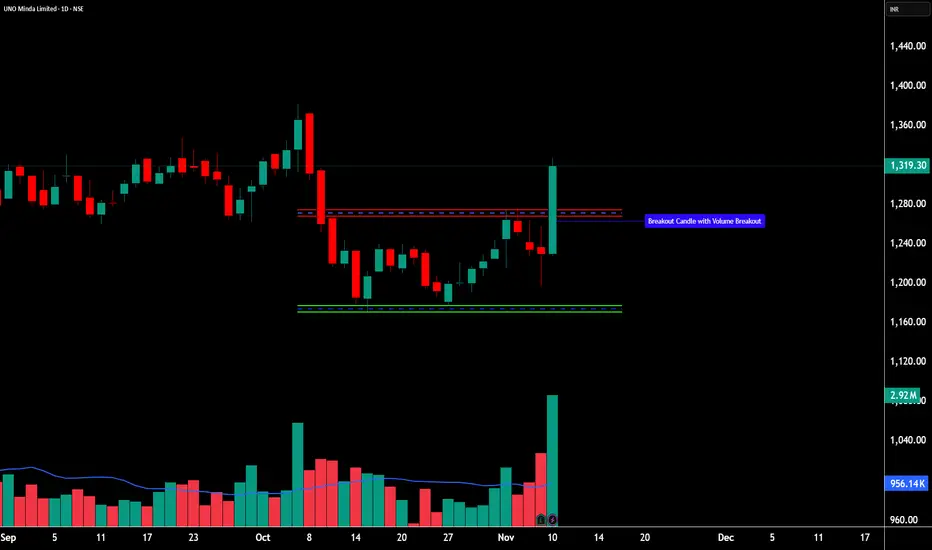
UNOMINDA - Institutional Breakout After Price Compression________________________________________
💹 UNO Minda Ltd (NSE: UNOMINDA)
Sector: Auto Components | CMP: ₹1,319.30 | View: Institutional Breakout After Price Compression
________________________________________
📊 Price Action:
UNO Minda has delivered a strong breakout candle after a prolonged phase of price compression within a rising channel, confirming a shift from consolidation to directional momentum.
The stock rebounded sharply from the ₹1,190 zone and pierced through the upper trendline with an exceptionally high volume spike, signaling renewed institutional interest.
This breakout structure now positions the stock for a potential continuation move as long as price sustains above the ₹1,255–₹1,270 support base.
________________________________________
💼 HNI Trade Levels (STWP Setup):
Aggressive Entry: ₹1,319–₹1,327 | Stop Loss: ₹1,238.57
Low-Risk Entry: ₹1,297 | Stop Loss: ₹1,210.74
The breakout candle recorded volume of 2.9M vs 0.95M average, confirming heavy accumulation and strong HNI participation.
The near-term momentum bias remains bullish, supported by both volume expansion and favorable price structure.
________________________________________
📉 Chart Pattern Analysis – Compression Breakout (Bullish Structure):
Over the past few weeks, UNO Minda formed a rising channel pattern characterized by narrowing ranges and lower volatility — a classic price compression structure.
This phase often precedes large directional moves, and the breakout above ₹1,310 confirms the volatility expansion phase.
Such structures typically indicate early-stage accumulation by institutional hands before momentum expansion begins.
The confirmation of breakout with both volume and candle strength reflects clear smart money participation.
________________________________________
📈 STWP Trading Analysis:
Bullish Breakout: ₹1,319–₹1,327 | Stop Loss: ₹1,195.20
The breakout candle displayed strong momentum and 3x volume expansion, validating aggressive buying from higher timeframes.
Price action has now closed firmly above short- and mid-term EMAs, aligning all major timeframes — Daily, Weekly, and Monthly — in a unified uptrend.
Holding above ₹1,255–₹1,270 will maintain the bullish bias, keeping the setup active toward ₹1,379–₹1,420 in the near term.
A decisive close above ₹1,355 could further accelerate the next leg of the uptrend, extending the move toward ₹1,455.
________________________________________
📈 Candlestick Structure – Bullish Engulfing Confirmation:
The current breakout candle is a strong bullish engulfing formed after a brief sideways phase — signaling renewed dominance of buyers.
Such candles, especially when paired with volume spikes and EMA crossovers, mark the beginning of institutional-led expansion legs.
The price-volume confluence validates that the short-term correction phase has likely ended, and the stock is transitioning into an active swing momentum phase.
________________________________________
📏 Fibonacci Analysis:
From swing low ₹1,114 to swing high ₹1,327.8:
61.8% retracement @ ₹1,190 → Strong support zone defended.
78.6% retracement @ ₹1,255 → Current breakout retest area.
100% extension @ ₹1,327 → Confirmed expansion level.
Sustaining above ₹1,255 keeps the structure intact and supports continuation toward the ₹1,379–₹1,420 target band.
________________________________________
🧭 STWP Support & Resistance:
Resistances: ₹1,355 | ₹1,391 | ₹1,456
Supports: ₹1,255 | ₹1,191 | ₹1,155
The ₹1,255–₹1,270 zone remains a high-probability demand pocket, supported by both Fibonacci confluence and recent volume base formation.
The ₹1,355–₹1,390 zone acts as a minor resistance band, where partial booking or temporary supply may appear before momentum resumes.
________________________________________
📊 STWP Volume & Technical Setup:
Today’s breakout session recorded 2.92M shares vs 0.95M average, confirming exceptional institutional participation.
Indicators such as RSI (68.7) and MACD bullish crossover reinforce the continuation potential.
Stochastic and CCI both remain in strong zones, consistent with trend alignment across timeframes.
Trend Direction: UPTREND | Volume Confirmation: Strong Institutional Activity
________________________________________
🧩 STWP Summary View:
Final Outlook:
Momentum: Strong | Trend: Bullish | Risk: Moderate | Volume: High
UNO Minda has transitioned from a consolidation phase into a clean institutional breakout setup.
The combination of price compression, breakout volume, and bullish engulfing confirmation signals a fresh impulse wave beginning within the existing uptrend.
Holding above ₹1,255–₹1,270 will sustain the bullish structure, with potential upside toward ₹1,420–₹1,455 zones in the coming sessions.
________________________________________
⚠️ Disclosure & Disclaimer – Please Read Carefully
This analysis is intended solely for educational and informational purposes and does not constitute investment advice or a buy/sell recommendation.
I am not a SEBI-registered investment adviser. All observations are based on chart study, technical structure, and publicly available data.
Trading involves risk; please manage position size, stop-loss levels, and discipline as per your risk appetite.
Consult a SEBI-registered financial advisor before acting on any trade setup.
________________________________________
Position Status: No active position in (UNOMINDA) at the time of analysis.
Data Source: TradingView & NSE India
💬 Found this useful?
🔼 Boost this post to help more traders learn from structured setups.
💭 Drop your insights — how do you view this breakout’s sustainability?
🔁 Share with traders who value clean, volume-backed analysis.
👉 Follow for more price structure + institutional logic breakdowns.
🚀 Stay Calm. Stay Clean. Trade With Patience.
Trade Smart | Learn Zones | Be Self-Reliant 📊
________________________________________
Lg Balakrishnan & Bros Limited - Breakout Setup, Move is ON...#LGBBROSLTD trading above Resistance of 1517
Next Resistance is at 2647
Support is at 1140
Here are previous charts:
Chart is self explanatory. Levels of breakout, possible up-moves (where stock may find resistances) and support (close below which, setup will be invalidated) are clearly defined.
Disclaimer: This is for demonstration and educational purpose only. This is not buying or selling recommendations. I am not SEBI registered. Please consult your financial advisor before taking any trade.

Sambhv Steel Tubes cmp 121.45 by the Daily Chart since listedSambhv Steel Tubes cmp 121.45 by the Daily Chart since listed
- Support Zone 107 to 116 Price Band
- Breakout done from the Falling Price Channel
- Rising Price Channel taking upside momentum
- Volumes gradually picking up indicating continued uptrend
- Resistance Zone 125 to 135 Price Band then 142 to ATH 149.25

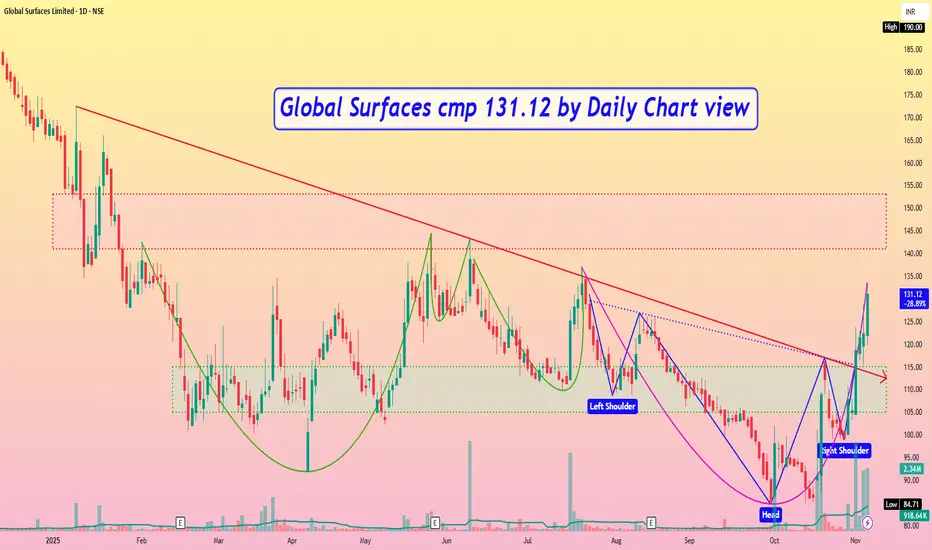
Global Surfaces cmp 131.12 by Daily Chart viewGlobal Surfaces cmp 131.12 by Daily Chart view
- Support Zone 105 to 115 Price Band
- Resistance Zone 141 to 153 Price Band
- Multiple Bullish Technical Chart patterns done
- Falling Resistance Trendline Breakout well sustained
- Majority of Technical Indicators seen trending positively
Blackbuck cmp 668.75 by the Daily Chart view since listedBlackbuck cmp 668.75 by the Daily Chart view since listed
- Support Zone 630 to 655 Price Band
- Resistance Zone 695 to 723 Price Band then ATH 747.35
- Support Zone tested retested and Rising Support Trendline well respected

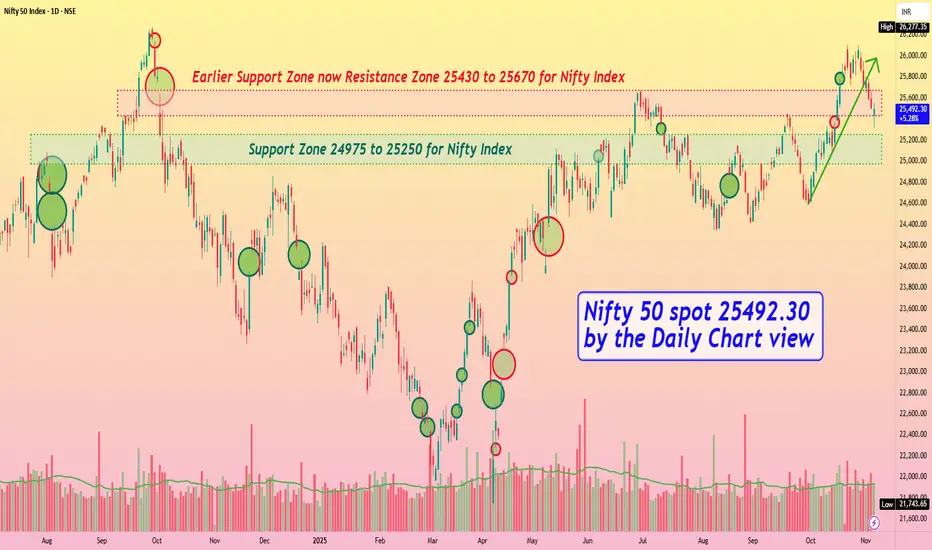
Nifty 50 spot 25492.30 by the Daily Chart view - Weekly updateNifty 50 spot 25492.30 by the Daily Chart view - Weekly update
- Support Zone 24975 to 25250 for Nifty Index
- Earlier Support Zone now Resistance Zone 25430 to 25670 for Nifty Index
- Rising Support Trendline Breakdown done basis the ongoing weak sentiments in general
- The final hurdle ATH remains elusive and Nifty keeps distinctly shy to create a New Lifetime High
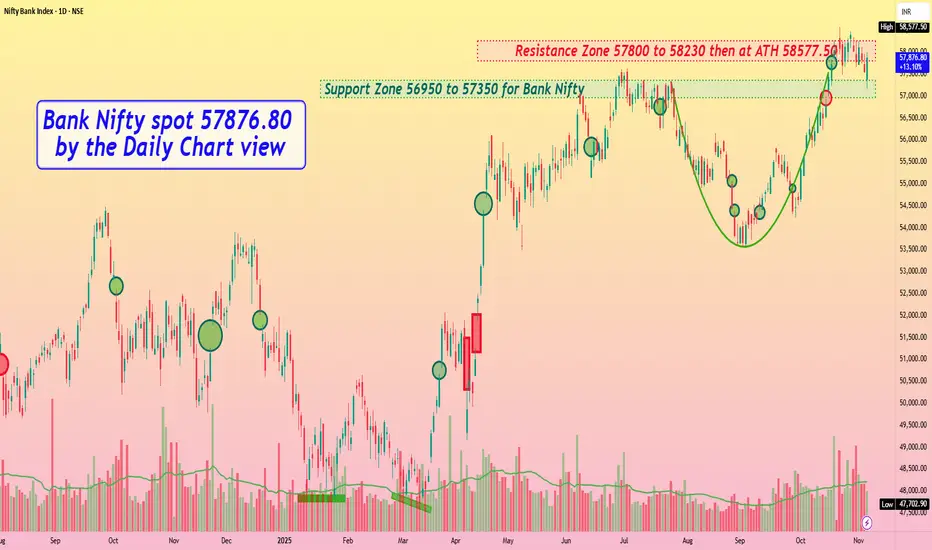
Bank Nifty spot 57876.80 by Daily Chart view - Weekly updateBank Nifty spot 57876.80 by Daily Chart view - Weekly update
- Support Zone 56950 to 57350 for Bank Nifty
- Resistance Zone 57800 to 58230 then at ATH 58577.50
- Bank Nifty sustaining between Support and Resistance Zones over 2 weeks
- Bullish Rounding Bottom still in active mode against the weak sentiments in general
Shriram Finance cmp 796.50 by Daily Chart viewShriram Finance cmp 796.50 by Daily Chart view
- Support Zone 728 to 760 Price Band
- Resistance only at ATH 814.15 done on Tuesday 04-Nov-2025
- The current Technical Chart setup is indicative of a very good upside with tentative target price level +/- 1025

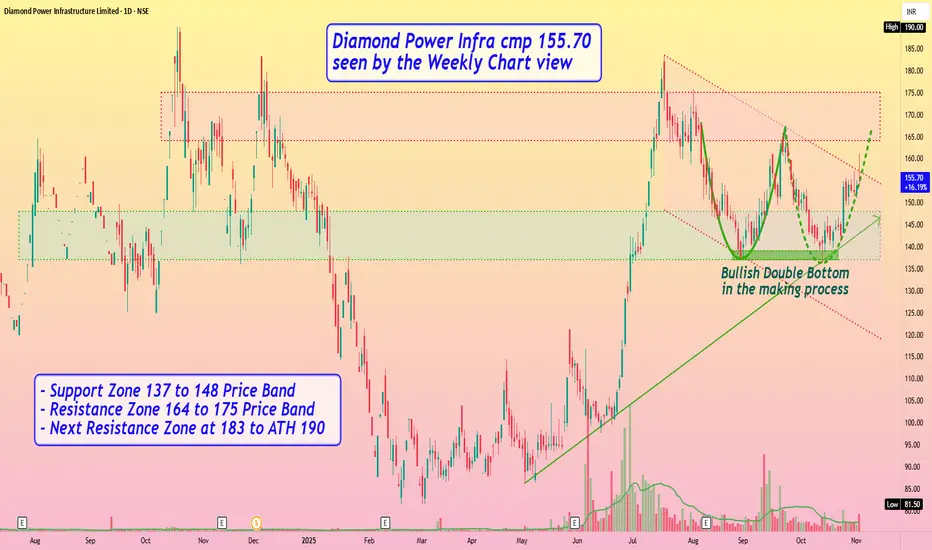
Diamond Power Infra cmp 155.70 seen by the Weekly Chart viewDiamond Power Infra cmp 155.70 seen by the Weekly Chart view
- Support Zone 137 to 148 Price Band
- Resistance Zone 164 to 175 Price Band
- Next Resistance Zone at 183 to ATH 190
- Bullish Double Bottom in the making process
- Rising Support Trendline seems well respected
- Volumes spiking regularly by close sync with avg traded qty
- Falling Price Channel Breakout seems to be in the making process
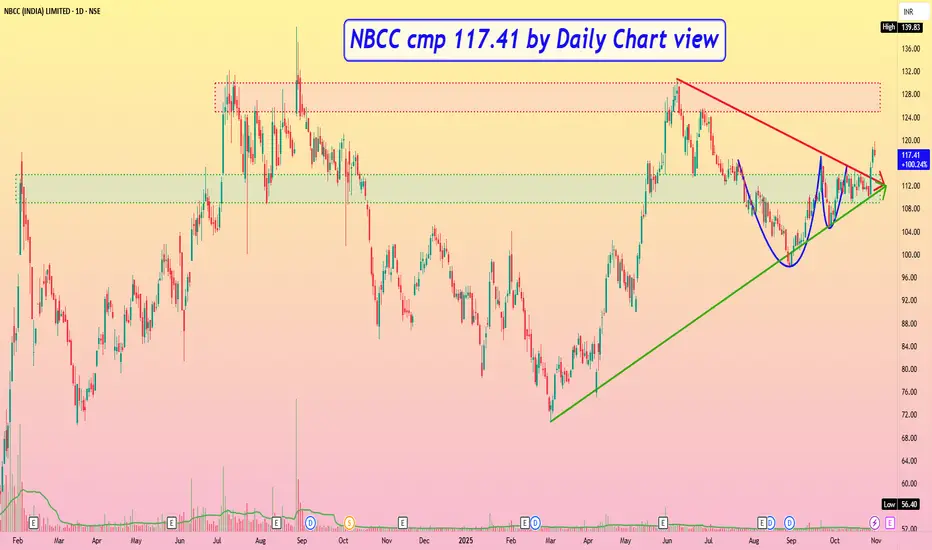
NBCC cmp 117.41 by Daily Chart viewNBCC cmp 117.41 by Daily Chart view
* Support Zone 109 to 114 Price Band
* Resistance Zone 125 to 130 Price Band then 137 to ATH 139.83
* Bullish Cup and Handle pattern is made around the Support Zone
* Symmetrical Triangle pattern breakout seems to be in making process
* Volumes in good sync with avg traded quantity and spiking above it too
* Falling Resistance Trendline Breakout with Rising Support Trendline well respected
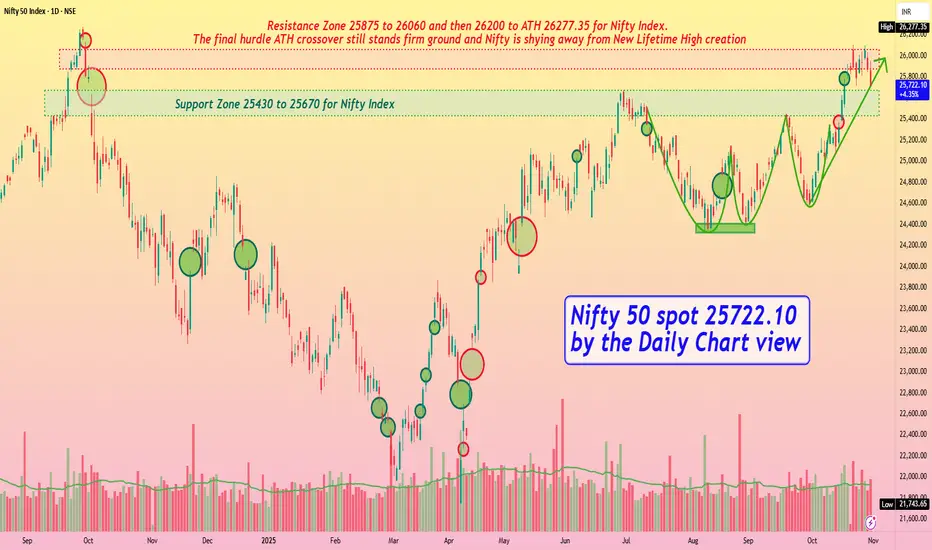
Nifty 50 spot 25722.10 by the Daily Chart view - Weekly UpdateNifty 50 spot 25722.10 by the Daily Chart view - Weekly Update
- Support Zone 25430 to 25670 for Nifty Index
- Rising Support Trendline seems in active mode but may be broken
- Nifty below Resistance Zone but taking rest tad above the Support Zone
- Resistance Zone 25875 to 26060 and then 26200 to ATH 26277.35 for Nifty Index
- Bullish Rounding Bottoms seems active but continued skepticism keeping the Nifty index weak
- The final hurdle ATH crossover still stands ground and Nifty shying away from New Lifetime High creation
Bullish Momentum Revival Near Key Support | STWP💹 Aurobindo Pharma Ltd (NSE: AUROPHARMA)
Sector: Pharmaceuticals | CMP: ₹1,138.90 | View: Bullish Momentum Setup
📊 Price Action:
Aurobindo Pharma shows strong bullish momentum after reclaiming key support zones near ₹1,100.
The stock has printed a bullish engulfing candle with institutional-grade volume, signaling a potential continuation of the uptrend.
Price action confirms demand absorption at lower levels with buyers defending the ₹1,080–1,100 zone effectively.
💼 HNI Trade Levels (STWP Setup):
Aggressive Entry: ₹1,138.90–₹1,155.80 | Stop Loss: ₹1,087.35
Low-Risk Entry: ₹1,137.12 | Stop Loss: ₹1,080.02
The STWP HNI Setup reflects a well-defined bullish structure supported by EMA 200 crossover and strong candle confirmation.
Smart money activity is visible through expanding volume footprints and VCP contraction signs fading toward breakout.
📉 VCP Analysis:
Aurobindo Pharma has undergone 112 VCP contractions, forming a tight base before breakout attempts.
Although the current candle is yet to confirm a clean VCP breakout, the setup suggests a pre-breakout stage, aligning with institutional interest.
The ongoing contraction phase combined with a bullish RSI breakout supports accumulation by strong hands.
📈 STWP Trading Analysis:
Entry: ₹1,155.80 | Stop Loss: ₹1,098.70 | Risk: ₹57.10
The bullish structure is reinforced by a 5x volume expansion and a strong buyer-dominated candle.
EMA 200 crossover, MACD bullish alignment, and RSI strength above 52 confirm upside bias.
Holding above ₹1,120 keeps the short-term structure firmly bullish toward ₹1,177–₹1,208 levels.
📏 Fibonacci Analysis:
From the swing low of ₹1,016.10 to the recent swing high of ₹1,208.20 — price currently hovers around the 61.8% retracement zone at ₹1,134.82, a critical Fibonacci pivot.
Sustaining above this level indicates strength and supports the ongoing uptrend.
Fibonacci extensions project targets near ₹1,208–₹1,218 on breakout confirmation.
🧭 STWP Support & Resistance:
Resistances: ₹1,163.13 | ₹1,187.37 | ₹1,218.93
Supports: ₹1,107.33 | ₹1,075.77 | ₹1,051.53
The ₹1,075–₹1,107 zone serves as a strong institutional support, aligning with prior demand clusters.
Weak resistance pockets lie between ₹1,163–₹1,208, opening space for a clean momentum push if price sustains above ₹1,155.
📊 STWP Volume & Technical Setup:
Today’s volume surged to 3.56M vs 1.3M average, confirming high institutional participation.
The chart highlights multiple technical confirmations — a strong EMA crossover, momentum breakout, and volatility expansion supported by a bullish candle formation.
Key momentum oscillators are turning upward, reflecting renewed strength and sustained bullish bias across timeframes.
🧩 STWP Summary View:
Final Outlook:
Momentum: Strong | Trend: Uptrend | Risk: High| Volume: High
Aurobindo Pharma is exhibiting robust institutional footprints with trend confirmation across all major indicators.
As long as the price holds above ₹1,107–₹1,120, the structure remains intact with scope for a short-term move toward ₹1,177–₹1,208.
The bias remains bullish with uptrend continuation potential into the next few sessions.
⚠️ Disclosure & Disclaimer – Please Read Carefully
This post is shared only for educational and informational purposes. It is not a buy/sell recommendation or financial advice.
I am not a SEBI-registered investment adviser; all views are based on technical observation and public market data.
Trading involves risk. Market movements can be unpredictable and may result in losses.
Always perform your own research or consult a SEBI-registered financial advisor before trading.
Position Status: No active position in (AUROPHARMA) at the time of this analysis.
Data Source: TradingView & NSE India
💬 Found this useful?
🔼 Give this post a Boost if you value structured, professional breakdowns.
✍️ Share your thoughts or charts below — let’s learn together!
🔁 Spread this post to help more traders adopt data-driven analysis.
👉 Follow for more clean, institutional-style setups with clarity and discipline.
🚀 Stay Calm. Stay Clean. Trade With Patience.
Trade Smart | Learn Zones | Be Self-Reliant 📊

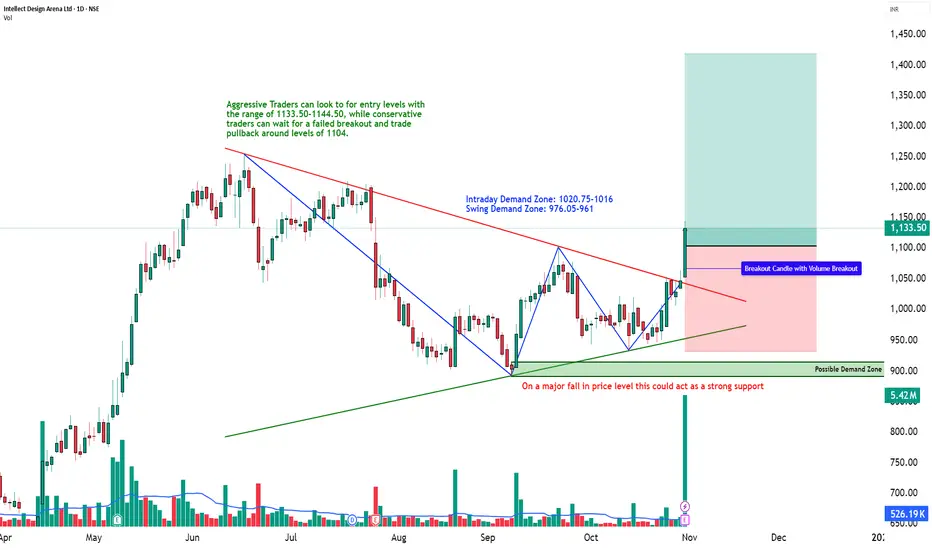
Descending Triangle Breakout with Institutional Volume | STWP💹 Intellect Design Arena Ltd (NSE: INTELLECT)
Sector: IT – FinTech Solutions | CMP: ₹1,133.50 | View: Bullish Momentum Breakout Setup
📊 Price Action:
Intellect Design Arena has delivered a strong bullish breakout from its multi-month descending trendline, marking a structural shift from a consolidation base to a clear uptrend.
The stock reversed sharply from the ₹890 swing low and confirmed momentum above the ₹1,100–₹1,120 zone with an explosive 10x volume expansion.
The wide-range bullish candle and sustained higher close suggest institutional breakout participation and trend continuation toward upper resistance zones.
💼 HNI Trade Levels (STWP Setup):
Aggressive Entry: ₹1,114.50 | Stop Loss: ₹1,044.35
Low-Risk Entry: ₹1,076.5 | Stop Loss: ₹1,019.5
HNI and institutional activity is visible through heavy delivery-based volume and strong follow-up momentum.
The bullish structure remains intact as long as price sustains above ₹1,075–₹1,080, where short-term demand has been confirmed.
📉 VCP Analysis:
Intellect displays a multi-stage Volatility Contraction Pattern (VCP) — 8 visible contractions as per the VCP dashboard.
Each contraction narrowed with decreasing volume before the final 20-day breakout candle confirmed a volatility expansion phase.
This marks the beginning of a trend acceleration stage, aligning perfectly with RSI, MACD, and Supertrend confirmations.
📈 STWP Trading Analysis:
Entry: ₹1,114.50 | Stop Loss: ₹1,044.35
The breakout candle exhibits strong momentum with 5.42M volume vs an average of 0.52M, indicating institutional footprints.
The price is now sustaining above short- and medium-term EMAs, with all major timeframes (Daily–Weekly–Monthly) confirming an uptrend alignment.
Holding above ₹1,095–₹1,075 will maintain the bullish bias, keeping momentum setups active toward ₹1,175–₹1,255 zones.
📏 Fibonacci Analysis:
From swing low ₹890.25 to swing high ₹1,255.0:
61.8% @ ₹1,115.7 → Confirmed breakout level.
78.6% @ ₹1,176.9 → Next momentum target.
100% @ ₹1,255.0 → Swing resistance.
A daily close above ₹1,116 validates the Fibonacci continuation path toward ₹1,255–₹1,285, with an extended potential to ₹1,354 (Fibo 127.2% projection).
🧭 STWP Support & Resistance:
Resistances: ₹1,167.5 | ₹1,201.5 | ₹1,255.0
Supports: ₹1,076.5 | ₹1,019.5 | ₹985.5
The ₹1,076–₹1,020 zone acts as a key accumulation pocket, while the ₹1,255 area marks a significant swing barrier.
Structure indicates strong base support with progressive higher demand, suggesting buyers remain dominant on dips.
📊 STWP Volume & Technical Setup:
Today’s session recorded 5.42M shares vs 0.52M average, a 10x volume surge, confirming institutional breakout participation.
Indicators show bullish MACD crossover, RSI momentum above 70, and Stochastic strength across all timeframes.
The breakout is also validated by Bollinger Band expansion, signaling volatility release.
Trend Direction: UPTREND | Volume Confirmation: Strong Institutional Activity
🧩 STWP Summary View:
Final Outlook:
Momentum: Strong | Trend: Bullish | Risk: High | Volume: High
Intellect Design Arena has transitioned into a confirmed bullish continuation phase with institutional footprints and multi-indicator confirmation.
Holding above ₹1,075 keeps the pattern valid for a potential rally toward ₹1,175–₹1,255 levels.
The setup remains technically clean, high-volume backed, and trend-aligned — favoring bullish bias continuation in the near term.
⚠️ Disclosure & Disclaimer – Please Read Carefully
The information shared here is meant purely for learning and awareness. It is not a buy or sell recommendation and should not be construed as investment advice.
I am not a SEBI-registered investment adviser, and this analysis is based on chart observations, technical patterns, and public data.
Trading involves risk; market movements can be sudden, and losses may exceed invested capital.
Past performance or setups do not guarantee future results.
Please evaluate your risk management and suitability before taking any trading decision.
Consult a SEBI-registered financial adviser before acting on any trade idea.
Position Status: No active position in (INTELLECT) at the time of analysis.
Data Source: TradingView & NSE India (Past Chart Reference).
💬 Found this useful?
🔼 Give this post a Boost to help more traders discover structured learning.
✍️ Drop your thoughts, queries, or setups in the comments — let’s grow together!
🔁 Share this with fellow traders and learners to promote structured analysis.
👉 “If you liked this breakdown, follow for more clean, disciplined setups with patience at the core.”
🚀 Stay Calm. Stay Clean. Trade With Patience.
Trade Smart | Learn Zones | Be Self-Reliant 📊
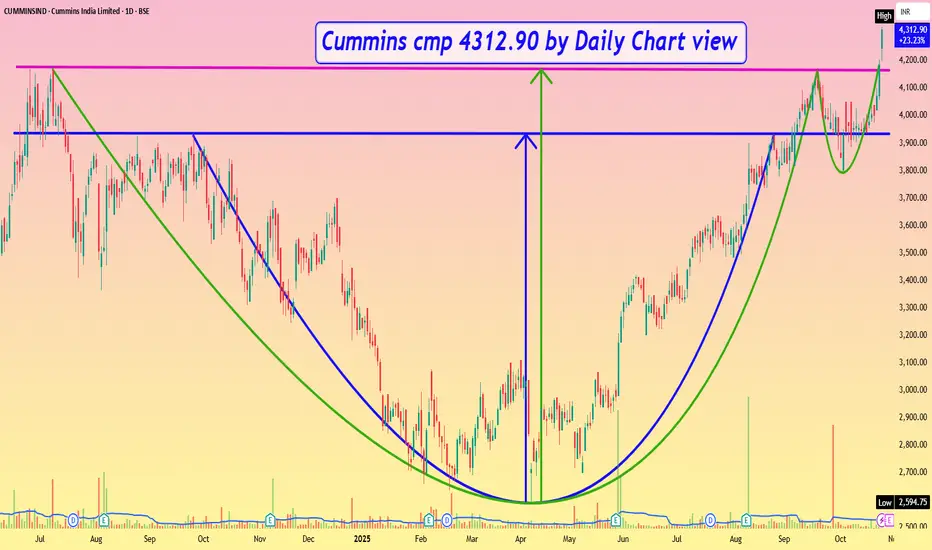
Cummins cmp 4312.90 by Daily Chart viewCummins cmp 4312.90 by Daily Chart view
- Support Zone 3900 to 4100 Price Band
- Only Resistance at ATH 4323.85 done today
- Very Strong Bullish Chart setup and Technical patterns made
- 1st Logical Target price level +/- 5250 by inner Rounding Bottom
- 2nd Logical Target price level +/- 5735 by broader Cup & Handle pattern
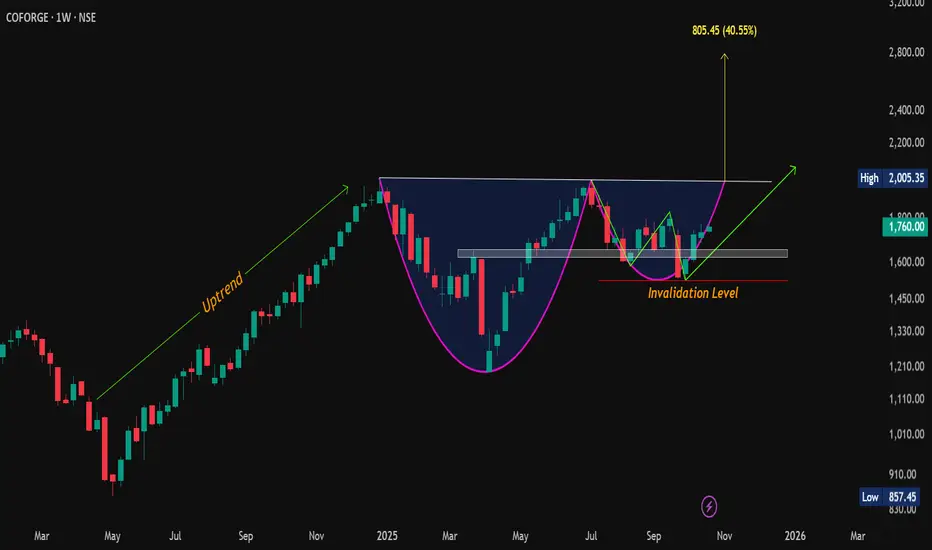
Pattern Inside a Pattern! Cup & Handle Meets the W on #Coforge💰 CMP: 1760
🎯 Cup & Handle Target: 2790 (~58% from cmp)
⚡️ W-Pattern Target: 2060
🧱 Supports: 1658-1622 / 1584
🚧 Resistances: 1795-1830 / 1950-2005
❌ Invalidation: Weekly Close Below 1525
📈 Bullish setup loading… watch for breakout above neckline!
#Coforge | #CupAndHandle | #WPattern | #ChartPatterns | #SwingTrading | #PriceAction | #BreakoutSetup
📌 Disclaimer: This analysis is shared for educational purposes only. It is not a buy/sell recommendation. Please do your own research before making any trading decisions.
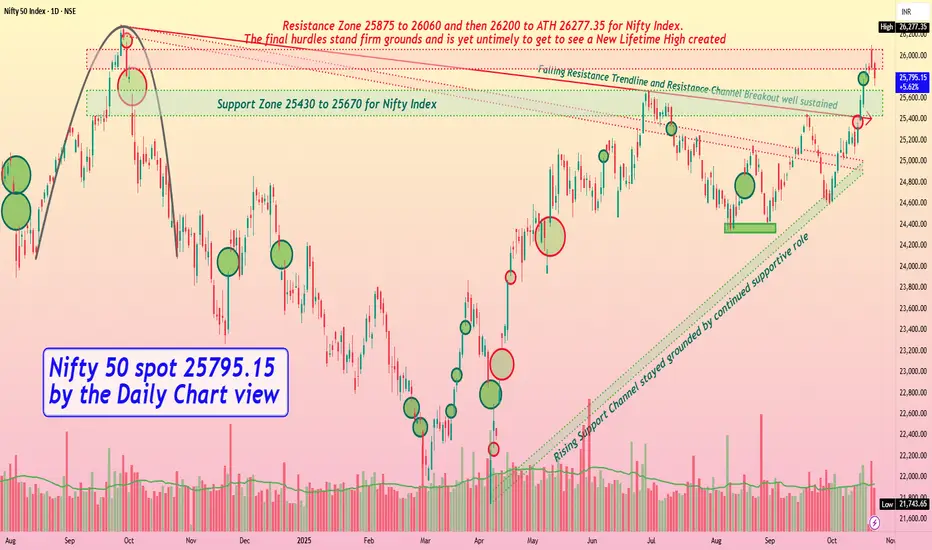
Nifty 50 spot 25795.15 by Daily Chart view - Weekly updateNifty 50 spot 25795.15 by Daily Chart view - Weekly update
- Support Zone 25430 to 25670 for Nifty Index
- Rising Support Channel stayed grounded by continued supportive role
- Falling Resistance Trendline and Resistance Channel Breakout well sustained
- Resistance Zone 25875 to 26060 and then 26200 to ATH 26277.35 for Nifty Index
- The final hurdles stand firm grounds and is yet untimely to get to see a New Lifetime High created
- Nifty Index earlier shied away to cross the 25K level and now acting likewise to breach the ATH 26277.35 mark
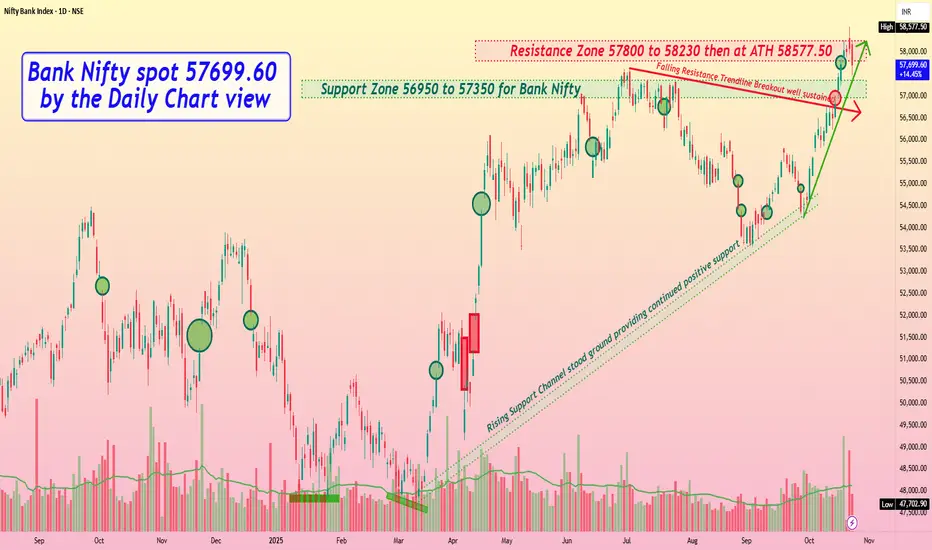
Bank Nifty spot 57699.60 by the Daily Chart view - Weekly updateBank Nifty spot 57699.60 by the Daily Chart view - Weekly update
- Support Zone 56950 to 57350 for Bank Nifty
- Resistance Zone 57800 to 58230 then at ATH 58577.50
- Falling Resistance Trendline Breakout has been well sustained
- Gap Up Opening of 16th October remains vacant, may need to be filled and closed off
- Rising Support Channel stood supportive ground and Rising Trendline seems in active mode
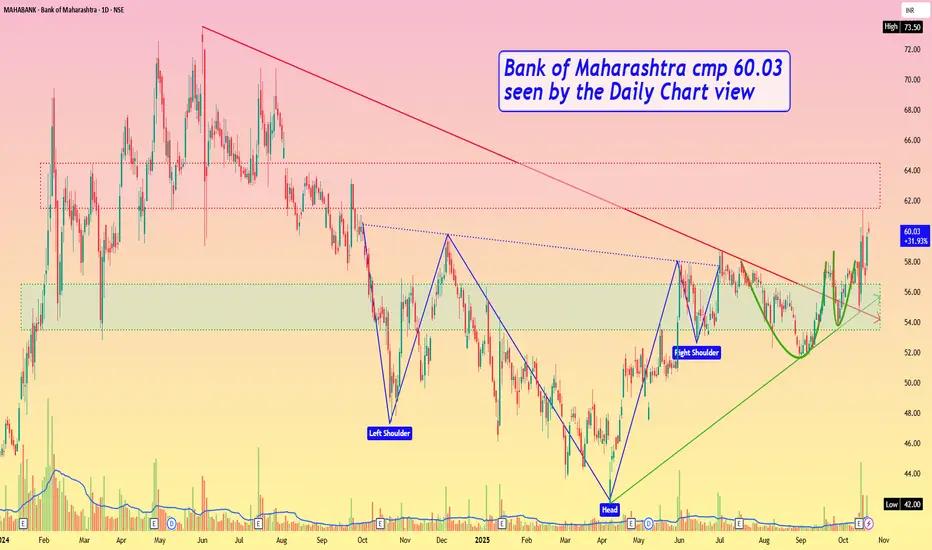
Bank of Maharashtra cmp 60.03 by Daily Chart viewBank of Maharashtra cmp 60.03 by Daily Chart view
- Support Zone 53.50 to 56.50 Price Band
- Resistance Zone 61.50 to 64.50 Price Band
- Bullish Head & Shoulders plus Rounding Bottoms around Support Zone
- Breakout from Falling Resistance Trendline and Rising Support Trendline maintained
- Volume are in close sync with avg traded quantity and spiking heavily over past few days
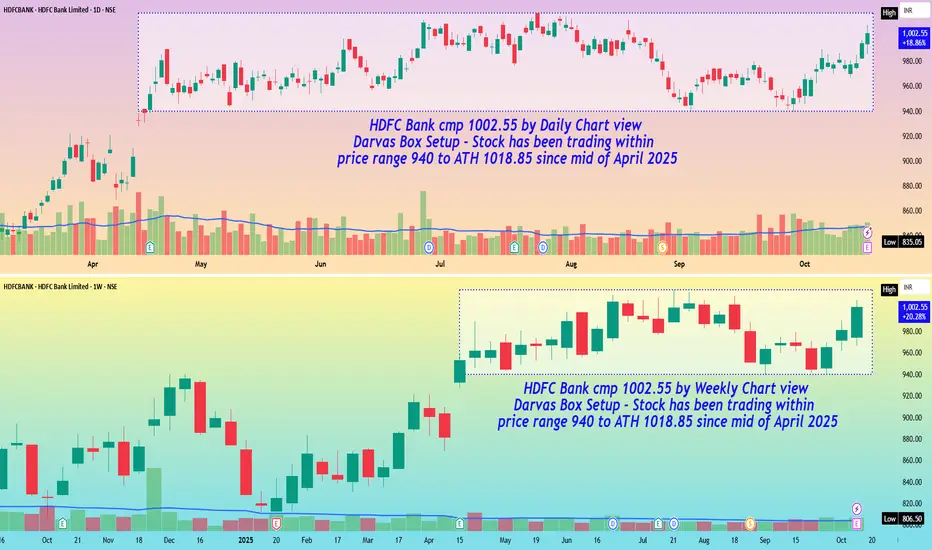
HDFC Bank cmp 1002.55 by Daily and Weekly Chart viewHDFC Bank cmp 1002.55 by Daily and Weekly Chart view
- Darvas Box Setup : Stock has been trading within price range 940 to ATH 1018.85 since mid of April 2025
- Stock chart has made Bullish Rounding Bottoms on both timeframes providing a technically logical upside target of +/- 1100 in the near future
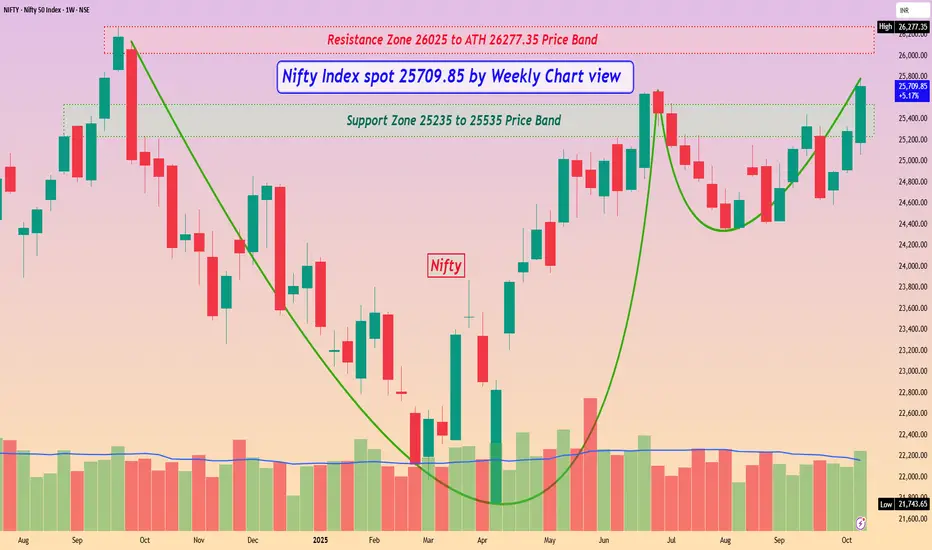
Nifty Index spot 25709.85 by Weekly Chart viewNifty Index spot 25709.85 by Weekly Chart view
- Support Zone 25235 to 25535 Price Band
- Resistance Zone 26025 to ATH 26277.35 Price Band
- Crystal Clear Bullish Cup & Handle formed around Support Zone
- Lets hope for the best to happen based on this Nifty 50 Index Chart setup
- Sharing this beautiful Nifty Index Chart setup, courtesy by a curious Co-Learners observation 😊👍🏽🤞🏽