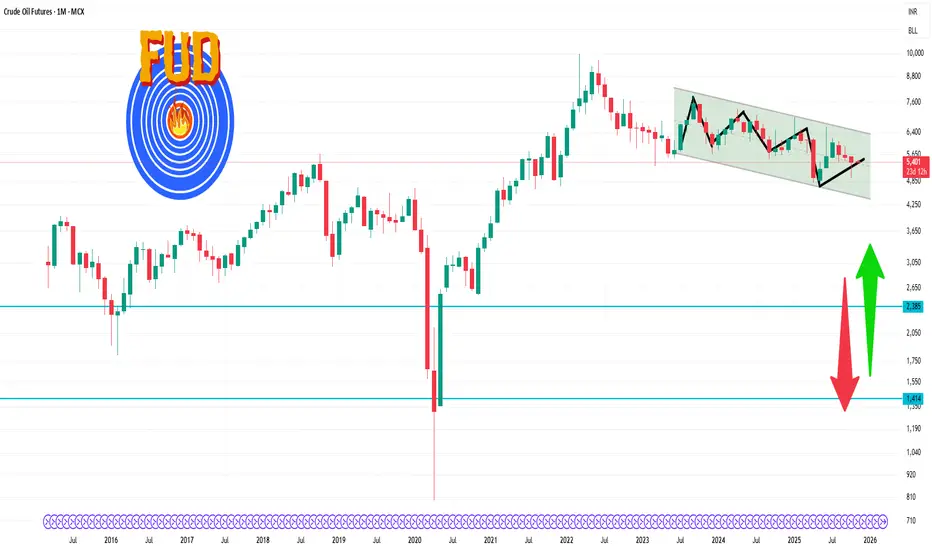
Crude Oil Futures 1 Month Time Frame 🔍 Current Price
Last quoted: ~ ₹ 5,422 per barrel.
Recent 1-month high: ~ ₹ 5,903
Recent 1-month low: ~ ₹ 4,944
Chartpattren
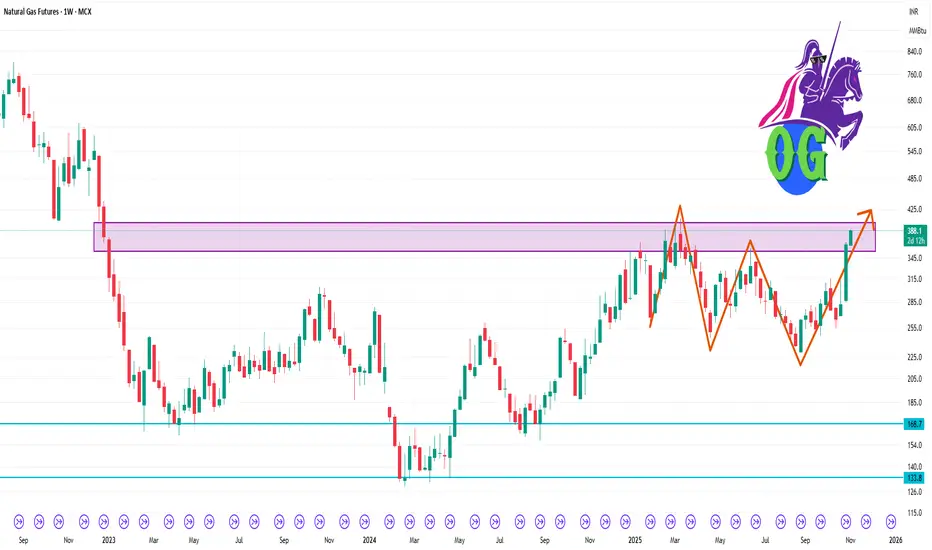
Natural Gas Futures 1 Week Time Frame 🎯 Key Levels
Support zone: ~ ₹ 270-285 per mmBtu — this appears to be a hinge demand zone based on recent pullbacks.
Intermediate support / pivot: ~ ₹ 295-310 — price has been oscillating near this zone.
Resistance zone: ~ ₹ 330-350 — breaking above this on a weekly close would shift structure more bullish.
Major breakout target: ~ ₹ 360-380 — if momentum carries, this zone becomes relevant for extension.
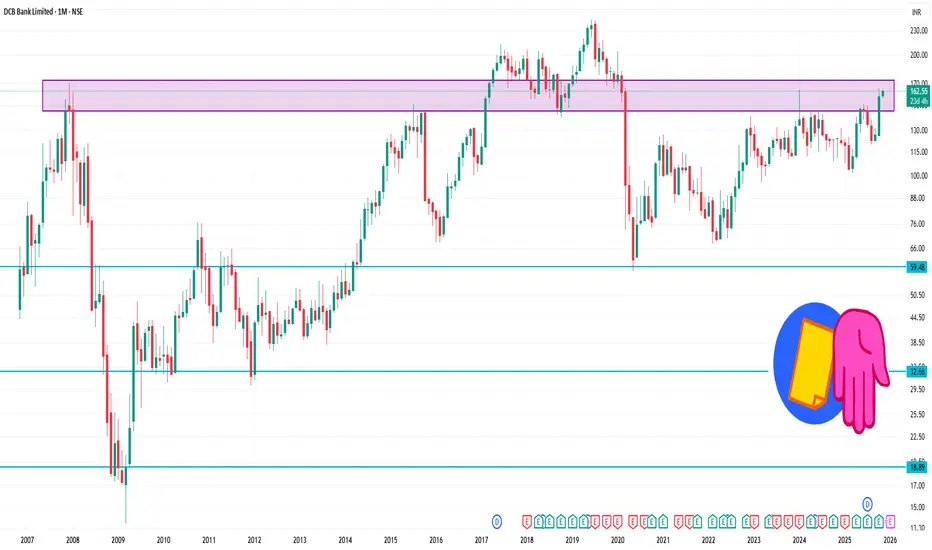
DCBBANK 1 Month Time Frame 🔑 Key Levels
Resistance zone: ~ ₹159–₹162. According to pivot/accumulated-volume data, the stock meets resistance around ₹158–₹161.
Support zone: ~ ₹144–₹150. The analysis mentions support at ~₹144.55 and next level further down ~₹126.45 if that breaks.
Longer-term support: ~ ₹129–₹135. Some medium/long‐term support levels are indicated in this range.
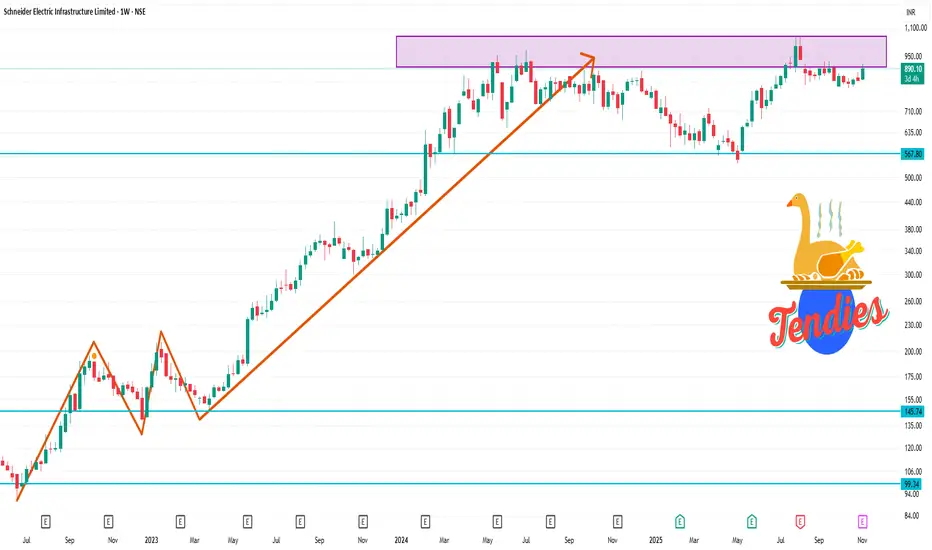
SCHNEIDER 1 Week Time Frame 📊 Current status
Last traded price: ~ ₹863 (shown on technical summary)
Technical rating (weekly timeframe): “Neutral” in many sources.
On shorter timeframes (daily), many indicators show bullish momentum.
🧮 Key support & resistance levels for the week
Based on available chart-analysis:
Support zone: around ₹810-₹830 region.
Resistance zone: around ₹900-₹915 region.
A pivot/resistance level near ~ ₹867-₹870 was noted for shorter term.
CANARA BANK BREAKOUTCANARA BANK
ADD ON YOUR WATCHLIST
If you see in the chart, the rounding pattern has broken out and it is in the weekly time frame
You can buy at Rs 125 and go up to the target of 146 and 163. The Stop-loss can be kept at 117.50
Note: Our posts are posted for learning purposes. You are responsible for any profit or loss you make from the advice given in the channel. Before investing in the stock market, you must consult your financial advisor.
WE ARE NOT A SEBI REGISTERED

CANARA BANK ROUNDDING PATERN BREAKOUTCANARA BANK ( W )
ADD ON YOUR WATCHLIST
If you see in the chart, the rounding pattern has broken out and it is in the weekly time frame
You can buy at Rs 125 and go up to the target of 146 and 163. The stop loss can be kept at 117.50
Note: Our posts are posted for learning purposes. You are responsible for any profit or loss you make from the advice given in the channel. Before investing in the stock market, you must consult your financial advisor.
WE ARE NOT A SEBI REGISTERED

Nifty 50 Daily, Trend Based Fibonacci Extension (Natural levels)Hey Traders, I hope you all are doing well in your life.
Market is nature's response and Price is the God.
Let's check the market with the help of natural levels tool : Trend Based Fibonacci Extension .
After forming a ' W ' pattern on Daily chart, Nifty50 has given a pull-back ( base for Fib-Extension level tool, 24587 ).
Most near level is the re-test of 38.2% level ( 24980 ), for a new UP trend ( investors ).
" Buy 🟢 " above 25110 with the stop loss 🔻 of 24980, for the
🎯 Target 1: 25402
🎯 Target 2: 25650
🎯 Target 3: 26260
🎯 Target 4: 26500.
" Sell 🔴 " below 24960 with the stop loss 🔺 of 25110, for the
🎯 Target 1: 24880
🎯 Target 2: 24780
🎯 Target 3: 24680
🎯 Target 4: 24500.
Smart Levels is Smart Trading. 👨🎓
⚠ RISK DISCLAIMER :
All content provided by "TradeWithKeshhav" is for information & educational purposes only.
It does not constitute any financial advice or a solicitation to buy or sell any securities of any type. All investments / trading involve risks. Past performance does not guarantee future results / returns.
Always do your own analysis before taking any trade.
Regards :
@TradeWithKeshhav & team
Happy Trading and Investing!

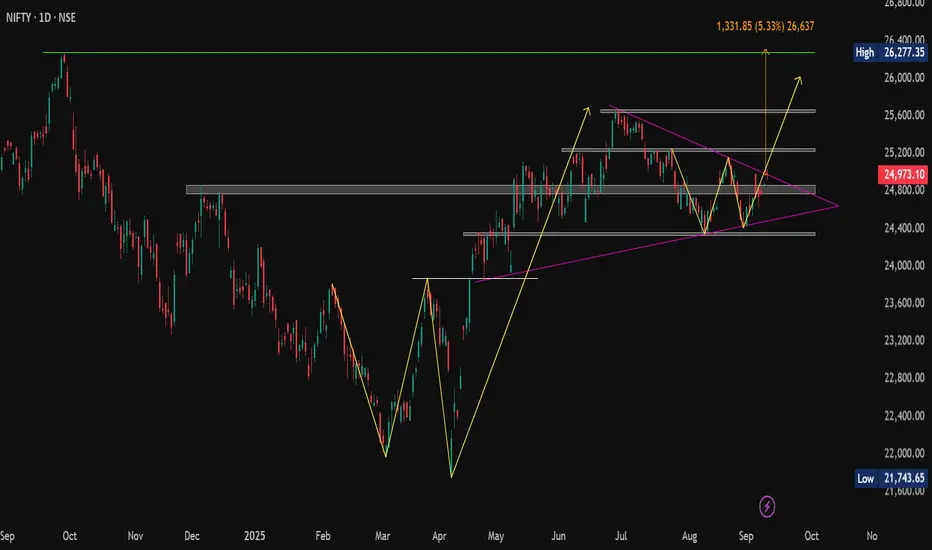
NIFTY: Ascending Triangle Breakout In PlayTechnical Outlook:
CMP: 24,973
📍 Immediate Support Zone: 24,858 – 24,768
📍 Strong Support Zone: 24,363 – 24,329
📍 Immediate Resistance Zone: 25,083 – 25,255 (Clustered zone)
📍 Strong Resistance Zones:
• 25,638 – 25,669
• 26,216 – 26,277 (All-Time High vicinity)
📈 Breakout Alerts:
✅ W-Pattern Breakout above 25,154 (Daily Candle Basis)
🎯 Target: 26,000
✅ Ascending Triangle Breakout above 24,972.50 ( Confirmed on Closing Basis today )
🎯 Target: 26,304 – aligning closely with the ATH of 26,277.35
Conclusion:
With two bullish patterns triggering nearly simultaneously, momentum is building. A sustained move above the immediate resistance cluster could fuel a rally towards uncharted territory.
Watch 25,154 and 25,255 – a clean move above could be the gateway to new all-time highs.
#BreakoutAlert | #TechnicalAnalysis | #ChartPatterns | #PriceAction
XAUUSD (GOLD) NEXT TARGET PRICE $4000 OR $2755 XAUUSD (GOLD) NEXT TARGET PRICE $4000 OR $2755 THE Real Commodity King Neal Bhai Forecast.

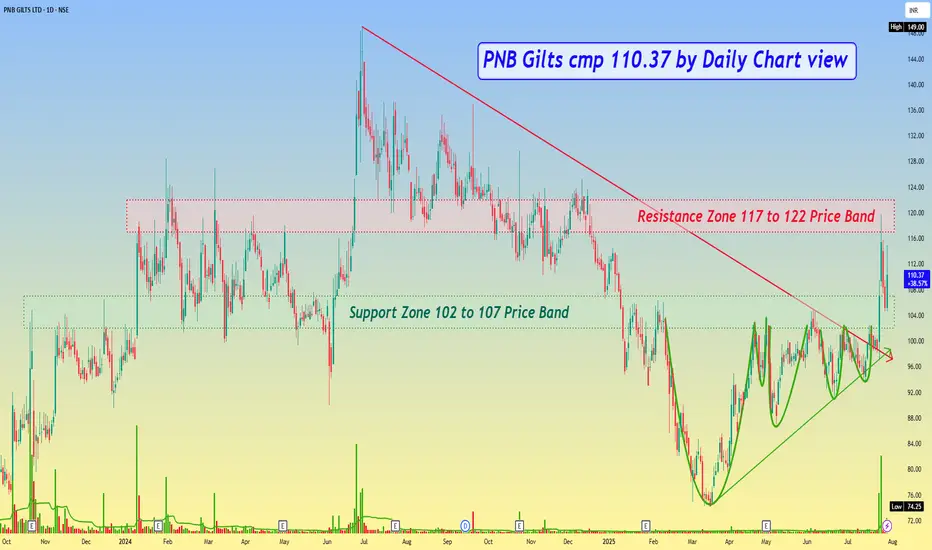
PNB Gilts cmp 110.37 by Daily Chart viewPNB Gilts cmp 110.37 by Daily Chart view
- Support Zone 102 to 107 Price Band
- Resistance Zone 117 to 122 Price Band
- Volumes are seen spiking heavily over past few days
- Support Zone is getting tested retested since last week
- Bullish Technical Chart indicates decent breakout probability
- Falling Resistance Trendline Breakout is seen to be well sustained
- Very closely considerate VCP pattern has formed below the Support Zone
- Majority Technical Indicators BB, EMA, SAR, MACD, RSI, SuperTrend trending positively
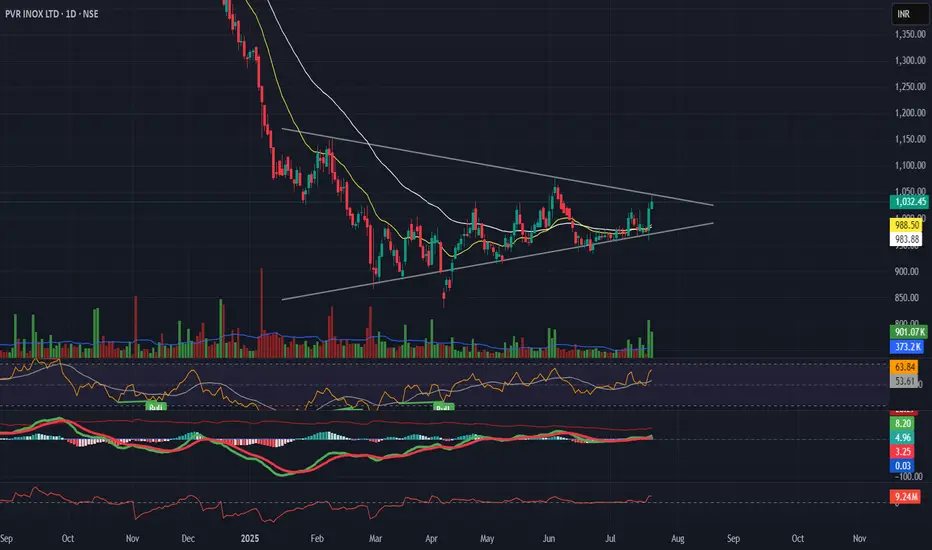
PVR INOX – Symmetrical Triangle Breakout | July 2025📊 PVR INOX – Symmetrical Triangle Breakout | July 2025
A potential breakout setup is forming on both the daily and weekly charts in PVR INOX:
🔹 Structure: Symmetrical triangle on both timeframes, showing price contraction near ₹1040
🔹 Momentum: RSI holding above 50, MACD turning positive
🔹 Volume Spike: Breakout supported by increasing volume
🔹 Sector Rotation: Media & Entertainment sector showing improving relative strength
🔹 Macro Narrative: Theme of rising screen expansion + easing inflation supports business growth
---
📌 Strategy Overview:
• Entry on breakout above ₹1040
• Target 1: ₹1080
• Target 2: ₹1126
• Stop-loss: ₹955 (below pattern support)
Timeframes Aligned:
Weekly: Structure intact with price near resistance
Daily: Ready for breakout
Hourly: Momentum building near apex
---
🧠 Conclusion:
A multi-timeframe setup with technical + narrative alignment. Watch for confirmation with strong candle + above-average volume.
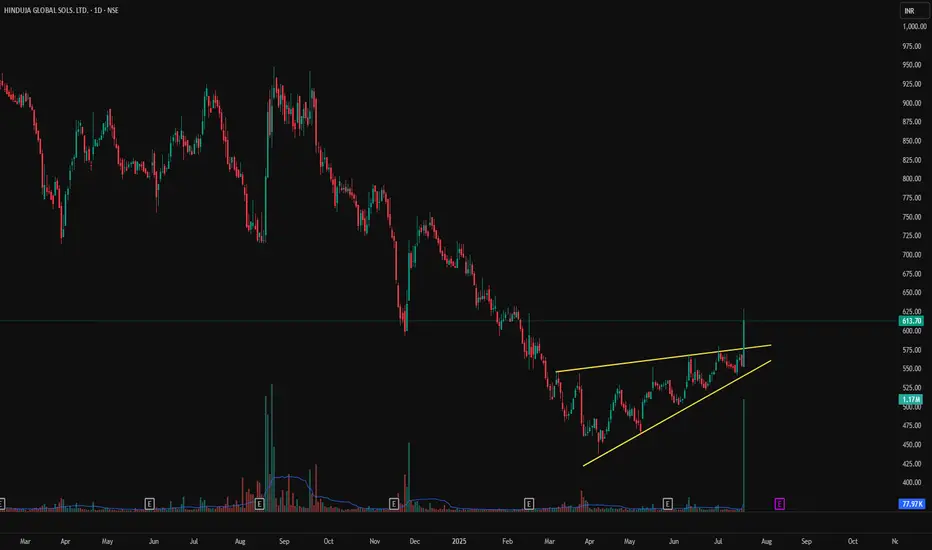
HGS - Rising Wedge Breakout on Volume Spike | Daily Chart📊 HGS – Rising Wedge Breakout on Volume Spike | RSI Above 70 | Fresh Bullish Momentum
📅 Chart Date: July 17, 2025
📍 CMP: ₹613.70 (+10.72%)
📈 Symbol: NSE:HGS | 1D Timeframe
🔍 Technical Analysis Breakdown
🔺 Rising Wedge Breakout
Price broke above the upper resistance of a rising wedge pattern.
Strong confirmation with a wide bullish candle and volume spike.
📊 Volume Surge
Volume: 1.17M against average volume of ~78K
Sudden institutional interest or news-based momentum likely behind the move.
📉 RSI (14, close): 73.03
RSI crossed into overbought territory, showing strong bullish momentum but could warrant caution or consolidation soon.
📌 Support & Resistance Levels
Breakout Zone: ₹580–₹590
Next Resistance: ₹650+ (gap-fill zone from earlier breakdown)
Support: ₹560 (upper trendline of broken wedge)
📌 Key Observations
First strong breakout since months of sideways to bullish accumulation.
Sustained close above ₹590–₹600 will confirm continuation.
Caution if price retraces inside wedge again.
🏁 Trade Setup
Entry: On Retest of ₹590–₹600
Target: ₹650 / ₹675
Stoploss: Below ₹560
Risk Level: Moderate (due to overbought RSI)
⚠️ Disclaimer: This is an educational chart setup and not trading advice. Please conduct your own research and risk management.
📣 Follow @PriceAction_Pulse for more such clean breakouts and chart pattern analysis!
🔁 Drop a comment if HGS is on your radar for the next breakout rally 📈
USD/JPY) LOGN TIME Analysis Read The captionSMC trading point update
Technical analysis of USD/JPY on the daily timeframe, highlighting a long-term downtrend reversal with potential for significant upside.
---
Analysis Summary
Pair: USD/JPY
Timeframe: Daily
Current Price: 147.442
Bias: Bullish breakout from a descending wedge structure.
---
Key Technical Insights
1. Descending Trendline Break:
Price has broken above the long-term downtrend line, signaling a reversal.
Breakout area is circled in yellow, confirming bullish intent.
2. Trendline & Structure Support:
Multiple rejections from the ascending support trendline (marked by green arrows) confirm accumulation and higher lows.
3. 200 EMA as Dynamic Resistance/Support:
Price is now above the 200 EMA (147.920) — a bullish signal, turning resistance into support.
4. RSI (14):
RSI at 62.99, approaching overbought territory, but still has room to push further.
---
Target Point
Target: 158.951
Based on measured move from wedge breakout and historical resistance level.
---
Trade Setup Idea
Direction Entry Stop-Loss Target
Buy 147.40–147.60 Below 145.80 158.95
Mr SMC Trading point
---
Summary
This chart signals a major bullish breakout on USD/JPY, with the break of a year-long downtrend structure, reclaiming the 200 EMA. If this breakout sustains, price could aim for 158.95 in the coming weeks.
Please support boost 🚀 this analysis)

ISLAMIC NEW YEAR OR RATHYATRA PICKTechnical View
Stock is clearly formed Cup&Handle pattern. Privious major SR Line break. Pattern made near major SR line. complete reversal formation.
RESPONIND
CMP 219
TARGET 250/275/300+++
BUY ON DIPS NEAR 200-204
SL 190( DAILY CLOSING BASIS)
Fundamental View
ROE and ROE BOTH ARE GOOD. Quaterly and Yearly boh Revenue and PAT are Highest Ever. positive cashflow..
I Am Not SEBI Registered Research Analyst. It Is Giving Only Educational Purpose. Buying in RESPONIND After Discussing With Your Financial Advisor.

MAXHEALTH - DTFMAXHEALTH is looking good.
It was facing resistance near 1180-1190 from last couple of months, and now gave Breakout of previous ATH too. Moving above 20-50ema.
From here there is probability of an upside move.
✅ If you like my analysis, please follow me as a token of appreciation :)
in.tradingview.com/u/SatpalS/
📌 For learning and educational purposes only, not a recommendation. Please consult your financial advisor before investing.

360 ONE – Bullish breakout360 ONE (NSE: 360ONE), a leading wealth and asset management firm in India, is showing strong bullish momentum backed by:
✅ Consistent Growth in AUM: The company continues to scale its assets under management with high-net-worth and ultra-HNI client acquisition.
✅ Strong Quarterly Results: Robust revenue growth and improving profit margins signal efficient operations and increased demand for wealth management services.
✅ Technically Sound Setup:
The stock has broken out from a key resistance zone with rising volumes.
Trading above all major EMAs (20/50/200), confirming a strong uptrend.
RSI is in bullish territory (>60), indicating momentum is intact.
✅ Sectoral Tailwind: The shift from traditional investments to managed wealth products is boosting firms like 360 ONE.
🟢 Price Action Suggests Further Upside
With growing investor confidence and institutional interest, the stock is poised for a potential 10–15% move in the near term, if it sustains above the breakout level.

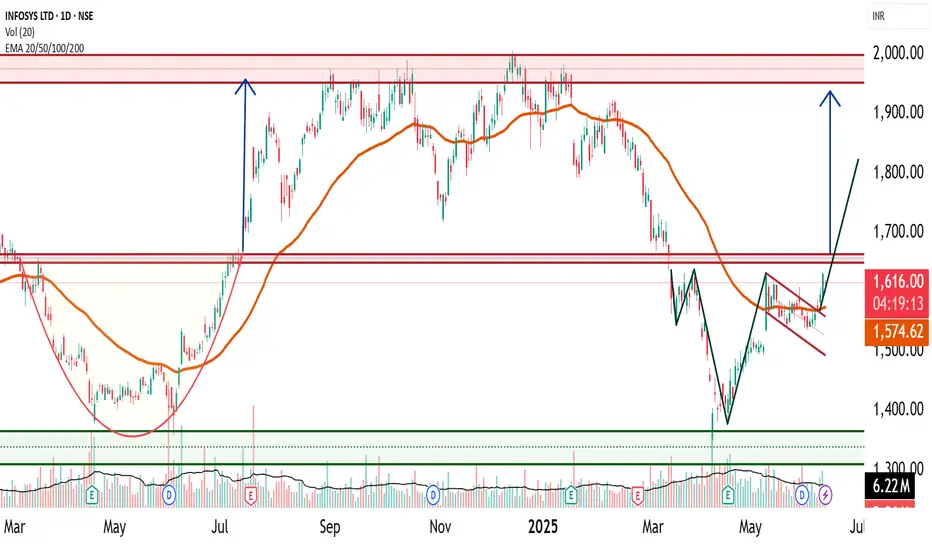
Infosys Technical Research- Flag and Head and shoulders🔍 1. Infosys Current Price Range and Key Levels
Since January 2021, Infosys has been trading in a broad range between ₹1300 and ₹2000, consolidating for over 4 years. Within this range, there are three key support and resistance levels to watch closely:
Support: ₹1300 (major floor)
Intermediate Resistance/Support Zone: ₹1600 – ₹1650
Strong Resistance: ₹2000 (upper bound)
📈 2. Bullish Flag Pattern: A Bullish Flag is a continuation pattern that forms after a strong upward price move "flagpole" , followed by a period of consolidation in a narrow downward or sideways channel "flag". It typically signals a pause before the uptrend resumes.
📊 2. Infosys Recent Technical Development
Infosys recently broke out of a bullish flag pattern and crossed above ₹1580 with a strong closing on higher volume, indicating renewed buying interest.
Price is currently trading above the 50-day Exponential Moving Average (EMA), confirming the continuation of the mid-term uptrend.
However, the zone around ₹1650 remains a strong and key resistance level to monitor closely.
🧩 3. Potential Bullish Head and Shoulders Pattern Above ₹1650
Should Infosys break decisively above ₹1650, it is likely to form another significant bullish pattern known as the Bullish Head and Shoulders (Inverse Head and Shoulders).
Bullish Head and Shoulders
This pattern signals a trend reversal from bearish to bullish and is considered highly reliable.
Trend: Appears after a downtrend or consolidation, signaling reversal
Touchpoints: Three lows – left shoulder, head (lowest point), and right shoulder, roughly at similar levels
Neckline: The resistance line connecting the highs between shoulders and head
Timeframe: Medium-term, often forming over weeks up to 6 months
Volume: Typically higher volume on left shoulder and head formation, volume dips on right shoulder, and surges on breakout
⚠️ 4. Key Concerns in Infosys Chart Pattern
Price-Volume Divergence: During the head formation, volume increased sharply as price fell — indicating strong selling pressure. However, volume was low when price approached the neckline — suggesting weak buying interest to confirm breakout. This divergence signals potential caution.
Resistance Zone: Price remains below the key resistance at ₹1650, which has acted as a ceiling multiple times. A decisive breakout is required to sustain further upside momentum.
⚠️ Disclaimer
This report is intended solely for educational and training purposes and does not constitute investment advice. Traders and investors should conduct their own research and consult financial advisors before making trading decisions.
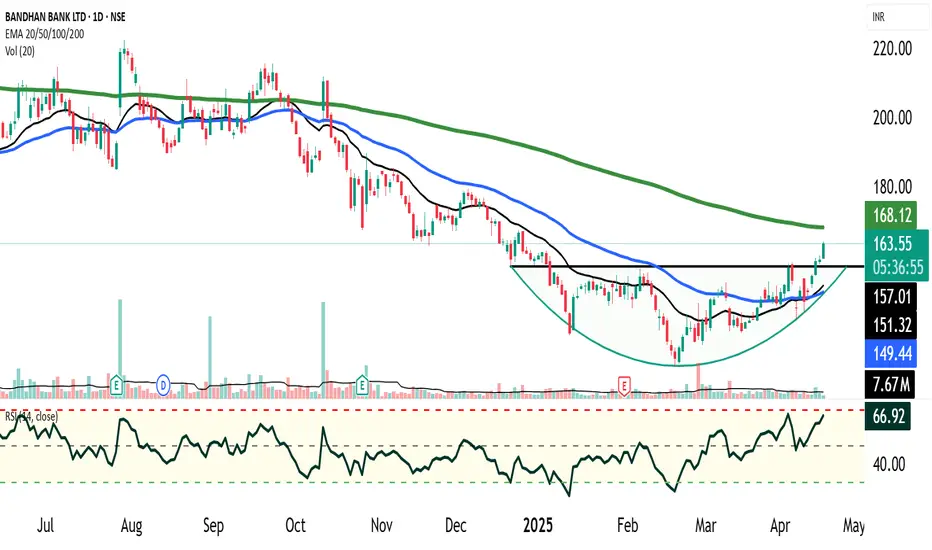
Bandhan Bank - Rounding Bottom Chart PatternBandhan Bank has recently formed a classic rounding bottom pattern after an extended long-term downtrend, indicating a potential shift in momentum from bearish to bullish. This basing structure suggests accumulation at lower levels and a possible trend reversal setup.
Pattern Activation: The rounding bottom pattern has triggered a breakout above the neckline resistance of ₹157, accompanied by a volume spike, confirming initial buyer interest and pattern validity.
Lack of Follow-Through Volume: Post-breakout, follow-through buying volume is missing, which raises caution. This could imply either a pause before further upside or an imminent retest of the breakout level around ₹157.
EMA Crossovers:
Bullish Crossover observed as the 20 EMA has crossed above the 50 EMA, suggesting improving short-to-medium term momentum.
However, price remains below the 200 EMA, signaling that the primary trend remains bearish. Sustained trading above the 200 EMA would be needed for confirmation of a longer-term trend reversal.
Risk Management & Strategy:
Cautious Optimism: While the breakout is promising, the stock remains under the long-term moving average and may face selling pressure at higher levels.
Retest Strategy: A pullback to ₹157 (neckline) could offer a low-risk entry point, especially if supported by bullish candlestick confirmation and renewed volume.
Staggered Investment Approach:
Do not park all your money in one go. : It is advised to invest in tranches, monitoring price action closely, especially near the 157–160 zone and at the 200 EMA level.
Conclusion:
Bandhan Bank is showing early signs of a technical base formation and potential trend reversal, but confirmation is pending due to lack of sustained volume and price being below the 200 EMA. The stock warrants close monitoring for a successful retest and possible breakout continuation. Investors should remain cautious, disciplined, and adopt a phased allocation strategy.
ADANIENT (Adani Enterprises)ADANIENT has been consolidating from a long time. After tapping at demand zone it started making higher high-higher lows formation and now at resistance level.
Breakout from here may give a really good move, keep eyes on it.
✅ If you like my analysis, please follow me as a token of appreciation :)
in.tradingview.com/u/SatpalS/
📌 For learning and educational purposes only, not a recommendation. Please consult your financial advisor before investing.

End of correction in Hinduja Global SolutionsElliott wave analysis:-
A long bear trend has been almost over and we may expect a slight fall from here or the Candle may rise to stars from here. if you wish to be cautious then wait for a pullback for almost 65% to 78%. keep the previous low as your stop loss go for a long ride.
i am not a SEBI registered advisor. Before taking a trade do your own analysis or consult a financial advisor. I share chart for education purpose only. I share my trade setup.

Long Correction is expected to take place in INDRAPRASATH GAS!Elliott Wave Analysis:-
In Correction wave a) wave took place and for retracement b) wave and still a little more correction was pending it seems to be. and the fall is expected from there.
i am not a SEBI registered advisor.
Before taking a trade do your own analysis or consult a financial advisor.
I share chart for education purpose only. I share my trade setup.

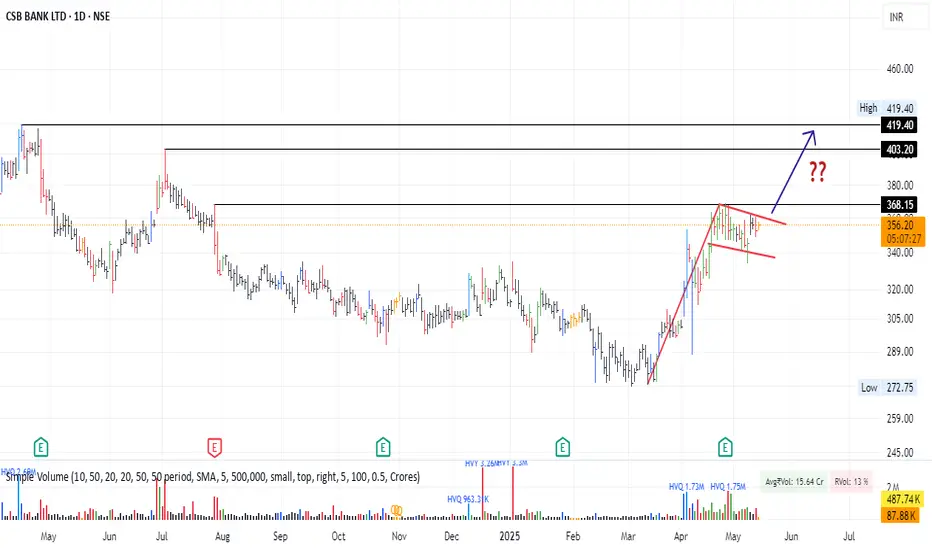
Is CSB Bank ready fo 420 and above levels ?? Looks like a good Flag Structure in making.. Stock moved a nice 20+% on decent volumes. now consolidating..
XAU/USD) Bullish trand line analysis Read The ChaptianSMC Trading point update
Technical analysis of Gold Spot (XAUUSD) on the 4-hour timeframe, featuring key support and resistance levels, price action projections, and RSI for momentum evaluation. Here's a breakdown of the idea:
Key Points in the Analysis:
1. Support & Resistance Zones:
Big Support / Buying Zone: Around 3,222 – 3,240. This zone has seen previous bullish reversals and is supported by the 200 EMA.
Intermediate Support Level: Around 3,270–3,290, where price might bounce before attempting a breakout.
Key Resistance Level: Around 3,350–3,365. Price must break this area to move toward higher targets.
2. Price Action Projections:
The analysis shows two bullish potential scenarios:
Scenario 1: Price breaks above the resistance level directly and moves toward the target point at 3,535.83.
Scenario 2: A retracement to the lower support or even the big buying zone before a bullish rally to the same target.
3. RSI (Relative Strength Index):
Currently near the neutral zone (around 49), suggesting there's room for movement in either direction.
No extreme overbought/oversold signals right now.
4. EMA (200):
The price is currently hovering above the 200 EMA (3,222.01), which acts as a long-term support and trend indicator.
Mr SMC Trading point
Summary of the Trading Idea:
Bias: Bullish
Entry Zones: Look for long entries at either the support level (3,270–3,290) or lower buying zone (around 3,222).
Target: 3,435.05 initially, then 3,535.83.
Invalidation: A clear breakdown below the 3,222 support level could invalidate the bullish bias.
Pelas support boost 🚀 analysis follow)
