GMDC 1 Day Time Frame from NSE data:
📊 Daily Pivot & Key Levels (1D Timeframe)
📌 Daily Pivot Point (PP): ₹606.73 – This is the central bias level. Above this suggests short-term bullish control; below may signal weakness.
💥 Resistance Levels (Upside)
R1: ₹627.46 – first major resistance above the pivot
R2: ₹640.38 – medium-term barrier
R3: ₹661.11 – stronger supply zone / higher target
🛡️ Support Levels (Downside)
S1: ₹593.81 – immediate daily support
S2: ₹573.08 – deeper pullback level
S3: ₹560.16 – stronger lower support area
✔ How to use these levels (Daily view):
📈 Bullish conditions:
If price sustains above Pivot (₹606.73) → bias turns bullish
Stronger breakout confirmation if price closes above R1/R2 with volume
📉 Bearish conditions:
If price breaks below S1 (₹593.81) → watch for next supports (S2/S3)
Failure at resistance zones can lead to pullbacks
💡 Summary Daily Chart Levels (1D)
Level Price (Approx)
R3 661
R2 640
R1 627
Pivot 606
S1 594
S2 573
S3 560
(Levels rounded for clarity)
Chartstructure

HAVELLS 1 Day Time Frame 📌 Current Market Snapshot (NSE)
• Current Price: ~₹1,345–₹1,352 range (intra‑day) — varies by source/data feeder 👆
📈 Daily Pivot & Key Levels (Daily Timeframe)
📊 Pivot Point Levels
Level Price (Approx)
🧮 Pivot (Daily) ₹1,270–₹1,275
🔼 Resistance 1 (R1) ₹1,287–₹1,291
🔼 Resistance 2 (R2) ₹1,301–₹1,305
🔼 Resistance 3 (R3) ₹1,316–₹1,318
🔽 Support 1 (S1) ₹1,259–₹1,265
🔽 Support 2 (S2) ₹1,243–₹1,245
🔽 Support 3 (S3) ₹1,230–₹1,232
(Classic pivot daily levels)
📊 Alternative Daily Support / Resistance Levels (Trendlyne / Research360)
✔ Pivot: ~ ₹1,324–₹1,325
✔ Support Levels:
• S1: ~ ₹1,294–₹1,294
• S2: ~ ₹1,276–₹1,276
• S3: ~ ₹1,245–₹1,246
✔ Resistance Levels:
• R1: ~ ₹1,342–₹1,343
• R2: ~ ₹1,373–₹1,373
• R3: ~ ₹1,391–₹1,391**
🔍 Short‑Term Daily Reference (Intraday Pivot)
From intraday pivot analysis (updated today):
• Central Pivot (CPR): ~ ₹1,319–₹1,320
• Daily R1: ~ ₹1,333–₹1,334
• Daily R2: ~ ₹1,349–₹1,350
• Daily R3: ~ ₹1,363–₹1,363
• Daily S1: ~ ₹1,290–₹1,291
• Daily S2: ~ ₹1,289–₹1,289
• Daily S3: ~ ₹1,303–₹1,303
(based on multiple pivot calculation methods including Standard & Camarilla)
📌 How to Use These Levels Today
Bullish scenario:
✅ Holding above Pivot / CPR (~₹1,270–₹1,324) → bias to R1 → R2 → R3 zones.
Bearish scenario:
❌ Break below S1/S2 (~₹1,259 / ₹1,243) → weakness toward S3.
Short traders often watch CPR for pullbacks and reversals within the day.

IIFL 1 Day Time Frame 📊 Daily Pivot & Key Levels (1‑Day Timeframe)
📍 Daily Pivot:
• ₹520.28 (reference level for bias)
📈 Resistance Levels:
• R1: ₹532.57 — first upside hurdle
• R2: ₹543.28 — next barrier above
• R3: ₹555.57 — extended resistance zone
📉 Support Levels:
• S1: ₹509.57 — immediate support
• S2: ₹497.28 — next support zone
• S3: ₹486.57 — deeper support below
📌 How to Use These Levels Today
📈 Bullish view:
Break above ₹532.5 – ₹543.3 can open room toward ₹555+ for the day.
📉 Bearish view:
If price drops below ₹509.5, sellers could push toward ₹497 and then ₹486.5.
🟡 Pivot reaction:
Holding above the pivot ₹520.28 suggests bias toward upside today.
Falling below pivot suggests weakness intraday.
🔍 Note on Current Price Trend
Some data (delayed) shows moving averages and indicators near oversold, but pivot levels remain useful for intraday decisions.

OIL 1 Day Time Frame 📊 Current Approx Price (as per today data): ₹488.90 – ₹514.4 range (varies by platform/time) — OIL has recently traded around this area near daily pivot/major levels.
📈 Daily Pivot & Key Levels (Classic method)
Level Price (₹) Role
R3 (3rd Resistance) 507.45 Strong upside hurdle
R2 499.40 Secondary resistance
R1 491.35 Near-term resistance
Daily Pivot 483.30 Trend bias line
S1 (1st Support) 475.25 Immediate support
S2 467.20 Next downside cushion
S3 459.15 Major support zone
👉 Interpretation (1-day frame):
Price above pivot (~483-484) = bullish bias on the daily.
Near-term resistance cluster: ₹491–₹499–₹507 — watch breakout closes above these for continuation.
Downside support cluster: ₹475 → ₹467 → ₹459 — breakdown below these suggests short-term correction.
📊 Short Summary (Daily Momentum & Indicators)
Technical bias:
• RSI near bullish/neutral zone — showing positive momentum without being extremely overbought.
• MACD / ADX generally leaning bullish indicating trend strength at the moment.
Overall daily structure favors bullish to sideways — supports holding and resistance being tested.
🧠 How to use these levels (Daily)
📍 Bullish setup:
• If price stays above pivot ~483 and holds above R1 (~491) → next target R2 ~499 → R3 ~507.
📍 Bearish setup:
• If price falls below pivot ~483 and breaks S1 (~475) → move down to S2 (467) & potentially S3 (459).
📍 Key breakouts:
• Clear daily close above 507 → strong bull confirmation.
• Close below 459 → negates short-term bull view.

KAYNES 1 Week View 📌 Current Price Context
• Latest traded price around ₹3,640–₹3,720 on NSE (live varies by exchange and time) — showing recent rebound after volatility.
📈 Weekly Pivot & Support/Resistance Levels (1-Week Timeframe)
📍 Weekly Pivot Reference
• Weekly Pivot Point (central level): ~₹3,702 (midpoint guiding sentiment)
🔼 Weekly Resistance Levels (Upside)
• R1: ~₹3,734 – ₹3,745
• R2: ~₹3,760 – ₹3,770
• R3: ~₹3,790 – ₹3,880
🔽 Weekly Support Levels (Downside)
• S1: ~₹3,675 – ₹3,678
• S2: ~₹3,640 – ₹3,635
• S3: ~₹3,280 – ₹3,280+ (broader deeper support zone)
📊 How Traders Interpret These Weekly Levels
Bullish Signals (Weekly Close Above)
✅ A weekly close above R1 (~₹3,740+) supports continuation of near-term recovery.
➡ Next upside targets become R2 (~₹3,760–₹3,770) and then R3 (~₹3,790–₹3,880) as next resistance layers.
Bearish Signals (Weekly Break Below)
⚠ Break and weekly close below S1 (~₹3,675) increases risk of deeper weakness, with S2 (~₹3,635) and S3 (~₹3,280) as key downside floors.
Neutral/Range Scenario
↔ If price holds between S1–R1 (~₹3,675–₹3,745), expect sideways/consolidation before a clear breakout direction takes shape.
📌 Key Notes on Trend & Structure
• Price is below longer historical mid/long-term averages, reflecting a wider downtrend from prior highs, but short-term technicals show stabilization and bounce risk.
• Recent volatility (big swings) suggests support/resistance zones matter more than trend at the moment — breakouts through these weekly levels tend to signal next directional move.
🧠 Practical Weekly Trade Levels
Level Type Approx Zone
Weekly Pivot ~₹3,702
Resistance R1 ~₹3,734–₹3,745
Resistance R2 ~₹3,760–₹3,770
Resistance R3 ~₹3,790–₹3,880
Support S1 ~₹3,675–₹3,678
Support S2 ~₹3,635–₹3,640
Support S3 ~₹3,280+
🧾 Quick Takeaway
Bullish weekly bias if price closes above ₹3,740–₹3,760 with momentum.
Bearish pressure remains if weekly closes below ₹3,675–₹3,640.
Range trade likely between those pivot bands until directional breakout occurs.

ASIANPAINT 1 Day Time Frame 📊 Current Price (approx): ₹2,402 – ₹2,410 (NSE intraday/daily) as of latest market data.
🔁 Daily Pivot Levels
Pivot (central reference): ~₹2,379–₹2,380
Resistance Levels:
• R1: ~₹2,416–₹2,417
• R2: ~₹2,475–₹2,476
• R3: ~₹2,512–₹2,513
Support Levels:
• S1: ~₹2,320–₹2,321
• S2: ~₹2,283–₹2,284
• S3: ~₹2,224–₹2,225
(from classic daily pivot structure)
📈 How to Use These Levels (Daily Basis)
Bullish scenario (if buyers strong):
Sustained break above R1 (~₹2,416) targets R2 (~₹2,475) & then R3 (~₹2,512).
Neutral / sideways zone:
Price hovering between Pivot (~₹2,380) and R1 (~₹2,416) suggests range‑bound moves.
Bearish scenario (if selling pressure):
Break below S1 (~₹2,320) can open path towards S2 (~₹2,283) and then S3 (~₹2,224).
📌 Short‑Term Technical Snapshot
Asian Paints price action has been under pressure recently as technical indicators show muted momentum and the stock trading below several moving averages (20‑day/50‑day) reflecting short‑term neutral to weak bias.
Always combine pivot levels with volume and price action signals (e.g., breakouts with confirmation) for better trade decisions.

JAMNAAUTO 1 Day Time Frame • Last close: ~₹124 – ₹124.36 on NSE/BSE.
• Recent daily range: Low ~₹116.60 – High ~₹126.55.
📊 Daily Support & Resistance Levels (Key Zones)
Pivot Point (Daily)
Daily Pivot ~ ₹120 – ₹123.55: Key reference for intraday bias — above is bullish, below is bearish.
Resistance Levels
R1: ~ ₹125–₹125.32 – first hurdle above pivot.
R2: ~ ₹128–₹128.38 – stronger resistance near recent swing highs.
R3: ~ ₹130–₹130.15 – extended upside pivot.
Support Levels
S1: ~ ₹120 – ₹120.49 – first support near pivot/MA levels.
S2: ~ ₹118.5 – ₹118.72 – next layer of downside support.
S3: ~ ₹115.5 – ₹115.66 – deeper support zone.
These pivot-derived levels are commonly used for intraday and next-day trading reference.
📈 What Technical Indicators Suggest (Daily)
Moving Averages / Momentum
Short-term MAs around 20–50 DMA are near the pivot zone, indicating mixed momentum around the current price.
On some technical panels, oscillators like RSI may be neutral or slightly bearish/bullish depending on the source — indicating no strong momentum bias right now.
🧠 How to Use This for a 1-Day View
Bullish Bias (short-term) if:
✔ Price sustains above daily pivot (~₹122–123)
✔ Break of R2 (~₹128–₹128.4) with volume
Bearish / Caution if:
❌ Price closes below S1 (~₹120)
❌ Momentum indicators turn down from resistance
⚠️ Risk & Notes
These levels are technical guides — not investment advice.
Price can gap on news earnings, market sentiment, or sector moves.
Always combine with your own risk management (stop-loss, position sizing).

HINDZINC 1 Month Time Frame 📍 Current Price Snapshot (latest close / recent trade)
HINDZINC is trading around ~₹628–₹630 on NSE/BSE — after some volatility in recent sessions. Its 52‑week high is ~₹733 and 52‑week low ~₹378.15, showing wide longer‑term movement.
🛠 1‑Month Technical Levels (Support & Resistance)
These are the key zones traders watch for a 1‑month period based on pivot analysis and recent price action:
🔼 Resistance Levels (Upside Targets)
1. ₹705 – ₹715: Immediate resistance zone around recent highs and pivot R1/R2 cluster.
2. ₹735 – ₹750: Next major supply/resistance area — crossing this would signal stronger upside continuation.
3. ₹760 – ₹780+: Extended breakout zone if sentiment turns sharply bullish (higher targets from pivot extensions).
📌 Overall, ₹705–₹715 is the near‑term hurdle the stock needs to clear for a bullish run.
🔽 Support Levels (Downside Price Floors)
1. ₹690 – ₹700: First strong support near recent consolidation lows/pivot S1.
2. ₹670 – ₹680: Secondary support — a deeper pullback zone.
3. ₹650 – ₹660: Key base area — breakdown below this can signal more downside pressure.
4. ₹620 – ₹630: Major structural support if broad market or metals weakness intensifies.
📌 The ₹670–₹700 band acts as the core support area this month.
⚠️ Quick Summary
✔ Above ₹705–₹715 = bullish continuation likely.
✔ Between ₹670–₹700 = consolidation zone.
✔ Below ₹650 = risk of deeper retracement.

INDIANB 1 Month Time Frame 📌 Current Price Context (as of latest trading)
Indian Bank is trading near ₹910–₹920 levels on NSE.
📈 1‑Month Key Resistance Levels (Upside)
These are the levels where price may face selling pressure or reversal if bulls weaken:
R1 — ₹918–₹920 — immediate resistance area just above current trade.
R2 — ₹927–₹930 — secondary resistance zone.
R3 — ₹935–₹940 — further upside resistance zone for continuation moves.
Summary: Immediate upside capped around ~₹918–₹930. Break and close above this band can signal stronger bullish continuation.
📉 1‑Month Key Support Levels (Downside)
Important levels that can act as rebound zones on pullbacks:
S1 — ~₹880–₹885 — first meaningful support near recent swing lows.
S2 — ~₹860–₹865 — secondary support from broader short‑term structure.
S3 — ~₹830–₹835 — major zone where bigger trend buyers may step in.
Summary: Minor supports start ~₹880, stronger support cluster around ~₹860‑₹835.
📊 Pivot / Neutral Reference
Pivot around ~₹907–₹910 — current central reference area.
Price above pivot suggests bullish bias, below could tilt neutral to bearish within the month.
📌 Interpretation For 1‑Month View
Bullish scenario:
Holds above ₹900–₹910 pivot → targeting ₹927–₹940 zone.
Neutral / consolidation:
Trading between ₹880–₹910.
Bearish risk:
Break below ₹860–₹845 could open deeper correction toward ₹830.

TDPOWERSYS 1 Day Time Frame 📊 Live/Intraday Summary (Today’s Trading)
• Current price: ~₹735 – ₹745* (showing a strong upside on the day).
• Day’s high: ₹767.95.
• Day’s low: ₹642.30.
• Previous close: ₹676.90.
• Range (1‑day): ₹642.30 – ₹767.95.
• Volume: Several million shares traded (indicating active intraday participation).
• Circuit limits: Upper ₹812.25 / Lower ₹541.55.
📈 Intraday Price Behavior (1‑Day Chart Insight)
Although I can’t draw the live chart, major market data sources show the stock rising significantly above its previous close, with intraday volatility spanning over ₹125+, suggesting strong buying interest today.
🔎 What this means for your 1‑day view
The stock opened lower near ₹661 and trended up strongly, testing higher intraday levels toward ₹767+ — a bullish intraday range.
Today’s range and levels are useful for intraday support/resistance as:
• Support: ~₹640 – ₹660 (earlier day lows).
• Resistance: ~₹760 – ₹770 (near today’s high).
⚠️ Notes
• Market prices intraday change rapidly — data above reflects the latest available snapshot for today’s session.
• If you’re planning trades, check real‑time charts from your broker or a live market platform (e.g., NSE/BSE or charting tools like Chartink).

IDEA 1 Day Time Frame📈 Current Snapshot (Daily)
📍 Approx Price Range Today: ₹10.00 – ₹11.00 per share (indicating recent heavy trading and a bounce)
📍 RSI (Daily): ~38.5 – showing slightly weak momentum but not deeply oversold yet
📍 50 / 100 / 200 DMA: ~₹10.58 / ₹9.94 / ₹9.34 – price around these averages suggests mixed consolidation near crucial pivot zones
🔑 1-Day Key Levels (Pivots)
✔ Pivot Point
Pivot: ~ ₹9.98 → Daily balance point (trend bias flips above / below)
🟢 Support Levels
S1: ~ ₹9.75 → 1st immediate support
S2: ~ ₹9.46 → secondary support zone
S3: ~ ₹9.23 → lower daily support
👉 Below ₹9.23 — increased bearish risk on intraday breakdown.
🔴 Resistance Levels
R1: ~ ₹10.27 → first resistance
R2: ~ ₹10.50 → near daily average resistance
R3: ~ ₹10.79 – ₹11.00 → stronger daily resistance & psychological level
👉 Sustained move above ~₹10.50-₹10.80 can shift short-term bias toward recovery.
📌 Important Context (Market News)
Today’s market action showed a strong positive catalyst: Vodafone Idea shares surged ~13% to ~₹11.36 on Jan 30 2026 after management revealed a large turnaround plan including ₹45,000 cr capex strategy and AGR relief news — indicating significant bullish sentiment shift.
Recent fundamentals: Q3 loss narrowed and ARPU increased, which supports sentiment.
These news catalysts can influence price reaction at key technical levels, so combine them with the pivot levels above for better context.

IOC 1 Day time Frame 📊 Current Daily Price (Live / Latest)
Current price: ~₹162.8 – ₹163.8 (NSE) on 29 Jan 2026 during the session.
Today’s range so far: Low ~₹161.7, High ~₹164.6.
📈 Key Daily Levels (Support & Resistance)
📌 Immediate Support
S1: ~₹161.0 – ₹161.8 — today’s low region.
S2: ~₹158.6 – ₹159.0 — short‑term near support zone.
S3: ~₹156 – ₹157 — broader support if prices weaken further.
📌 Pivot / Neutral Zon
Pivot level: around ₹161.8 – ₹162.5 — inside today’s trading range.
📌 Immediate Resistance
R1: ~₹164 – ₹165 — today’s high zone.
R2: ~₹167 – ₹168 — next upside resistance cluster.
R3: ~₹170 – ₹170+] — stronger breakout region above recent swings.
📌 How to Use These Levels Today
Bullish scenario:
A clean break above ₹164–₹165 on strong volume could open the way toward ₹167–₹168+.
Bearish scenario:
A drop below ₹161 and especially below ₹158–₹159 could lead to deeper testing of ₹156–₹155 support.

ECLERX 1 Day Time Frame 📍 Current Price Snapshot (Daily)
As of the latest available trading data:
• ECLERX daily price: ~₹4,710–₹4,740 region (intraday update) — fluctuating with bullish momentum near recent highs.
📊 Daily Technical Levels (Key Support & Resistance)
Classic Pivot Levels (Daily)
Based on recent pivot calculations from multiple technical sources:
Resistance
R3: ~₹4,748
R2: ~₹4,710–₹4,687
R1: ~₹4,626–₹4,649
Pivot Point: ~₹4,649
Support
S1: ~₹4,588–₹4,588
S2: ~₹4,561–₹4,611
S3: ~₹4,565 and lower
(values approximate based on classic & fibonacci pivot methods)
Simplified pivot zone (short)
Resistance Zone: ~₹4,710–₹4,750
Support Zone: ~₹4,560–₹4,590
Major pivot: ~₹4,648 (neutral decision level)
Additional Support / Resistance Levels (Alternate Sources)
From trendlyne / pivot screens:
• First Resistance: ~₹4,386–₹4,451
• Second Resistance: ~₹4,550–₹4,555
• Third Resistance: ~₹4,621–₹4,622
• Support Zones: ~₹4,254–₹4,215 and deeper ~₹4,161–₹4,111 if broader pullbacks occur.
👉 These can be useful as secondary trigger levels if price action tests below pivot or breaks above immediate resistance.
📌 How to Use These Levels Today
Bullish bias
➡ A daily close above ₹4,710–₹4,750 resistance cluster suggests continuation toward recent highs (potential next zone in higher time frames).
Bearish/Correction risk
➡ Weak price action below ₹4,590–₹4,560 support on the daily can expose the next support band around ₹4,500–₹4,450.
Key pivot confirmation
➡ The central range around ₹4,640–₹4,650 serves as a daily pivot — sustained trading above supports bullish control, below introduces caution.

STARHEALTH 1 Week Time Frame 📊 Weekly Price Range (1‑Week History)
High (last week): ~₹469.8
Low (last week): ~₹442.45
(Source: Marketscreener weekly price extremes)
📌 Key Weekly Support Levels
Support zones you may watch on the weekly timeframe:
1. Support 1: ~₹440–₹442 (recent weekly low)
2. Support 2: ~₹430 area (round‑number psychological / pivot cluster)
3. Support 3: ~₹408–₹415 range (broader structural support from pivot supports seen on shorter pivots)
Weakness below ₹430 could open the lower band towards ₹405–₹410.
📌 Key Weekly Resistance Levels
Potential weekly resistance zones to monitor:
1. Resistance 1: ~₹470–₹472 (recent weekly highs & EMA cluster)
2. Resistance 2: ~₹480–₹485 (psychological and medium MA area)
3. Resistance 3: ~₹495+ (upper pivot / longer‑term range top)
A weekly close above ₹480–₹485 would indicate stronger upside pressure.
📈 Technical Indicator Context (Weekly)
RSI and weekly momentum indicators on some platforms suggest neutral‑to‑slightly bullish conditions rather than extreme overbought levels.
Weekly pivot and moving average positions (when available) confirm ₹462–₹470 as an important zone for bullish continuation.

TVSMOTOR 1 Day Time Frame 📊 Current Approx Price Range (recent trading): ~₹3,525 – ₹3,560 area according to community chart insights.
🔑 1‑Day Timeframe — Key Levels
📈 Resistance Levels (Upside Targets)
₹3,550 – ₹3,560: near‑term resistance zone — a breakout above this may indicate bullish continuation.
₹3,600: psychological resistance.
₹3,640 – ₹3,650: stronger resistance above.
📉 Support Levels (Downside)
₹3,510 – ₹3,520: immediate support zone — watches trade reaction here intraday.
₹3,480 – ₹3,490: short‑term support below.
₹3,400 – ₹3,450: deeper support zone if weakness extends.
📌 Intraday & Pivot‑style Levels
Some classic pivot/levels from historical pivot calculations (may be slightly outdated but useful as reference):
R1 ~ ₹3,594, R2 ~ ₹3,622, R3 ~ ₹3,647 (classic pivot levels).
S1 ~ ₹3,541, S2 ~ ₹3,516, S3 ~ ₹3,488 (support pivots).
📊 How to Interpret These Levels
Bullish scenario: Maintaining above ₹3,520‑₹3,530 and breaking above ₹3,560‑₹3,600 could signal continuation higher.
Bearish scenario: Failure to hold ₹3,510 and drop below ₹3,480 may increase downside risk toward ₹3,400‑₹3,450.

KALYANKJIL 1 Week Time Frame 📌 Current Price Snapshot (Weekly Context)
₹~391–396 — the stock is trading near its 52‑week low range after heavy selling pressure.
NSE/BSE trend is bearish on weekly charts (sell signals and down momentum).
📊 1‑Week Time Frame – Pivot & Key Levels
📉 Weekly Pivot & Levels (from pivot analysis)
(These are derived from weekly pivot point calculations, representing expected turning points for the week)
📌 Weekly Pivot:
Pivot: ~₹479.12
👊 Weekly Resistances:
R1: ~₹495.23
R2: ~₹522.97
R3: ~₹539.08
🛑 Weekly Supports:
S1: ~₹451.38
S2: ~₹435.27
S3: ~₹407.53
👉 The current market price (~₹392–396) is below the first major weekly support (~₹451) and closer to the third weekly support at ~₹407.5 — indicating deep bearish momentum this week.
🧠 Summary – 1‑Week Level Playbook
Bearish near‑term risk:
Break below ~₹407 opens potential towards psychological lower bands.
Key levels for traders this week:
Support to watch: ~₹407 (S3)
Initial resistance to challenge: ~₹451 (S1 on weekly pivot)
Major resistance zones: ~₹495 and ~₹523

DIXON 1 Day Time Frame 📉 Intraday Price Action (Today’s Range)
Day’s Range: ~₹10,274 – ₹10,790
This indicates where the stock has been trading so far today.
📊 Key Intraday Levels for 1‑Day Time Frame
🟢 Support Levels
S1: ~₹10,545 – ₹10,550
S2: ~₹10,359 – ₹10,360
S3: ~₹10,016 – ₹10,020
🔴 Resistance Levels
R1: ~₹11,070 – ₹11,075
R2: ~₹11,410 – ₹11,420
R3: ~₹11,600 – ₹11,605
These pivot‑derived support/resistance levels are typical for intraday reference (classic pivot methodology).
🧠 How to Use These Levels (Intraday)
Bullish bias: A sustained break above R1 ~₹11,070 with volume can open moves toward R2 ~₹11,410.
Bearish bias: If price loses S1 ~₹10,545, next support guards are S2 ~₹10,360 and S3 ~₹10,016.

HINDCOPPER 1 Month Time Frame 📊 Current Reference Price
The stock is trading around ₹540 – ₹560 on the NSE today.
🧠 1‑Month Timeframe Key Levels
📈 Resistance (Upside Barriers)
These are levels where the stock might face selling pressure or pauses if it continues higher:
1. ₹570 – ₹575 — Immediate near‑term resistance zone (recent highs).
2. ₹580 – ₹585 — Next resistance cluster above current price — psychological plus pivot area.
3. ₹595 – ₹600+ — Extended upside target if price breaks above the near zone.
Interpretation: A daily/weekly close above ~₹575–₹580 can confirm strength on the 1‑month chart and open the move toward ~₹600+.
📉 Support (Downside Floors)
These are levels where buyers may step in if price corrects:
1. ₹522 – ₹525 — Near pivot support on medium timeframe.
2. ₹500 – ₹510 — Secondary support zone that has seen demand historically on pullbacks.
3. ₹480 – ₹490 — Deeper short‑term support — a key level if price weakens further.
Interpretation: Holds above ~₹520–₹525 are bullish for the 1‑month swing; breaks below that raise risk of deeper pullback toward ₹500 or lower.
✍️ 1‑Month Trading Perspective (Short Summary)
📌 Bullish Scenario
Sustained daily closes above ~₹575–₹580 → watch ₹590–₹600+ as next short‑term targets.
📌 Neutral / Range Scenario
Price consolidates between ₹525 and ₹575 — likely choppy movement before next directional breakout.
📌 Bearish / Correction Scenario
Close below ~₹522–₹525 → deeper support zones around ₹500–₹490 may get tested.
⚠️ Important Notes
✅ These are technical reference levels, not buy/sell recommendations.
✅ Price action can change quickly with market news, global copper trends, or broader index moves (e.g., Nifty/commodity dynamics).

CUBEXTUB 1 Week Time Frame 📊 Current Price Context
Latest trading range (approx): ₹99–₹103 per share.
📈 Weekly Key Levels (Approximate)
🎯 Resistance Levels
These are areas where upside price movement may slow or reverse:
1. First Resistance: ~₹108–₹109 — near recent pivot resistance.
2. Next Resistance: ~₹113–₹116 — upper weekly resistance zone.
3. Higher Target: ~₹118–₹120+ — longer weekly resistance/extension.
📉 Support Levels
These are areas where price may find buying interest or a bounce:
1. Immediate Support: ~₹101–₹102 — just below recent price and short‑term pivot support.
2. Secondary Support: ~₹98–₹99 — next downside zone.
3. Lower Support: ~₹94–₹95 — deeper support if weakness continues.
📌 Weekly Pivot Reference
Pivot Level (central reference): ~₹106 — roughly the fulcrum of bulls vs. bears this week.
🛠 How to Use These Levels (Weekly Basis)
Bullish scenario:
✅ If the weekly close breaks and holds above ₹108–₹109, next resistance targets of ₹113–₹116 become active.
Bearish scenario:
❌ Failure below ₹101–₹102 could open the path toward ₹98–₹95 support.
Range bias:
🟡 Price may oscillate between ₹101–₹113 in the absence of a decisive trend signal.

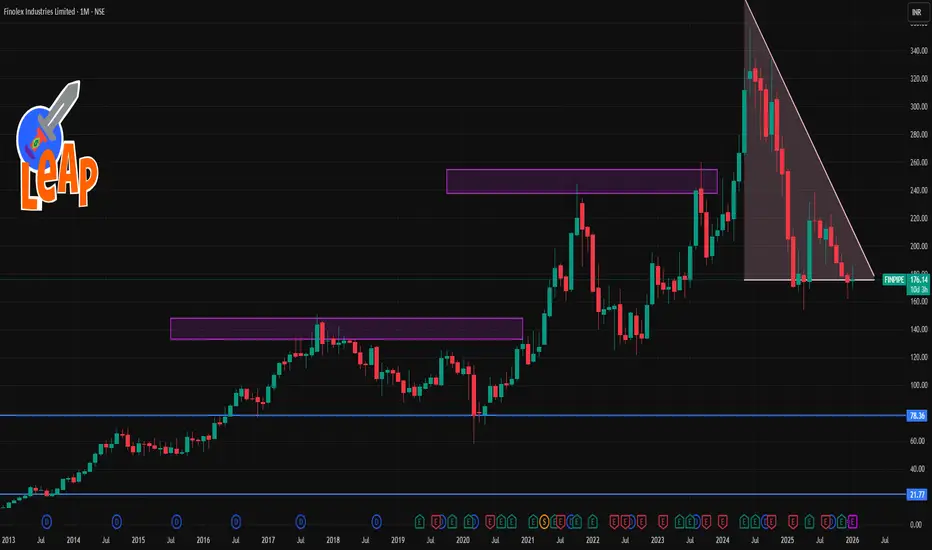
FINPIPE 1 Month Time Frame📊 Current Context
The share has been moderately positive over the past month (~+5–8% gains) in recent price data.
Recent share price (late Jan 2026) is near ₹175–177 levels.
📈 Key Levels (1‑Month Timeframe)
🔹 Resistance Levels
These are levels where the price may face selling pressure:
1. ~₹177–179 — Immediate resistance seen on short‑term pivot structure.
2. ~₹185–189 — Next meaningful resistance zone based on recent moving average clusters (20–50 day EMAs/SMAs).
3. ~₹194–198 — Higher resistance around 50–100 day average / upper consolidation of the last month/quarter.
Break above ₹185–189 with volume could signal a stronger short‑term uptrend continuation.
🔻 Support Levels
Important price floors where the price may find buyers:
1. ~₹173–175 — Near short‑term support and recent intraday pivot levels.
2. ~₹169–170 — Lower support seen from short swing lows over the past month.
3. ~₹164–165 — Deeper support from prior month low levels before recent recovery. (Estimated from recent historical lows.)
A close below ~₹169 on daily charts could indicate weakening short‑term structure.
🗺️ Trading Mindset (not financial advice)
Bullish view: A sustained move above ₹185–189 with increased volumes may target higher resistance near ₹195+.
Bearish view: A close under ₹170–169 could restart short‑term weakness toward lower support levels.
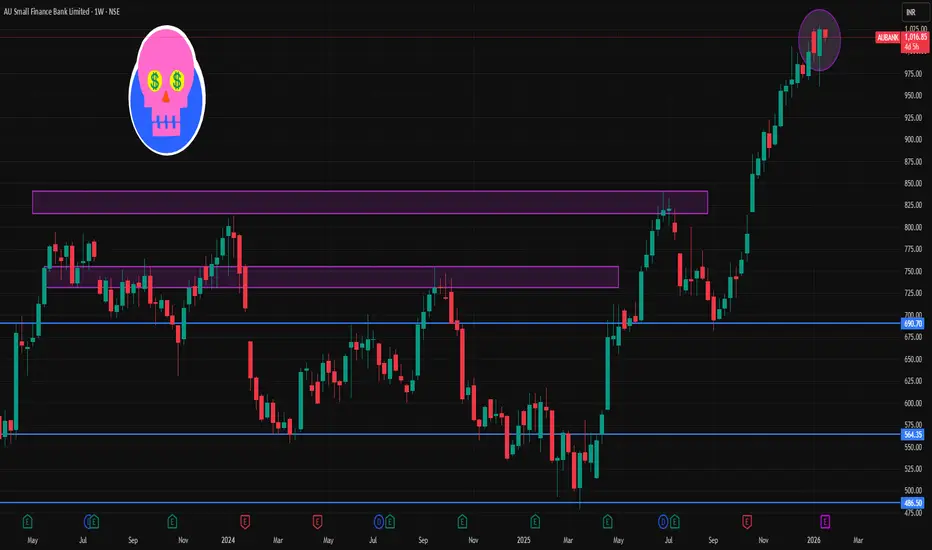
AUBANK 1 Week Time Frame 📌 1‑Week (Current) Key Levels
📍 Current Price Context
The stock has been trading around ₹1,020–₹1,030 area recently on NSE technical feeds.
🧱 Resistance Levels (Upside Targets)
1. Immediate Resistance (R1): ~₹1,050.35 – first barrier on the upside.
2. Major Resistance (R2): ~₹1,075.30 – next meaningful supply zone.
3. Higher Resistance (R3): ~₹1,120.65 – extended bullish breakout territory.
🛡️ Support Levels (Downside Defenses)
1. Immediate Support (S1): ~₹980.05 – crucial for weekly structure.
2. Major Support (S2): ~₹934.70 – deeper correction zone if S1 breaks.
3. Lower Support (S3): ~₹909.75 – extended bearish support for the week.
📊 Weekly Trading Range Projection
Bearish range: ~₹909–₹980
Bullish range: ~₹1,050–₹1,120 +
Price needs to hold above ₹980 weekly close to maintain bullish bias for the week.
📈 Trend & Indicators (Weekly)
Moving averages and oscillators on short‑term charts show neutral to mildly bullish momentum around ₹1,020–₹1,030.
EMA & SMA structures on daily charts support trend continuation if above key moving averages.
🔎 How to Use These Levels This Week
📌 Bullish setup:
Break and sustain above ~₹1,050 → potential run to ~₹1,075 → ₹1,120.
📌 Bearish setup:
Close below ~₹980 support → target ~₹935 → ₹910 on a deeper correction.
📌 Neutral / Swing range:
Between ₹980 and ₹1,050 → sideways action and range trades.
SOLARINDS 1 Day Time Frame 📊 Live Price Snapshot (approx)
Current NSE price: ~₹13,190 – ₹12,875 range (end of last session)
📈 Daily Pivot & Key Levels (1-Day Timeframe)
These come from recent pivot point calculations and live technical feeds:
Resistance Levels (Upside)
R1: ~₹13,577
R2: ~₹13,963
R3: ~₹14,214
(Potential upside barriers / targets)
Pivot Point
Pivot (Daily Reference): ~₹13,300 zone (approx midpoint)
Support Levels (Downside)
S1: ~₹12,940
S2: ~₹12,689
S3: ~₹12,303
(Zones where buying interest often emerges intraday)
🔍 Short-Term Bias & Indicators
Technical indicator signals today (1D):
RSI: Neutral/around mid-range → neither overbought nor oversold.
MACD: Bullish crossover on short timeframe.
Moving Averages (short & mid DMA/EMA): Mixed (some short EMAs bullish, some bearish), signaling consolidation bias around current price.
🕒 Summary for Today (1D)
Neutral to slightly bullish near current levels with balanced indicator setup
Key levels to watch:
Upside: 13,577 → 13,963 → 14,214
Downside: 12,940 → 12,689 → 12,303
Immediate pivot bias around ₹13,300 will determine intraday direction.

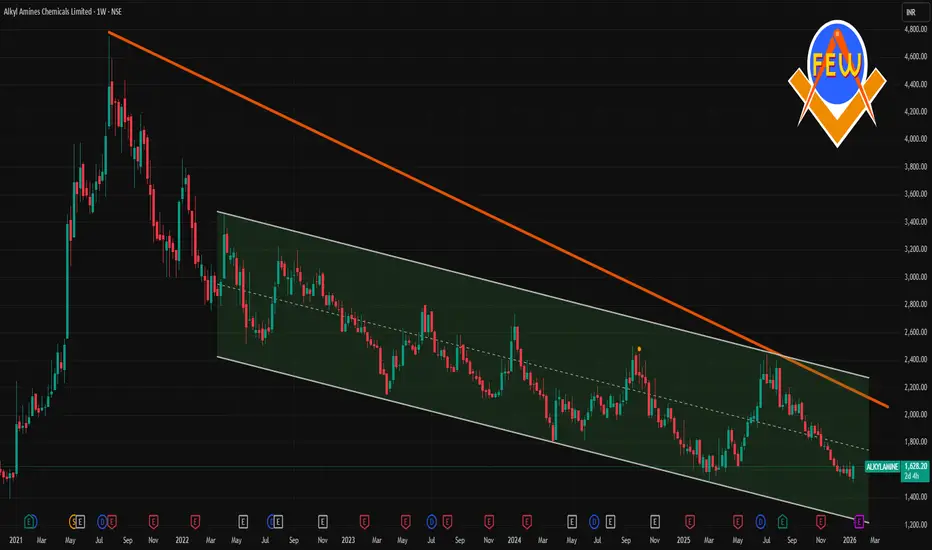
ALKYLAMINE 1 Week Time Frame 📌 Current Price (Latest Market Levels)
Approximate current trading price: ₹1,570 – ₹1,610 range on NSE (mid‑January 2026) — slightly below recent intraday highs/lows around this zone.
52‑week range: Low ~₹1,506 • High ~₹2,438.
Short‑term price action has been slightly bearish to neutral around this zone with some down‑side pressure evident.
📈 1‑Week (Weekly) Technical Levels
🔑 Weekly Pivot Levels
These come from multiple pivot calculations (classic & fibo), giving a weekly frame support/resistance range:
Weekly Pivot Zone
Pivot (~1,580 – 1,584) — acts as the mid‑point level this week.
Weekly Resistance
R1: ~₹1,610 – 1,615 (first resistance ahead).
R2: ~₹1,630 – 1,650 (stronger resistance).
R3: ~₹1,670 – 1,680 (broader weekly upper target).
Weekly Support
S1: ~₹1,545 – 1,555 (initial support).
S2: ~₹1,520 – 1,530 (deeper support).
S3: ~₹1,485 – 1,495 (significant near‑term buffer).
📌 Weekly pivot levels are useful to gauge if price holds above support — which implies stay bullish weekly — or breaks down through support — into bearish continuation.
💡 What This Means for the Next 1 Week
✅ Key levels to watch for directional bias:
Weekly Bullish trigger: Close above ₹1,610‑1,615
Weekly bearish trigger: Close below ₹1,545