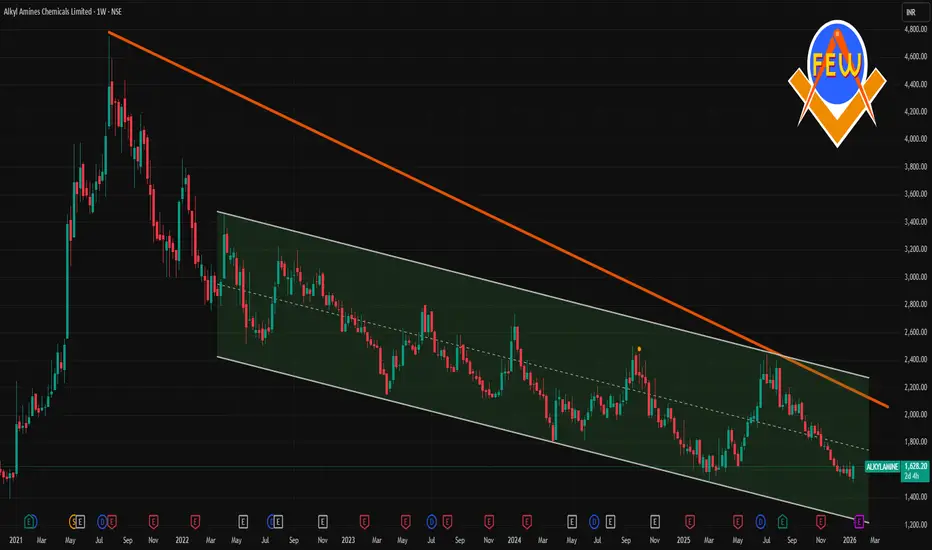
ALKYLAMINE 1 Week Time Frame 📌 Current Price (Latest Market Levels)
Approximate current trading price: ₹1,570 – ₹1,610 range on NSE (mid‑January 2026) — slightly below recent intraday highs/lows around this zone.
52‑week range: Low ~₹1,506 • High ~₹2,438.
Short‑term price action has been slightly bearish to neutral around this zone with some down‑side pressure evident.
📈 1‑Week (Weekly) Technical Levels
🔑 Weekly Pivot Levels
These come from multiple pivot calculations (classic & fibo), giving a weekly frame support/resistance range:
Weekly Pivot Zone
Pivot (~1,580 – 1,584) — acts as the mid‑point level this week.
Weekly Resistance
R1: ~₹1,610 – 1,615 (first resistance ahead).
R2: ~₹1,630 – 1,650 (stronger resistance).
R3: ~₹1,670 – 1,680 (broader weekly upper target).
Weekly Support
S1: ~₹1,545 – 1,555 (initial support).
S2: ~₹1,520 – 1,530 (deeper support).
S3: ~₹1,485 – 1,495 (significant near‑term buffer).
📌 Weekly pivot levels are useful to gauge if price holds above support — which implies stay bullish weekly — or breaks down through support — into bearish continuation.
💡 What This Means for the Next 1 Week
✅ Key levels to watch for directional bias:
Weekly Bullish trigger: Close above ₹1,610‑1,615
Weekly bearish trigger: Close below ₹1,545
Chartstructure
MCX 1 Week Time Frame 📌 MCX Current Market Snapshot
Current Price: ~₹2,360 – ₹2,370 per share (approx live market price)
52‑Week Range: ₹881 – ₹2,380+
📊 Weekly Technical Levels (Pivot‑Based)
These levels come from the most recent pivot calculations for the weekly timeframe.
Weekly Resistance
R3: ~₹2,458.67
R2: ~₹2,398.33
R1: ~₹2,294.67
Weekly Pivot (Central Reference):
Pivot: ~₹2,234.33
Weekly Support
S1: ~₹2,130.67
S2: ~₹2,070.33
S3: ~₹1,966.67
📌 Interpretation
Trend bias above the pivot (~₹2,234) — bullish weekly bias as long as price stays above this.
Immediate resistance band: ~₹2,294‑₹2,398 — watch for weekly closes above to confirm momentum.
Strong weekly breakout trigger: above ₹2,398‑₹2,458 on closing basis can open extended upside.
Key support zone: ~₹2,130‑₹2,070 — weekly closes below this can indicate deeper pullback risk toward ~₹1,966.
📈 How to Use These Weekly Levels
Bullish scenario
Weekly close above the pivot zone (~₹2,234) and hold above R1 can lead to tests of R2/R3.
Breakouts beyond ₹2,398 with volume increase strengthen upward momentum.
Bearish scenario
Weekly close below ₹2,130 suggests sellers scaling up and possible move toward S2/S3.
Watch for rejection signals (long wicks, bearish candles) near upper resistances.

VEDL 1 Moth Time Frame 📌 Latest Market Context
• The stock is trading near multi‑month and all‑time highs (around ₹670+ on NSE) on strong momentum and positive sentiment after broker upgrades and structural catalysts.
• RSI readings suggest strong upside momentum but near overbought in some sources.
📈 1‑Month Timeframe Key Levels
(These combine pivot, swing support/resistance & recent price action ranges)
Resistance (Upside Targets)
₹656–₹660 — Upper daily pivot resistance zone.
₹650–₹656 — R2–R3 levels from technical pivot indicators.
Above ₹670–₹680 — Near current multi‑week highs / psychological zone (strong breakout if sustained).
Support (Downside Floors)
₹630–₹635 — Immediate pivot support (~S1) & short‑term cushion.
₹622–₹625 — Secondary demand zone near moving average clusters.
₹616–₹620 — Deeper swing support if short correction unfolds.
📊 What These Levels Mean
✅ Holding Above ₹630–₹635
Maintains bullish momentum in the 1‑month view.
Prospects for retesting ₹650+ and potentially ₹670–₹680 if buying continues.
⚠️ Break Below ₹620
Could open a pullback toward ₹616 and lower pivot zones before buyers re‑emerge.
A close below ~₹616 on monthly/daily charts may signal short‑term loss of structure.
📍 How to Use These Levels
Bullish Trade Setup (1M swing)
Buy or add near support ₹630–₹620 with stops slightly below ₹616
Targets: ₹650 → ₹670+
Neutral/Profit‑Taking Zone
₹650–₹670+ is the next potential resistance breakeven/exit zone
Bearish/Defensive
If price decisively closes below ₹620–₹616, reduce risk exposure and watch for support at lower levels.

CHART PATTERNS Chart patterns are visual shapes formed by price movements on a chart. These patterns occur repeatedly across markets and timeframes because human psychology doesn’t change. Fear, greed, panic, and hope create predictable structures.
Chart patterns fall into three categories:
1. Reversal Patterns
2. Continuation Patterns
3. Bilateral Patterns
Understanding Chart Patterns with Market Psychology
Every chart pattern reflects the psychological war between buyers and sellers.
Higher highs & higher lows: Buyers strong
Lower highs & lower lows: Sellers strong
Flat areas: Indecision
Breakouts: One side finally wins

MPHASIS 1 Week Time Frame 📊 Weekly Support & Resistance Levels
(From recent weekly technical outlook)
Resistance
R1: ₹2,863 – ₹2,865 region
R2: ~₹2,920 – ₹2,919
R3 (Bullish breakout): ~₹2,965
Support
S1 (Immediate): ~₹2,762
S2: ~₹2,717
S3 (Strong support): ~₹2,660
This gives a probable weekly trading range of ~₹2,660 to ₹2,965.
📉 Pivot Point Reference (Short-Term)
From a recent pivot calculation — can help identify intra-week turning points:
Classic pivot point around ~₹2,817 with:
S1: ~₹2,796
S2: ~₹2,776
S3: ~₹2,755
R1: ~₹2,817
R2: ~₹2,837
R3: ~₹2,858**
📈 Current Technical Signals Context
EMA/SMA and oscillators on daily/weekly are mixed to neutral-bullish — some sources show buy bias while others show weak trend — indicating no strong breakout trend yet and trending within range unless a clear break happens.
✅ Summary for 1-Week Level Strategy
Bullish break above: ~₹2,920–₹2,965
Key support zone to watch: ~₹2,660–₹2,762
Neutral pivot: ~₹2,800–₹2,830

IEX 1 Day Time Frame 📊 Daily Support & Resistance (Short‑Term Levels)
Pivot‑based Daily Levels (from classical pivot calculations):
Resistance 1 (R1): ~₹145.5
Resistance 2 (R2): ~₹147.1
Resistance 3 (R3): ~₹148.2
Pivot Point: ~₹144.5
Support 1 (S1): ~₹142.9
Support 2 (S2): ~₹141.8
Support 3 (S3): ~₹140.2
➡️ These are typical classic pivot levels for the current trading day based on the previous day’s price action.
📈 Modern Technical Levels
From recent pivot analysis on a broader timeframe (but still relevant for daily intraday levels):
Immediate Resistance: ~₹183.7
Next Resistance: ~₹188.5
Higher Resistance: ~₹191.1
Immediate Support: ~₹176.3
Lower Support: ~₹173.7
Further Support: ~₹168.9
⚠️ These levels above are from recent pivot indicators (likely based on slightly longer lookback than 1D but often used by traders together with daily pivots).
✨ How to Use These Levels in 1‑Day Trading
Resistance levels → Possible price rejection or profit‑taking zones on upside rallies.
Support levels → Areas where price might find buying or bounce if selling pressure eases.
Pivot level (~₹144–145) → Balance point useful for gauging daily bias (above → bullish, below → bearish).

PHOENIXLTD 1 Day Time Frame 📈 Current Price (approx)
Around ~₹1,867–₹1,907 on NSE during today’s session.
🔁 Daily Pivot & Key Levels (Today’s intraday reference)
Central Pivot Point:
📌 Pivot: ~₹1,903–₹1,912
Resistance Levels (Upside):
R1: ~₹1,936–₹1,940
R2: ~₹1,970–₹1,980
R3: ~₹1,994–₹2,000+
Support Levels (Downside):
S1: ~₹1,879–₹1,885
S2: ~₹1,855–₹1,866
S3: ~₹1,821–₹1,848
These are intraday pivot levels calculated from the previous day’s range and widely used for daily support/resistance barriers.
📊 Key Intraday Zones (to watch today)
Bullish Above:
Break above ~₹1,936–₹1,940 opens space toward R2 (~₹1,970) and potentially R3 (~₹2,000+).
Bearish Below:
Failure below ~₹1,885–₹1,866 may signal further downward pressure toward S3 (~₹1,821).
Pivot Reaction:
Price above pivot (~₹1,903–₹1,912) today suggests bullish bias.
Price below pivot suggests bearish/in‑range conditions.

BERGEPAINT 1 Week Time Frame 📌 Weekly Support & Resistance Levels (derived from recent weekly pivot analysis):
Resistance 3: ~570.0
Resistance 2: ~558.4
Resistance 1: ~541.3
Support 1: ~512.5
Support 2: ~500.9
Support 3: ~483.8 (lower weekly support)
📊 Alternate short‑term pivot levels (different provider):
Pivot: ~548.4
R1: ~554.8
R2: ~565.1
R3: ~571.5
S1: ~538.1
S2: ~531.7
S3: ~521.4 (intraday‑oriented pivot band)
Interpretation for 1‑Week Trading
Bullish Levels / Breakouts
Bullish breakout above ~558–570: could signal continuation to the next zone of resistance.
Holding above weekly pivot (~548–554): bullish bias for the week.
Bearish Levels / Breakdown
Major breakdown below ~512–500: opens deeper support near ~484.
Weakness under ~538: a sign of short‑term bearish pressure.
Price Context
Recent data suggests the stock has been oscillating in a range with short‑term weakness around the mid‑500s and support building around low‑500s.

PNB 1 Day Time Frame 📊 Daily Support & Resistance Levels
These are common pivot-style levels based on recent price action — good for short-term intraday/next-day reference:
Pivot (Daily Reference Zone): ~₹123.5-₹124 range (approximate)
Resistance Levels (Upside Targets)
R1: ~₹124.9–₹125.0 — first resistance zone near recent pivot upside.
R2: ~₹127.1–₹127.2 — higher resistance zone on daily.
R3: ~₹128.4–₹128.5 — extended resistance near recent highs.
Support Levels (Downside Barriers)
S1: ~₹121.5–₹121.8 — immediate support close below pivot.
S2: ~₹120.2–₹120.7 — secondary support zone.
S3: ~₹118.0–₹118.0+ — deeper support if price weakens.
📉 Other Short-Term Levels From Recent Technical Tools
Pivot-based support (Choice India): ~₹101.7, ~₹100.5, ~₹98.4 — longer-range levels (not daily but multi-session reference).
Bollinger bands (approx high/low daily bands): ~₹124.6 upper, ~₹115.0 lower.
🧠 Context from Indicators
RSI around mid-range (~50–65), suggests no extreme in daily momentum right now.
Moving average support around 50/100-day range (₹120–₹117) can act as dynamic support zones.
📌 How to Use These Levels
Bulls watch: Break above R1 (~₹125) for continuation toward R2/R3 (~₹127-128).
Bears watch: If price breaks below S1 (~₹121.5), next support comes around S2/S3 (~₹120 / ~₹118).
Pivot levels near ₹123-124 act as a short-term sentiment line — above is bullish, below is cautious.

BEL 1 Day Tie Frame 📍 Current Quote & Daily Price Range (approx)
Current Price: ~ ₹418.65 (latest close / last traded price)
Day’s Low / High: ~ ₹415.85 – ₹424.55
📊 Daily Pivot & Levels (Standard / Fibonacci)
(Calculated from most current data available)
🔥 Pivot Points (Fibonacci Basis):
Pivot (Central): ₹417.55
Resistance 1 (R1): ₹420.95
Resistance 2 (R2): ₹423.05
Resistance 3 (R3): ₹426.45
🛡️ Support Levels:
Support 1 (S1): ₹414.15
Support 2 (S2): ₹412.05
Support 3 (S3): ₹408.65
📌 Alternative Broker‑Derived Levels (Correlation)
These are close to the pivot model above and help confirm zones:
From another live technical feed:
Pivot: ~ ₹417.55
First Support: ₹412.15
First Resistance: ₹421.05
Second Support: ₹408.65
Second Resistance: ₹426.45
Third Support: ₹403.25
Third Resistance: ₹429.95
This confirms the support zone ~₹408–412 and resistance zone ~₹421–427+.
📈 How to Interpret (Today’s Daily Chart)
✔️ Bullish continuation if price holds above:
Pivot: ₹417.55
Support zone: ₹412–₹408
✔️ Upside breakout triggers stronger moves above:
R1 / R2: ₹420.95 → ₹423+
Above ₹426+ opens room toward fresh highs.
❌ Bearish risk if price drops below:
S1‑S2 zone: ₹414 → ₹412
Break below ₹408 — downside pressure toward lower supports.

STEELCAS 1 Day Time Frame 📊 Current Price Snapshot (Latest Available)
Approx Live Price: ~₹210–₹213 per share (recent session)
Today’s Day Range (recent close): ~₹208–₹214
📈 Accurate Daily Support & Resistance Levels
🔹 Pivot Point (Day Reference)
Pivot: ~₹206.55–₹213.62 (central reference)
📉 Support Levels
S1: ~₹203.7–₹205.8 – first key support
S2: ~₹197.1–₹201.1 – stronger secondary support
S3: ~₹188.8–₹193.3 – deep support zone
📈 Resistance Levels
R1: ~₹218.5–₹218.3 – first resistance
R2: ~₹226.8–₹226.1 – next upside target
R3: ~₹233.4–₹230.7 – higher resistance
🧠 How to Use These Levels (Daily Time Frame)
Bullish scenario
Break and hold above R1 (~₹218–219) could signal continuation toward R2 (~₹226+).
Sustained break above R2 strengthens trend.
Bearish scenario
Failure under Pivot (~₹206–213) with close below S1 (~₹204–206) may open S2 (~₹197) and S3 (~₹188).
Look for volume confirmation on breakdowns.
📍 Quick Reference Summary (Daily Levels)
Level Price Approx
R3 ~₹230–₹233+
R2 ~₹226–₹227
R1 ~₹218–₹219
Pivot ~₹206–₹213
S1 ~₹203–₹206
S2 ~₹197–₹201
S3 ~₹188–₹193

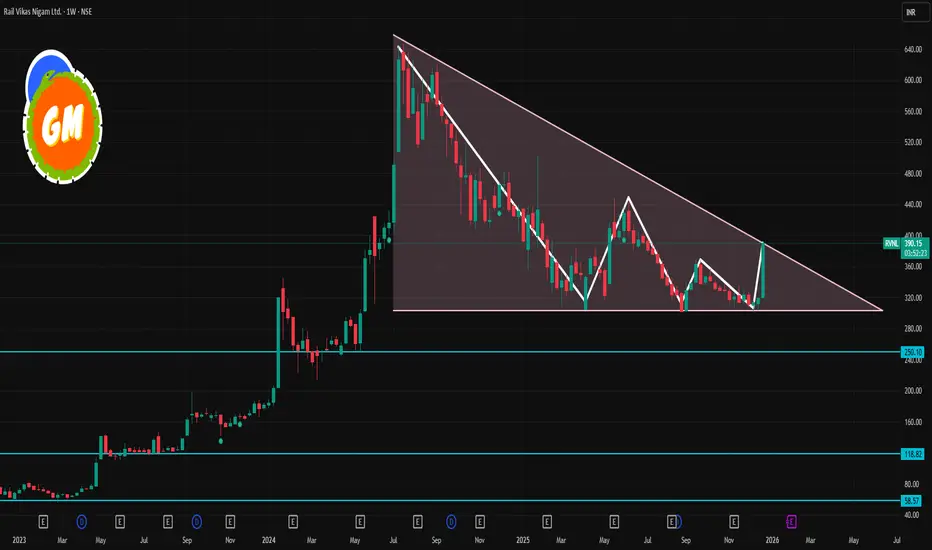
RVNL 1 Week Time Frame 📍 Current Status (as of latest market data):
RVNL trading around ₹356–₹360 on NSE/BSE.
📈 Key Levels for this Week (Intraday / Swing)
🔹 Resistance Levels
1. ₹369‑₹373 — Immediate resistance zone where short‑term counter may face selling pressure.
2. ₹377‑₹380 — Higher resistance; a breakout above this could signal short‑term bullish continuation.
🔻 Support Levels
1. ₹362‑₹357 — First support; holds short‑term pullbacks intraday.
2. ₹354‑₹350 — Deeper support — breach of this could see more downside.
3. ₹345‑₹340 — Strong support zone seen from recent chart structures (near 50DMA and consolidation).
📊 What This Means for the Next Week
✅ Bullish scenario
If RVNL closes above ₹373‑₹377 on daily closes, momentum could push towards ₹385‑₹395 in the coming sessions (momentum breakout).
Sustained buying and above‑average volumes would strengthen upside bias.
❌ Bearish scenario
A breakdown below ₹350‑₹345 could lead to a slide to ₹330‑₹325, where longer‑term support zones lie.
Daily closes below ₹350 increases the chances of deeper correction.
⚡ Neutral / Consolidation
If price stays between ₹350–₹373, expect sideways range‑bound trade before a clearer breakout direction.
🧠 Traders’ Focus This Week
✔ Watch daily closing levels above resistance / supports.
✔ Breakouts with higher volumes matter more than intraday spikes.
✔ Stop losses below the strong support zones (e.g., ~₹345) if positioning long.

HCLTECH 1 Month Time Frame 📌 Current Price Snapshot
Approx. live share price: ₹1,640–₹1,650 range on NSE today.
📅 1‑Month Price Context
Over the past month, HCLTECH has generally traded between roughly ₹1,590 – ₹1,680 before recent moves.
📊 Key 1‑Month Technical Levels
🔹 Immediate Support Levels
These are short‑term levels where price may find buying interest:
S1: ~₹1,620
S2: ~₹1,605
S3: ~₹1,592
(support levels from pivot analysis)
Additional support areas if price falls further:
~₹1,580–₹1,570 (psychological region and recent consolidation area)
🔺 Immediate Resistance Levels
These are short‑term levels where price may face selling pressure:
R1: ~₹1,647–₹1,650
R2: ~₹1,660
R3: ~₹1,670–₹1,675
(pivot‑based resistance zones)
If bulls push higher:
~₹1,690–₹1,700 is a possible zone of next resistance before bigger range tests.
📈 Trend & Moving Averages (1‑Month)
20 DMA: ~₹1,659
50 DMA: ~₹1,610
100 DMA: ~₹1,536
200 DMA: ~₹1,564
(latest moving averages reflect neutral‑to‑bullish alignment with price above most SMAs)
📌 How to Use These Levels
Bullish scenario:
If HCLTECH sustains above ₹1,650–₹1,660, the next resistance to watch is ₹1,675–₹1,700, and potential testing of recent broader highs.
Bearish scenario:
If it breaks below ₹1,592–₹1,580, short‑term support weakens and price could drift toward ₹1,550–₹1,570.

ITC 1 Day Time Frame 📌 Current Price Context (approx):
ITC is trading around ₹340–₹342 on the NSE — near recent multi-year lows (52-week low ~₹337.75).
📊 Daily Pivot / Support & Resistance Levels (Based on Recent Technical Data)
📈 Pivot Reference
Since live pivot recalculation varies by platform, here’s a reliable contemporary pivot zone used by many traders around this range:
Pivot (reference level): ~₹349.90
🚧 Resistance Levels (Upside)
R1: ~₹353.75
R2: ~₹357.80
R3: ~₹361.65
These levels are based on the latest intraday pivot analysis and represent potential upside hurdles if price attempts a bounce.
🛡 Support Levels (Downside)
S1: ~₹345.85
S2: ~₹342.00
S3: ~₹337.95
These supports coincide closely with the recent 52-week low area and nearby price action where demand may re-emerge.
📉 Typical Daily Trading Range (Indicative)
Immediate Range for Today: ~₹337.9 — ₹361.6 (approx)
This zone gives a sense of where daily swings might play out before breakout/breakdown action.
📌 What This Means for Traders
📍 Above pivot / R1 (₹353-₹355): Bullish attempt; could push toward R2/R3 if volume supports.
📍 Between support range (₹342-₹346): Choppy / consolidation zone — watch for breakout direction.
📍 Below S2 (~₹342): Bearish pressure; if price dips below ~₹338, sellers may dominate short term.

RELIANCE 1 Week Time Frame 📌 Current Price Snapshot
RELIANCE.NS is trading around ~₹1,507 – ₹1,510 per share on NSE.
📉 Key Weekly Support Levels
These are levels where price may find buying support on pullbacks:
🟩 Support 1: ~₹1,518 – ₹1,520 — near short‑term pivot support zone for the week.
🟩 Support 2: ~₹1,498 – ₹1,500 — next floor if sellers dominate early week.
🟩 Lower Support: ~₹1,479 – ₹1,480 — broader weekly downside reference.
👉 A weekly close above ₹1,518 would suggest short‑term stabilization before potential bounce.
📈 Key Weekly Resistance Levels
Levels where upside may face selling pressure:
🔴 Resistance 1: ~₹1,555 – ₹1,560 — nearest upside hurdle.
🔴 Resistance 2: ~₹1,600 – ₹1,612 — mid‑week challenge zone (~52‑week area).
🔴 Higher Resistance: ~₹1,630 – ₹1,668 — stretch target if bullish momentum picks up.
👉 A weekly close above ~₹1,612–₹1,620 would signal stronger bullish bias and possible follow‑through to higher levels.
📊 Weekly Price Range Estimate
Expected trading corridor for this week:
📉 Downside: ~₹1,498 – ₹1,500
📈 Upside: ~₹1,630 – ₹1,668
This range represents the key support and resistance boundaries traders may watch for breakouts or breakdowns during the week’s sessions.

BAJAJ-AUTO 1 Week Time Frame 📈 Current Price Context (Approx)
Bajaj Auto trading around ₹9,000–9,600 range recently (data from live quotes).
🔹 Weekly Resistance Levels
These are key upside levels where price may face selling pressure on a weekly chart:
1. ~₹9,650–₹9,700 — First major resistance zone
2. ~₹9,800–₹9,920 — Stronger resistance band
3. ~₹10,000+ — Higher breakout zone if trend continues up
(above this, momentum can accelerate)
Weekly resistance summary (approx):
R1 ~ ₹9,650
R2 ~ ₹9,800–9,920
R3 ~ ₹10,000+
🔻 Weekly Support Levels
These are key downside levels that might act as support in a correction on the weekly timeframe:
1. ~₹9,331–₹9,380 — Short-term weekly support
2. ~₹9,150–₹9,200 — Important weekly zone
3. ~₹9,000 — Psychological and minor weekly support
4. ~₹8,800–₹8,900 — Stronger lower support (break here could weaken trend)
Weekly support summary (approx):
S1 ~ ₹9,330
S2 ~ ₹9,150–₹9,200
S3 ~ ₹9,000
Lower support ~ ₹8,800–₹8,900
📊 Trend & Momentum Indicators
Weekly/daily technical indicators broadly show buy signals / positive trend structure (moving averages mostly below price) — suggesting upside continuation if major resistance zones are taken out.

LODHA 1 Week Time Frame 📌 Current Price Snapshot
LODHA is trading around ₹1,055 – ₹1,085 on NSE recently.
📊 Weekly Time Frame Levels (Support & Resistance)
🔹 Key Support Levels (Weekly)
Levels where price may find buying interest this week:
Support 1: ~₹1,063 – ₹1,064 (primary weekly support)
Support 2: ~₹1,060 – ₹1,061 (secondary zone)
Support 3: ~₹1,051 – ₹1,055 (deeper weekly support range)
📌 A decisive weekly close below ~₹1,050 – ₹1,055 could signal further downside momentum.
🔹 Key Resistance Levels (Weekly)
Levels where price may run into supply/selling:
Immediate Resistance / Pivot: ~₹1,077 – ₹1,082
Resistance 1: ~₹1,091 – ₹1,092
Resistance 2: ~₹1,097 – ₹1,100
Higher Resistance: ~₹1,110 + if bullish momentum accelerates
📌 Weekly close above ₹1,090 – ₹1,100 strengthens short‑term bullish bias.
📌 Weekly Trading Context
Bullish Scenario
Break & close above ~₹1,090‑₹1,100 on weekly chart → watch for continuation toward higher resistances.
Bearish Scenario
Breakdown and weekly close below ~₹1,063‑₹1,055 → could open path to deeper support near ~₹1,030‑₹1,020 in extended bearish move.

ADANIENT 1 Week Time Frame 📌 Current Price (approx): ~₹2,225-₹2,280 (showing slight variation in live feeds)
📊 Weekly Pivot / Key Levels
Resistance (Upside)
R1: ~₹2,289-₹2,298
R2: ~₹2,298-₹2,314
R3: ~₹2,314-₹2,320+
Pivot: ~₹2,274-₹2,280
Support (Downside)
S1: ~₹2,264-₹2,249
S2: ~₹2,240-₹2,227
S3: ~₹2,216-₹2,200
📈 Weekly Trading Range Expectation
✔ Bullish Break: Clear weekly close above ~₹2,298-₹2,314 would validate bullish momentum and open room toward higher resistance (~₹2,320+).
✔ Bearish Breakdown: Weekly close below ~₹2,227-₹2,216 suggests deeper corrective action toward lower supports.
📌 Trading Implications This Week
Bullish scenario:
Hold above pivot (~₹2,274-₹2,280)
Push through R1/R2 (~₹2,289-₹2,298) and target R3 (~₹2,314+)
Bearish scenario:
Failure to hold pivot/support zone (~₹2,240-₹2,227)
Risk to S2-S3 (~₹2,216 and below)

RVNL 1 Week Time Frame 📊 Recent Price Context
RVNL has been rallying sharply this week, up ~20–25% over the last 5–7 sessions amid sector optimism (rail fares hike & pre‑budget buying).
Current prices have now moved well off recent lows and are trading near short‑term resistance zones.
📈 Key Levels to Watch (1‑Week Swing)
Resistance (Upside)
1. ~₹380–385 — Near‑term swing resistance
Price has reacted here during recent rallies and this zone aligns with Fibonacci retracement resistance from the recent downtrend.
2. ~₹395–405 — Next barrier zone
Psychological and technical resistance from broader hourly/daily pivots. Breaching this would be bullish short‑term.
3. ~₹415+ — Larger breakout resistance
Stronger supply zone in short‑term technical studies; a clear break above here opens momentum for higher swings.
Bullish bias short‑term only if price holds above resistance breakouts.
Support (Downside)
1. ~₹360–365 — First support zone
Often an important short‑term floor if profit‑taking occurs after strong gains.
2. ~₹345–350 — Key pivot support
Near recent pivot and shorter moving averages — breaching this may weaken the short‑term bullish case.
3. ~₹330–335 — Stronger base
Below this could signal retest of broader consolidation area seen earlier in December.
📌 What to Watch This Week
📌 If price sustains above ₹380–385 with good volume → potential push toward ₹395–405.
📌 If it fails at resistance and drops below ~₹360 → risk of support test at ₹345–350, then ₹330.
📌 Broader market breadth (Nifty/BSE market conditions) & sector cues (budget news) will heavily influence intraday/week momentum.
Real Knowledge of Chart Patterns CHART PATTERNS (Market Structure Patterns)
Chart patterns are formed by price movements over a longer period and help traders understand the bigger picture. They indicate whether the trend is likely to continue, reverse, or break out after consolidation. These patterns can be grouped into three major categories:
1. Continuation Patterns
These suggest that the existing trend (uptrend or downtrend) will likely continue after a temporary pause.
2. Reversal Patterns
These indicate a possible change in trend direction.
3. Bilateral Patterns
These can break either up or down, signaling indecision.
Let’s study them in detail.

BAJAJ-AUTO 1 Month Time Frame 📊 Current Position
Last price: ~₹8,940 – ₹9,000 range.
52-week range: ₹7,089 – ₹9,490.
🔁 Near-Term Levels (1-Month Time Frame)
📈 Upside / Resistance Levels
These are prices where the stock may face selling pressure or pauses in a rally:
1. Immediate Resistance: ~₹9,100 – ₹9,150
2. Stronger Resistance: ~₹9,200 – ₹9,250
3. Positive Breakout Zone: Above ~₹9,250 – ₹9,300
Closing above these zones in sequence suggests short-term bullish momentum.
📉 Downside / Support Levels
These are key areas where the stock may find buying support if price dips:
1. Immediate Support: ~₹8,850 – ₹8,890
2. Next Support: ~₹8,750 – ₹8,780
3. Deeper Support: ~₹8,600 – ₹8,650
A breakdown below ₹8,850 could see retest of lower supports.
📊 Likely 1-Month Trading Range (Technical View)
Based on current trend and volatility, traders often expect the stock to fluctuate roughly between:
≈ ₹8,750 – ₹9,300 over a 4–6 week horizon, unless strong breakout/breakdown occurs.
This aligns with recent short-term forecast ranges from chart-based models.

MARUTI 1 Week Time Frame 📌 Current Price Context
MARUTI is trading around ₹16,470 – ₹16,480 on NSE/BSE today, near recent intraday highs.
📊 Key 1-Week Levels (Support & Resistance)
📈 Resistance Levels
These are upside price zones where selling pressure may appear:
Immediate Resistance (R1): ~₹16,463 – ₹16,488 — the primary near-term ceiling.
Secondary Resistance (R2): ~₹16,644 — next barrier if price sustains above R1.
Higher Resistance (R3): ~₹16,950 — a broader breakout level for the week.
📉 Support Levels
These are downside zones that could act as buying interest:
Immediate Support (S1): ~₹15,976 — first key floor for this week.
Support 2 (S2): ~₹15,670 — deeper support if price slips below S1.
Lower Support (S3): ~₹15,489 — significant lower buffer area for buyers.
Short-term intraday support ~₹16,100 – ₹15,975 — near current trading range.
📊 Pivot Levels (Weekly Reference) — useful for short-term traders
Standard weekly pivot analysis shows:
Weekly Pivot: ~₹16,157
S1: ~₹15,976
S2: ~₹15,670
R1: ~₹16,463
R2: ~₹16,644
R3: ~₹16,950

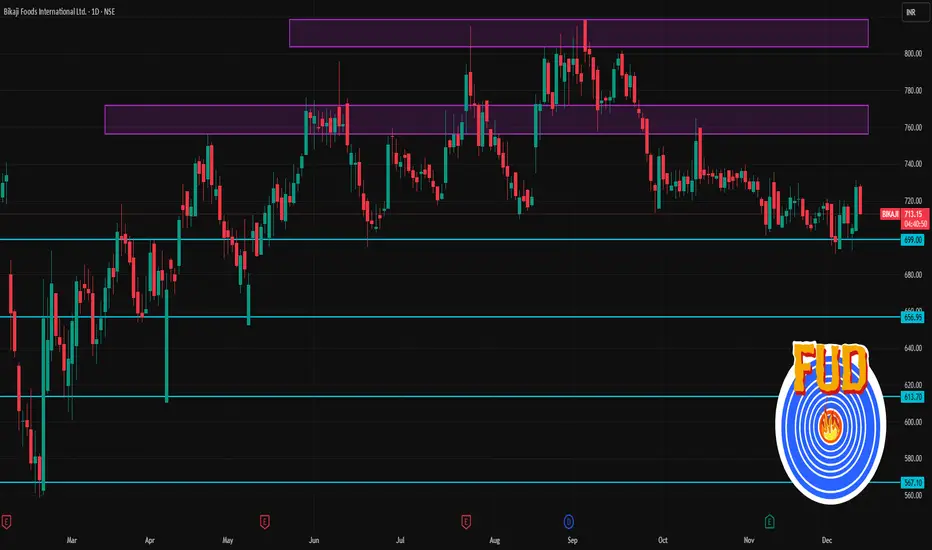
BIKAJI 1 Day Time Frame 📈 Recent Price & Basic Info
Latest price (NSE / BSE) ~ ₹725.60 (close on 10-Dec-2025)
Day’s range: ~ ₹703.90 to ₹731.15.
52-week range: ₹558.80 (low) to ~ ₹864.00 (high)
🧭 Support / Resistance / Pivot-based Levels (Daily)
From pivot-analysis (classic / Fibonacci / others) :
Pivot / Level Price (₹) / Range
Pivot (daily) ~ ₹724.95
Support 1 (S1) ~ ₹722–723 — near pivot
Resistance 1 (R1) ~ ₹727–728
Upper zones / Higher resistances (R2/R3) ~ ₹729–732
Indicative lower support zones (if price dips) ~ ₹699–¥690+