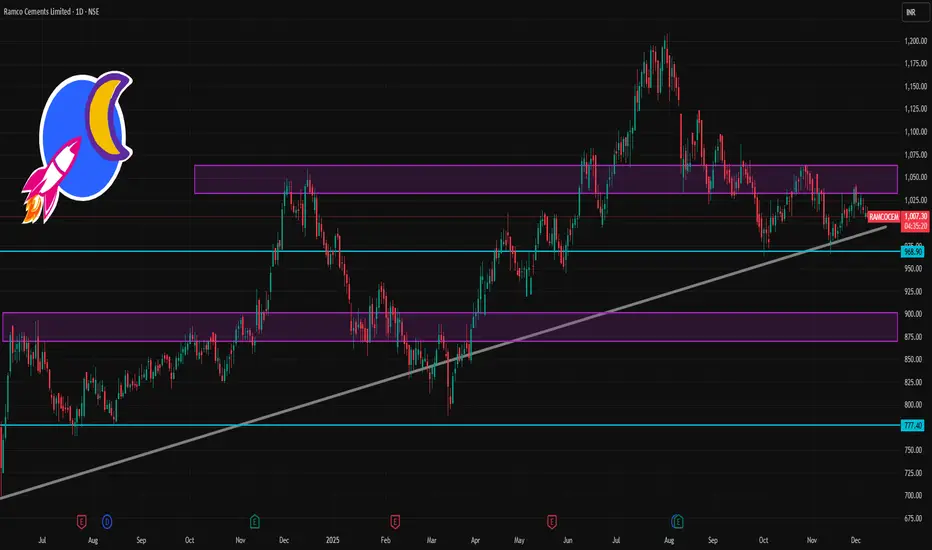
RAMCOCEM 1 Day Time Frame 📌 Current Price (Approx)
₹1007–₹1011 range on NSE during today’s session. Live market shows price around this zone (previous close ~₹1,011).
📊 Daily Pivot & Support/Resistance Levels (Updated)
(from reliable intraday pivot data)
Daily Pivot Zone
Central Pivot Point (CPR): ~₹1,011.4–₹1,011.8 (key equilibrium level)
Resistance Levels
R1: ~ ₹1,019
R2: ~ ₹1,027
R3: ~ ₹1,034–₹1,035
(above these levels can imply stronger upside if sustained)
Support Levels
S1: ~ ₹1,011–₹1,003
S2: ~ ₹996–₹992
S3: ~ ₹988–₹980
(broken support zones may accelerate downside)
✅ Key ODI pivots (Standard daily):
S1 ~ ₹1003.7
Pivot ~ ₹1019.1
R1 ~ ₹1027.3 (minor breakout level)
Chartstructure
ZYDUSWELL 1 Day Time Frame 🔎 Current snapshot
Recent quoted share‑price: ~ ₹419.7 as on close of market.
52‑week high / low ~ ₹530.9 / ₹298.6.
✅ What this implies (for today / next trading session)
If price moves upward and clears ₹456–₹463, next target zone could be ₹470–₹475 — and if momentum persists, maybe up to ₹485–₹487.
If price falls, keep an eye on ₹441–₹453 as first support; a break below ₹420–₹422 could open risk of deeper slide.
Given current price (~₹420), the stock is nearer to support side — so a modest bounce is possible if broader market or sector sentiment improves.
⚠️ What to watch out for
Daily technicals work best with volume confirmation — weak volume may render levels less reliable.
Mid‑term factors (earnings, fundamentals, market news) can overrule technical‑only moves.
Given the stock’s 52‑week high/low spread, volatility remains significant — so manage risk (stop‑loss, position sizing) carefully.

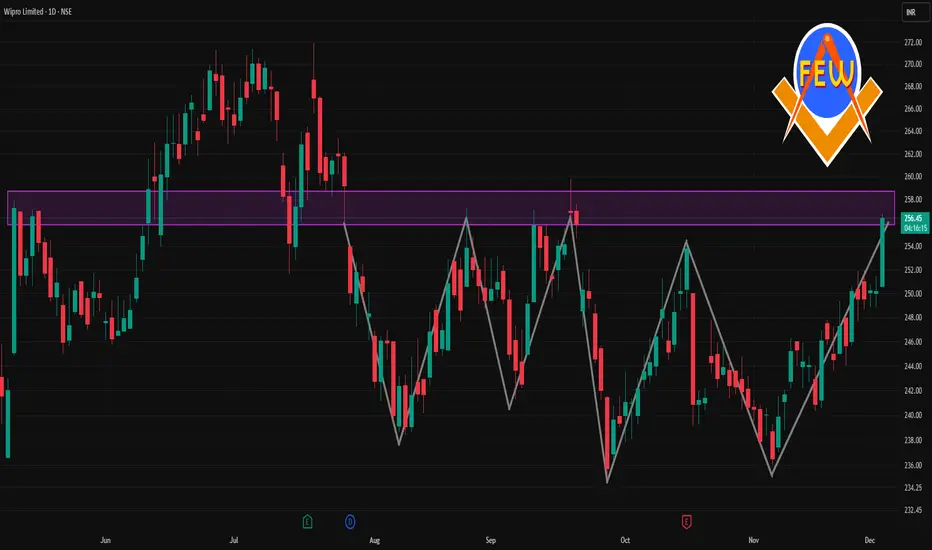
WIPRO 1 Day Time Frame 📊 Quick Snapshot
Last traded price: ~ ₹255-256
52-week range: Low ~ ₹228, High ~ ₹324–325
Recent volatility: stock has been trading in a range near ₹250–256 over past few sessions.
📈 What to Watch for the Day
If price holds above ~₹255 and gains strength, Wipro may attempt a move toward ₹265-270 — a reasonable intraday target.
If price drops below ~₹250, downside pressure could take it to ~₹245–248, or even retest ~₹242-240 if broader markets weaken.
Keep an eye on volume: higher-than-average volume on breakout or breakdown often validates the move.
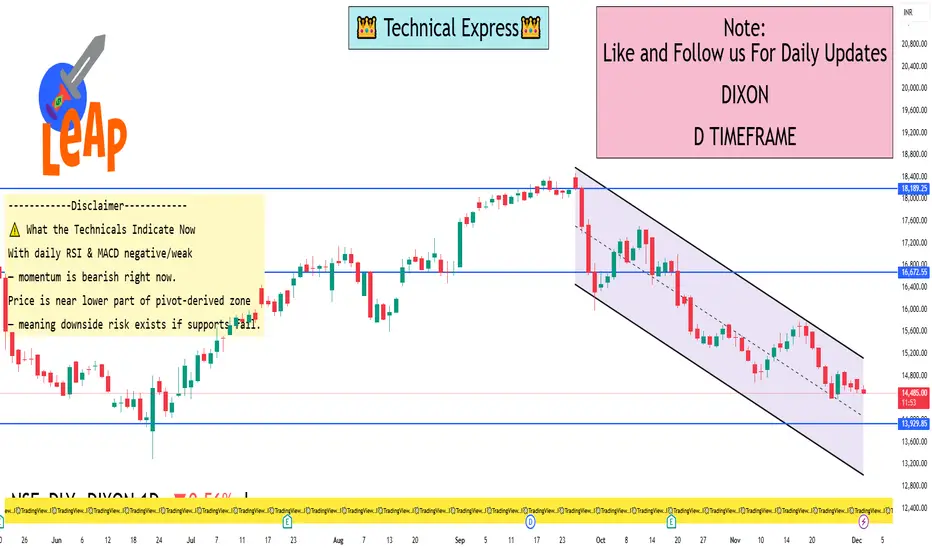
DIXON 1 Day View📌 Recent Price & Context
Last price around ₹ 14,554–₹ 14,570.
52‑week range: low ~ ₹12,202 and high ~ ₹19,149.
Recent technicals (RSI, MACD, etc.) suggest weak momentum / a “sell” bias on daily chart.
⚠️ What the Technicals Indicate Now
With daily RSI & MACD negative/weak — momentum is bearish right now.
Price is near lower part of pivot‑derived zone — meaning downside risk exists if supports fail.
For bulls to regain control, breaking above ~ ₹14,400–14,500 (R1–R2) would be an encouraging sign — could pave way to medium‑term levels.
If support at ~ ₹14,115–14,020 breaks, the next major support would be around the lower zone / 52‑week low vicinity (but that’s a bigger move).
HEROMOTOCO 1 Day View📈 Current Technical Snapshot
As of the most recent close, Hero MotoCorp is trading around ₹ 6,174–₹ 6,175.
Medium‑ to long‑term moving averages (20‑day, 50‑day, 100‑day, 200‑day) are all below current price — indicating a bullish trend on daily timeframe.
Momentum indicators (e.g. MACD, RSI, CCI) remain positive in recent technical overlays — reflecting continued bullish bias.
🧭 What this means (short‑term bias)
As long as the stock remains above ~ ₹ 6,098–6,100, positive bias likely remains intact — supports may hold if there’s a pullback.
A break above ₹ 6,200–6,205 could open near‑term upside toward ₹ 6,250–6,300+ (near recent highs / psychological resistance).
On downside — if price breaks convincingly below ~ ₹ 6,000, next real support comes only near ₹ 5,995–6,000.
⚠️ What to Watch / Limitations
Technical levels are zones, not precise lines — price may overshoot briefly before reaction.
Market‑wide factors or news (macroeconomic, demand for two‑wheelers, policy, daily volume) can override technicals.
These levels are short‑term / 1‑day to few‑day oriented. For swing or long‑term holdings, combine with weekly / monthly chart analysis.

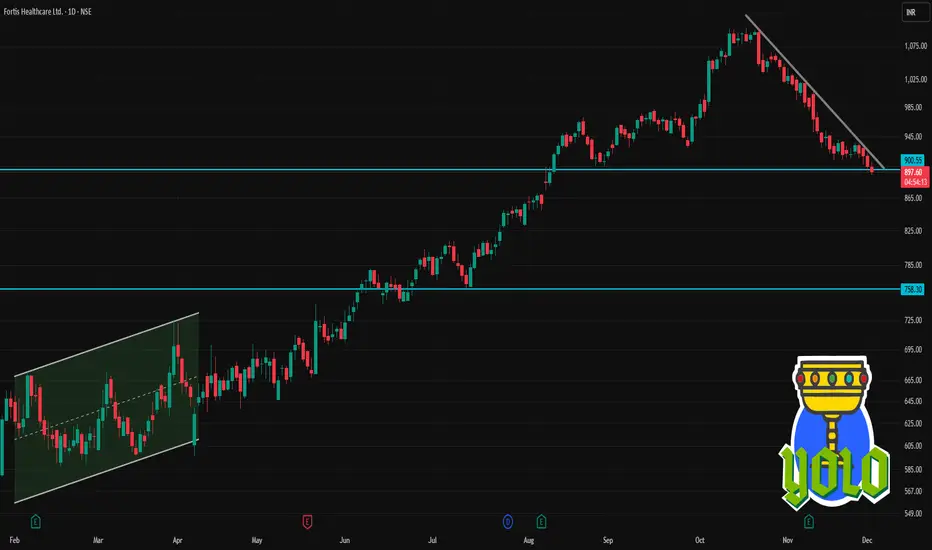
FORTIS 1 Day Time Frame 📈 Recent Price & Context
Last closing price was ~ ₹904.85.
52-week range: Low ≈ ₹577, High ≈ ₹1,104.30.
The stock has corrected from recent highs — showing some weakness in the near term.
🧭 What It Means (For Traders)
For a day-trader / intraday: watch pivot + support/resistance zones (≈ ₹908 pivot; ₹895/886 supports; ₹918/931 resistances). Use tight stop-loss near support for longs.
For a swing-trader / short-term horizon (few days to 1–2 weeks): current bearish indicators suggest caution — better to wait for a clear bounce above ~₹918–930 range or a confirmed breakdown below ~₹886 to decide direction.
Keep an eye on broader market sentiment & sector news — hospital/health-care stocks often react to regulatory or news events which can override technicals.
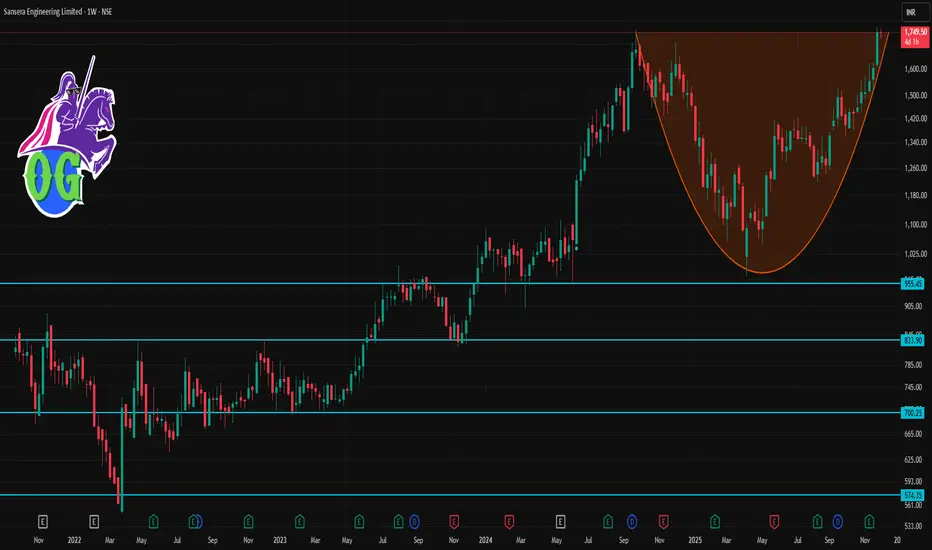
SANSERA 1 Week Time Frame 📊 Current snapshot
Current price is ≈ ₹1,746–₹1,750 (today) — just near its recent 52‑week high.
52‑week range runs roughly ₹972 (low) – ₹1,770 (high)
Key valuation metrics: P/E is steep (≈ 43–44×), P/B ~3.8–3.9×.
🔎 Short‑term technical view (1‑week horizon)
Since the stock is hovering near its all‑time/52‑week high, there’s limited headroom unless a positive trigger (new order wins, sector‑level boost, favourable global auto demand, etc.) appears.
If momentum continues and market sentiment stays positive, possible upside could push toward ₹1,780–₹1,800. That’s not guaranteed, but breakouts often test just above recent highs.
On the flip side — if broader auto‑ancillary sentiment weakens or there’s profit‑taking — a pull‑back or consolidation toward ₹1,680–₹1,700 seems plausible (near some short‑term support zone + psychological buffer).
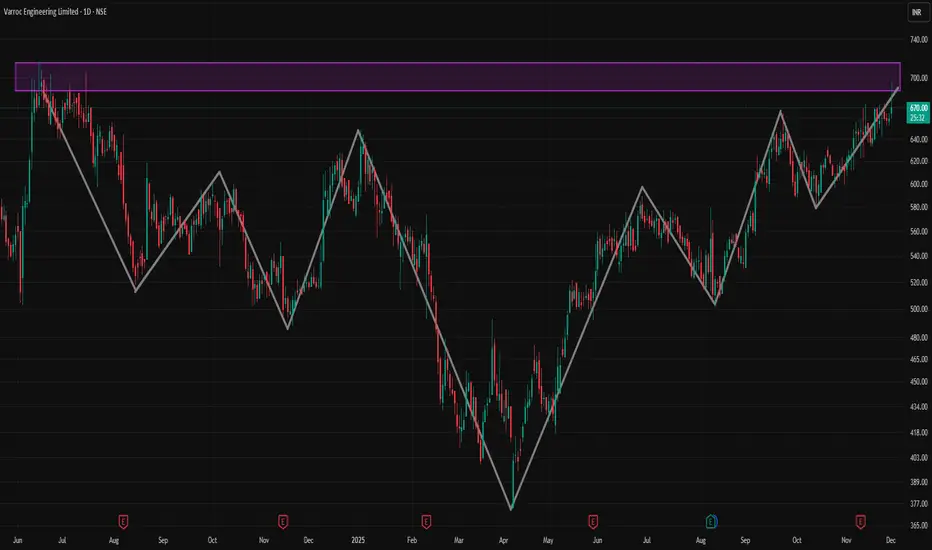
VARROC 1 Day Time Frame 📈 Where VARROC stands now
Recent quotes put VARROC around ₹ 659 – ₹ 692 per share.
On a 1‑day / very short‑term basis, the stock recently showed a jump of ~4‑5%.
The 52‑week range for the stock has been roughly ₹ 374 – ₹ 674–689 — so current levels are near the upper end of that band.
⚠️ What to keep in mind / Risks in 1‑day frame
The stock remains relatively volatile — intraday swings (highs/lows) have been wide in recent sessions.
Short‑term moves may be driven more by news/event‑driven sentiment (like EV contract wins) than by underlying long‑term fundamentals; such moves can reverse quickly if news is not sustained.
✅ My take (for a 1‑day horizon)
If you are looking at a 1‑day trade: VARROC could still have some upside — especially if momentum continues, given recent positive news + technical breakout. But treat it as a high‑risk, high‑reward speculative trade.
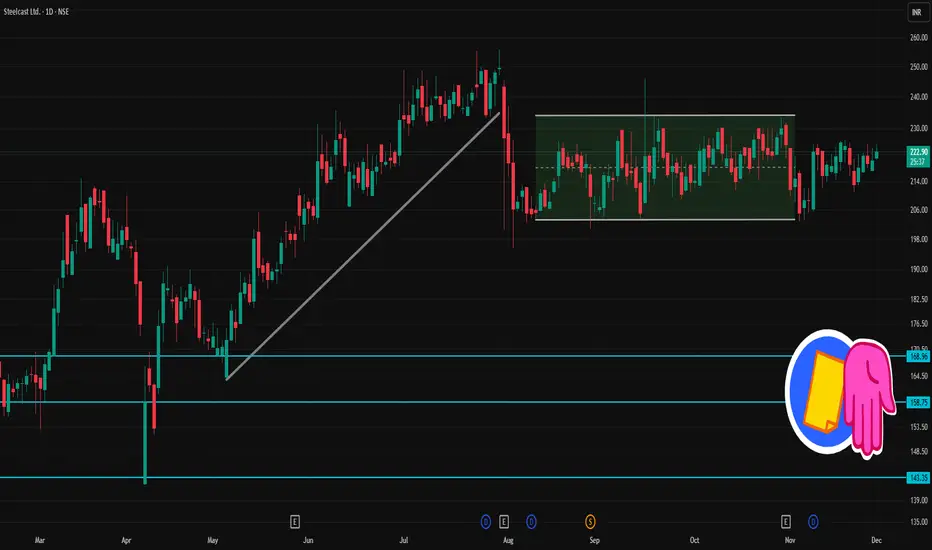
STEELCAS 1 Day Time FrameKey levels for Steelcast (STEELCAS)
📌 Resistance: ~ ₹223.7 (1st) and ~ ₹227.3 (2nd)
📌 Support: ~ ₹216.9 (1st) and ~ ₹213.7 (2nd)
📌 Pivot / reference price: ~ ₹220.5
Context / what this means
The stock opened around ₹221, traded between ₹221‑₹224.6 today.
As long as price stays above support (~₹216.9), the near‑term bias remains mildly positive; a move above resistance (~₹223.7–₹227.3) could bring some upside — possibly re‑testing recent upper range (near 52‑week high zone).
A break below support may push it toward lower support zone around ₹213–₹210.
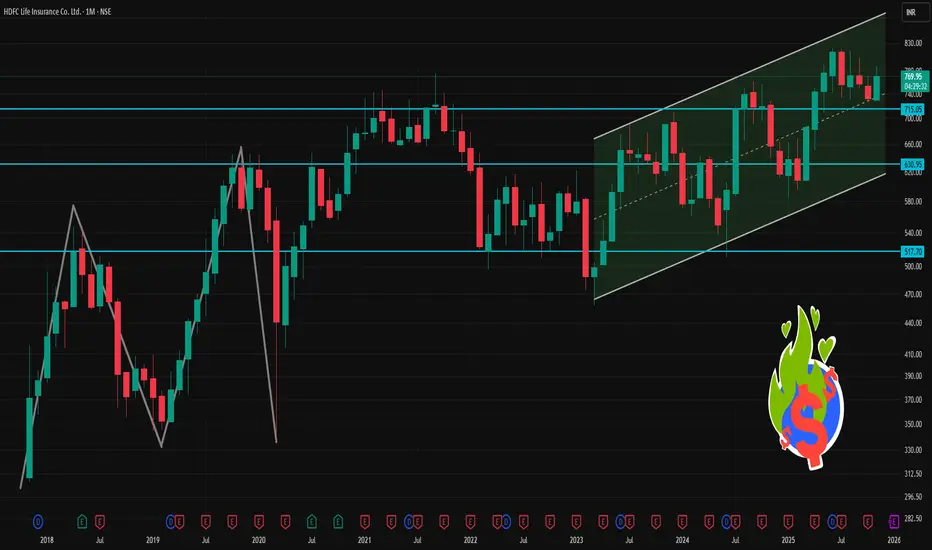
HDFCLIFE 1 Month Time Frame 📊 Current price & recent moves (1‑month)
As of 26 Nov 2025, the stock was trading at around ₹787.55.
As per another source on 28 Nov 2025, the price is ~ ₹772.40.
The 52‑week trading range is roughly ₹584.30 (low) to ₹820.75 (high).
Technical data suggests the share price is above its 50‑day and 200‑day simple moving averages — a sign of medium‑term strength.
🧮 What this “level view” indicates
The stock is currently closer to its 52‑week high than to its recent lows — indicating investor confidence or positive sentiment.
The 1‑month return is decent (6‑8%), attractive for short‑term holders/traders.
Support levels (around ₹730‑₹750) seem to be respected, which gives a cushion against sharp downside (unless broader markets disrupt).
The fact that price is above both 50-day and 200-day SMAs suggests the medium‑term trend remains bullish or at least stable.
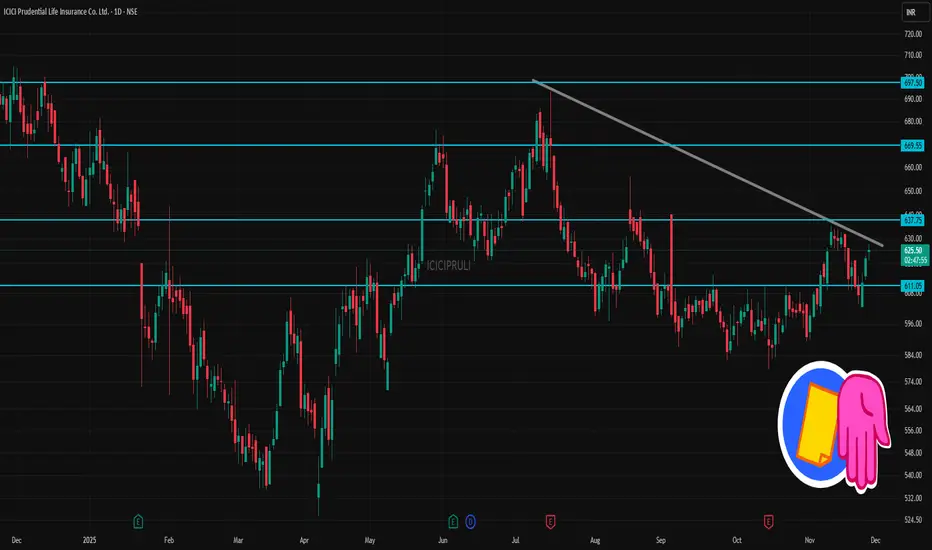
ICICIPRULI 1 Day Time Frame 📌 Latest Price & Context
Recent traded price: ~ ₹ 625–626.
52‑week range: Low ~ ₹525.80 — High ~ ₹704.70.
📈 What It Suggests (For 1‑Day / Short‑Term View)
As long as price remains above ~₹ 623–625, there is a short‑term bullish bias — next target could be ~₹ 630–635.
Dip toward ~₹ 615–620 could offer a buy‑on‑dip type entry (for traders), if volume and overall market sentiment stay supportive.
If price breaks below ~₹ 605–600, it may head toward the lower support zone — then caution/adapt strategy.
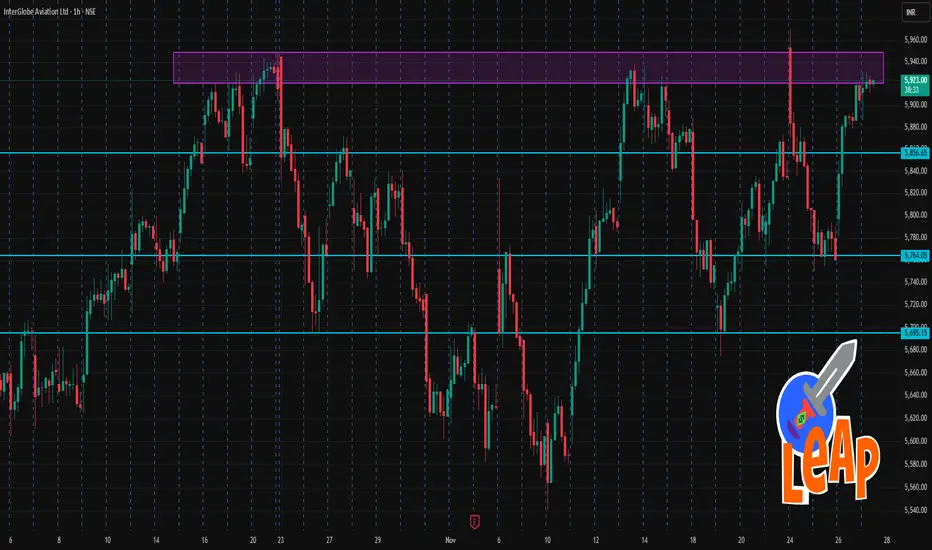
INDIGO 1 Hour Time Frame ✅ Current Price & Broad Trend
1. Latest publicly quoted price: around ₹5,916–₹5,923.
2. On a daily/mid‑term view, most technical indicators remain bullish: moving averages (50‑day, 200‑day) are supportive, and technical‑rating screens (on several platforms) show a “Strong Buy”.
📌 What it means on 1‑hour chart / near term
As long as price stays above the pivot (~₹5,872), the near‑term bias remains slightly bullish / range‑to‑upside.
A dip toward ~₹5,870–₹5,820 could act as a buyable support, while the ~₹5,730–₹5,820 zone is more “secondary buffer.”
On upside — a clear break above ~₹6,015–₹6,020 could target ₹6,100–₹6,200+ (near 52‑week high zone).
If price falls below ~₹5,820 decisively, then the risk increases of a deeper pullback toward ~₹5,730 or lower — but that’s a deeper intraday/swing‑trade scenario, not a baseline expectation.
LICHSGFIN 1 Day Time Frame 📍 Key Current Levels
The stock is trading around ₹ 550 (recent quotes ~₹ 548-550) on the NSE.
Pivot & major levels (from one source) on the daily:
Classic pivot: ~₹ 550.32
Support levels: ≈ ₹ 547.39 (S1), ≈ ₹ 542.02 (S2)
Resistance levels: ≈ ₹ 555.69 (R1), ≈ ₹ 558.62 (R2)
Longer-term moving averages: 50-day MA ≈ ₹ 559.47; 200-day MA ≈ ₹ 570.32 — both above current price, indicating downward pressure.
RSI and oscillator reading: RSI around ~41 (neutral/leaning oversold) per one data point.
🔍 Interpretation & What to Watch
With price below major moving averages (50 & 200 day), the bias remains bearish on the daily chart.
The pivot around ₹ 550 is a key level: holding above may help stabilise; falling below could signal more weakness.
Important support to watch: ~₹ 547 and then ~₹ 542. If these break, risk of further downside.
Key resistance: ~₹ 555-558 zone. A break up through that with volume could offer short-term upside.
The RSI being relatively low (though not deeply oversold) suggests potential for a rebound if positive trigger arises, but trend is not yet positive.
Because the broader trend remains negative, any bounce should be treated cautiously unless backed by strong volume and a clear breakout above that resistance zone.

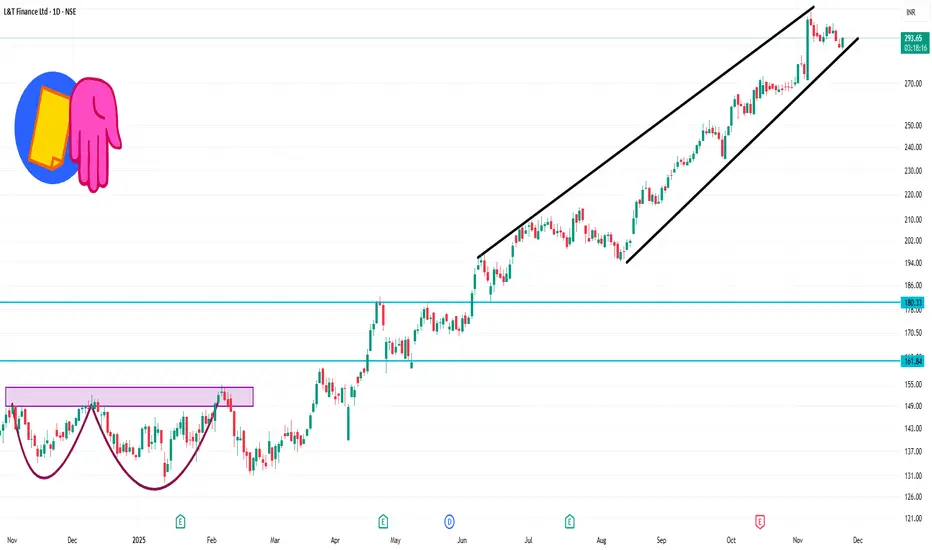
LTF 1 Day Time Frame 📊 Key Price Levels
Current price: ~ ₹ 289–294 per share.
Daily support zone: around ₹ 286–288.
Daily resistance zone: around ₹ 290–295+.
Pivot / central region: ~ ₹ 289.9 (~₹ 290).
✅ What to Watch
If price firmly rises above ~₹ 295, watch for the next resistance near ~₹ 300+ zone.
If price drops below ~₹ 286, support at ~₹ 280 & ~₹ 275 may come into play.
Volume and momentum—if breakout happens with strong volume, the move may have follow-through.
⚠️ Important Caveats
These levels are approximate and based on publicly available data. Market conditions can shift quickly.
Always combine technical levels with fundamentals, news, and broader market conditions.
Trading/investing carries risk—ensure your position size, stop-loss, and strategy align with your risk appetite.
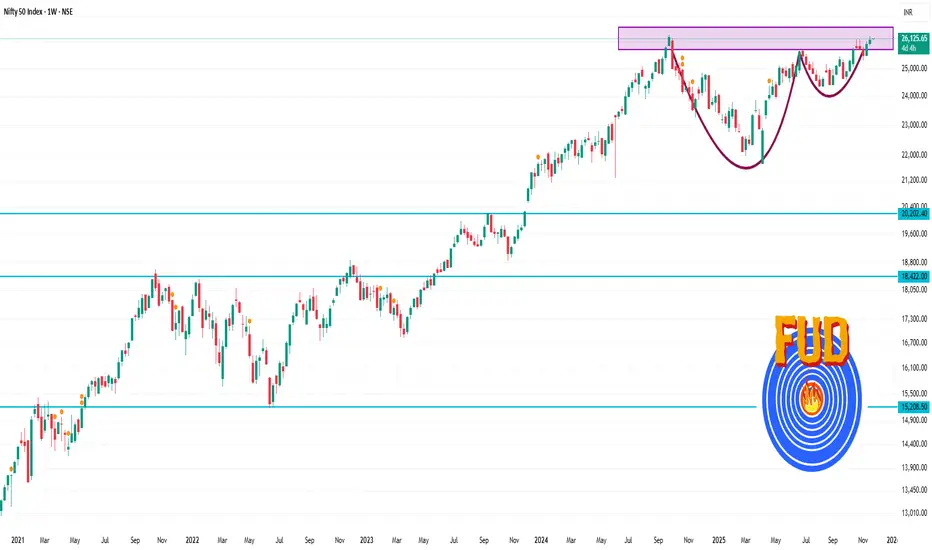
Nifty 50 1 Week Time Frame - Approximate value: ≈ 26,129.4 as of today.
- Weekly technical pivot support/resistance:
Weekly Bollinger Band top: ~ 26,166.78
Weekly Bollinger Band bottom: ~ 24,099.21
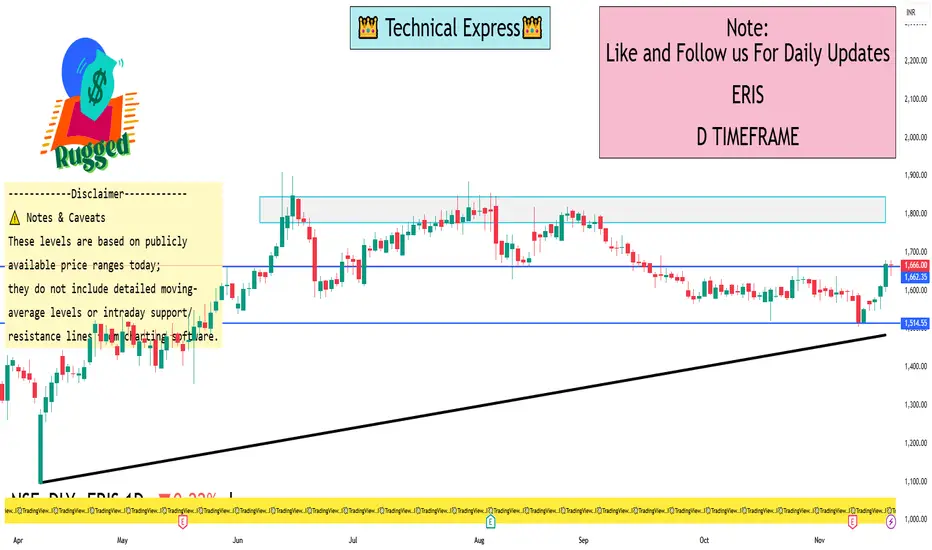
ERIS 1 Day View 📊 Current Price & Range
Last traded around ₹1,669 – ₹1,672
Today’s observed intraday range so far: Low ~ ₹1,651.6 and High ~ ₹1,679.2.
Previous close was ~ ₹1,669.60.
🔍 Key Technical Levels (1-Day)
Support levels to monitor:
1. ~ ₹1,650 mark – near today’s intraday low (~1,651).
2. A stronger buffer may lie around ₹1,620-1,630, given prior trading zones (though exact MA data not fully pulled).
3. If price breaks decisively below ~₹1,650, the next meaningful lower zone might be nearer the 52-week low area (~₹1,100) but that’s much further away.
Resistance levels to monitor:
1. Immediate resistance near today’s high ~ ₹1,679-1,680.
2. If momentum builds, next resistance around ~ ₹1,700-₹1,720 area.
3. The 52-week high (~₹1,910) remains well above current price and acts as long-term cap.
⚠️ Notes & Caveats
These levels are based on publicly available price ranges today; they do not include detailed moving-average levels or intraday support/resistance lines from charting software.
Always consider external risks: market sentiment, pharma sector news, regulatory updates, earnings surprises for Eris.
Short-term trading involves higher volatility and increased risk; these setups should be used with proper stop-losses and position sizing.
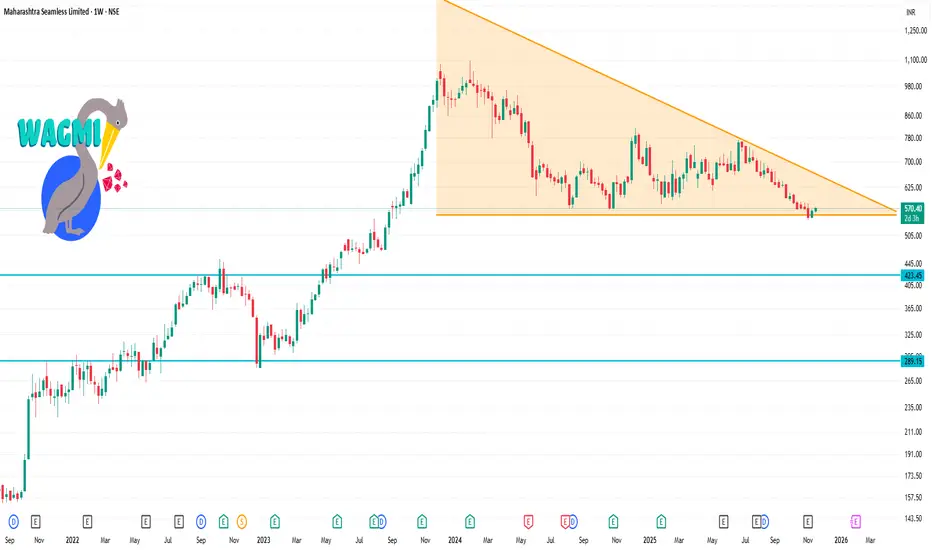
MAHSEAMLES 1 Week Time Frame 🔍 Current Price & Context
Latest price ~ ₹570 (on NSE as of today)
52-week low ~ ₹540.50, 52-week high ~ ₹814.30
On the daily technicals: recent signals show moving averages (shorter term) are positive, but the 200-day MA is still signalling “sell”.
📏 Weekly Timeframe Key Levels & Structure
Based on pivot-levels, support/resistance calculations and previous ranges:
Weekly pivot (Standard) around ~ ₹571.30
Support zone:
~ ₹557-560 region (S1) from pivot table.
A major structural support near ~ ₹540-550, given the 52-week low and previous reaction zone.
Resistance zone:
Immediate resistance ~ ~₹579-580 region (R1-R2) from weekly pivot table.
Broader resistance / upside hurdle near ~ ₹600+, and medium term near ~ ₹650-700+ (based on higher pivots & prior highs)
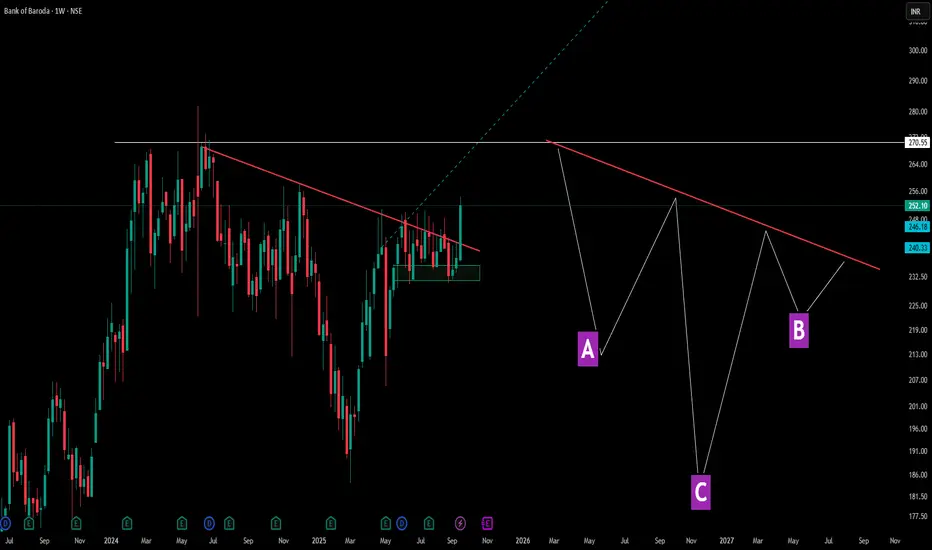
Decoding Angled Necklines in Inverted Head & ShouldersThis chart showcases a perfect example of how inverted head and shoulders patterns don't always follow textbook formations. Points A and B represent the shoulders, while C forms the deeper head—but notice the crucial difference: the neckline (red line) is tilted rather than horizontal.
Pattern Education Points:
- Traditional vs Reality: While many educational materials show horizontal necklines, real market patterns frequently display angled necklines, which are equally valid
-Shoulder Structure: The left shoulder (A) and right shoulder (B) don't need perfect symmetry—market patterns reflect actual supply and demand dynamics, not geometric precision
Market Structures:
- Before A, There was serious consolidation and then a Lower Low formation in the markets -> showcasing a dry volume dip and significant correction ( marking C ) as well as a result .
- Accompanied by a decent V shape recovery, tilted neckline is been touched again - showcasing market multi structure patterns are really important and there identification can lead to a decent trade idea
- later the next shoulder ( B ) gives solid consolidation but this time the dip is not solid unlike the normal Inverted HnS which makes the 2nd dip equal to the 1st shoulder dip here its a solid consolidation with small dip and a marubozu green candle after that .
Disclaimer: This content is for educational purposes and not financial advice. Always do your own research before making trading decisions.
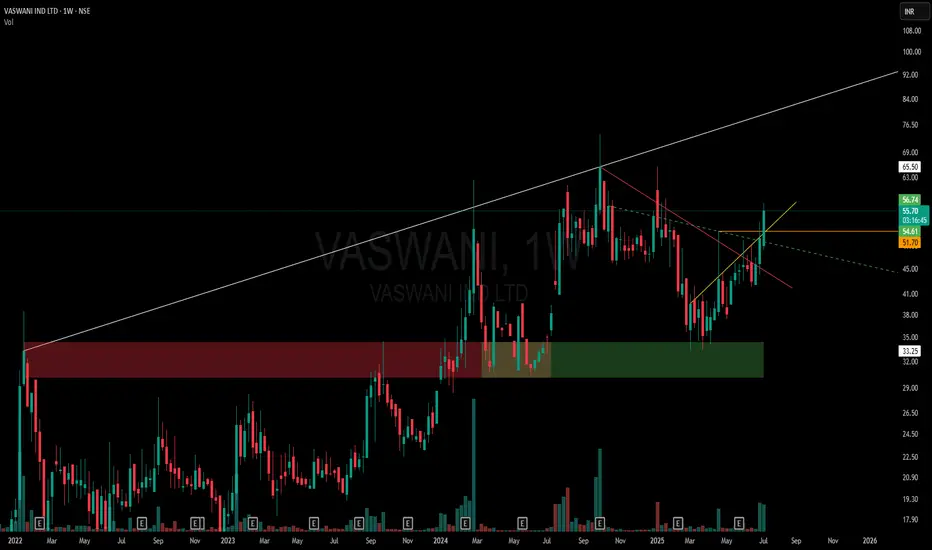
One-Sided Broadening Pattern | Pure Price Action Storytelling🔹 White Line: Captures the expanding higher-high resistance zone — part of the broader one-sided broadening pattern. Each new high is breaching the prior, giving the top side its expanding identity.
🔹 Horizontal Zone (Red to Green Shift): What once acted as a strong supply zone now flipped to a demand zone — price has respected this region multiple times, marking its evolution.
🔹 Red Line: A clean Counter-Trendline (CT) containing multiple touches, recently broken.
🔹 Yellow Line: A hidden diagonal resistance — tight and respected — offering another layer of confluence.
🔹 Green Dotted Line: Subtle hidden support built over time — watch how the structure was reacting along this line.
🔹 Orange Line: Marks wick-based rejection from a recent swing — subtle but clear evidence of supply exhaustion on that specific level.
🧠 This chart is not about predictions — it's about how beautifully price respects structure when drawn with logic and precision. Just charting. Just behavior. Just price.
RTNPOWER – A Classic Price Action Study Around Major Trendlines🟦 Dotted Blue Line
Represents the main counter trendline, stretched over a significant duration. Price has currently pushed above it, but the weekly candle is still open.
⬜ White Line (Hidden CT)
A hidden resistance line, drawn from key lower highs. Price is currently reacting near this line — acting as a logical area where sellers might test control ( for my setups )
🟨 Yellow Zones
These levels highlight higher lows, a sign of evolving structure. These bases often add context to the strength behind a breakout move.
🔴 Red Line (MTF Resistance)
Plotted from historical monthly rejection zones — a crucial area for confluence and reaction.
🛠️ Only sharing my Charting — no recommendations, no forecasting .

Support Flips, Trendline Snaps — Weekly Chart Speaks!A counter-trendline breakout (white line) is underway on the Weekly Time Frame (WTF), supported by strong structural confluences:
🔹 Pattern size is substantial, with price consolidating for several months before breakout.
🔹 The yellow zone represents a prior support, which later broke down — now acting as a resistance-turned-breakout zone, a classic supply flip.
🔹 Recent breakout candle shows strength, emerging after taking support from the 200 DEMA, reinforcing the base.
🔹 MTF resistance (dashed yellow line) is marked — remains the next significant obstacle on higher timeframes.
No trading/investment advice. Purely educational .

Price Action Case Study: Weekly Price action chart of SIGACHI 🔹 Key Structural Elements:
-White Solid Line: Primary Counter-Trendline (CT) connecting multiple swing highs, acting as dynamic resistance over several months.
-White Dotted Lines: Hidden supply lines derived from intermediary highs, often acting as secondary resistance.
-Yellow Lines: Higher timeframe resistance zones (MTF) — offering confluence markers for potential supply zones ahead.
🔹Volume Expansion:
The breakout candle is supported by significant volume (~36M), indicating strong participation. Volume here acts as a confirmation trigger, suggesting institutional interest or broad-based buying.
🔹Structure:
The breakout occurs after an extended consolidation and a series of higher lows.

CCL - Beautiful Chart Structure Post Q4NSE:CCL made a Beautiful Chart Structure today after Q4 Results.
Keep in the Watchlist.
NO RECO. For Buy/Sell.
Disclaimer: "I am not a SEBI REGISTERED RESEARCH ANALYST AND INVESTMENT ADVISER."
This analysis is intended solely for informational and educational purposes and should not be interpreted as financial advice. It is advisable to consult a qualified financial advisor or conduct thorough research before making investment decisions.
