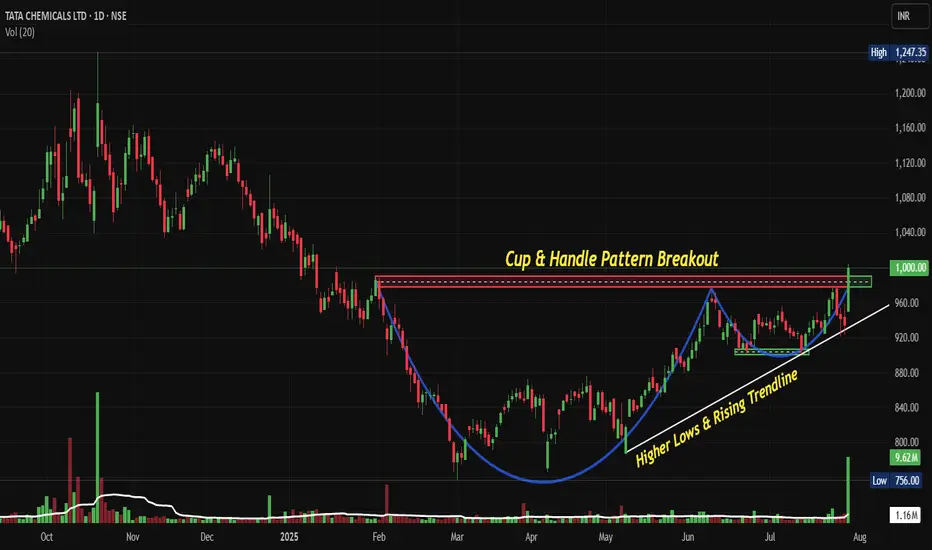
TATACHEM: Breaks out of Cup & Handle Breakout Post Q1 FY 26NSE:TATACHEM Breaks Out: The Cup and Handle Formation That Could Signal New Highs Post Good Q1 FY 26 with Margin Expansion.
Price Action:
Trend Structure
• Long-term uptrend intact with a higher lows pattern since March 2025
• Strong momentum breakout above key resistance at 1,000 levels
• Price action showing bullish continuation after brief consolidation
• Current trading above all major moving averages (20, 50, 200 EMA)
Breakout Characteristics
• Clean breakout above resistance
• Volume expansion confirming institutional participation
• No immediate rejection at breakout level, suggesting strength
• Momentum favouring further upside continuation
Volume Spread Analysis:
Volume Pattern:
• Significant volume spike during the breakout phase in July 2025
• Volume contraction during handle formation (typical healthy pattern)
• Above-average volumes during cup formation, indicating accumulation
• Recent volume expansion suggests institutional buying interest
Volume Confirmation:
• Breakout supported by 2-3x average daily volume
• Previous resistance turning into support with volume backing
• Accumulation-distribution pattern favourable for continued upside
Chart Pattern:
• The chart displays a classic Cup and Handle pattern formation spanning from Jan 2025 to July 2025
• The "Cup" formation shows a rounded bottom with the low around 750-780 levels during March 2025
• The "Handle" represents the consolidation phase between June-July 2025, around 920-960 levels
• Clear breakout above the 1,000 resistance level with strong volume confirmation
Key Technical Levels
• Primary Support: 920-950 (handle low and recent consolidation)
• Secondary Support: 850-880 (mid-cup level)
• Major Support: 750-780 (cup bottom)
• Immediate Resistance: 1,050-1,080 (psychological levels)
• Target Resistance: 1,200-1,250 (measured move from cup depth)
Trade Setup and Strategy:
Entry Levels:
• Aggressive Entry: 1,000-1,020 (on breakout confirmation)
• Conservative Entry: 950-980 (on pullback to handle support)
• Scale-in Entry: 920-950 (major support retest)
Exit Levels:
• Target 1: 1,100-1,120 (initial resistance cluster)
• Target 2: 1,200-1,250 (measured move target)
• Target 3: 1,300-1,350 (extension target based on cup depth)
Stop-Loss Strategy:
• Initial Stop-Loss: 920 (below handle low)
• Trailing Stop: 950 after Target 1 achievement
• Risk-Reward Ratio: 1:3 to 1:4 on conservative entry
Position Sizing and Risk Management:
Position Sizing:
• Allocate 2-3% of portfolio for this trade
• Calculate position size based on stop-loss distance
• Consider scaling in approach for better average entry
Risk Management:
• Maximum risk per trade: 1-2% of total capital
• Use position sizing formula: Risk Amount ÷ (Entry - Stop Loss)
• Maintain diversification across sectors and market caps
Risk Factors:
• Broader market correction could impact individual stock performance
• Sector-specific headwinds in the chemicals industry
• Global economic slowdown affecting demand
Fundamental and Sectoral Backdrop:
Recent Financial Performance:
• Q1 FY26 results showed consolidated revenue of ₹3,719 Cr with EBITDA of ₹649 Cr and PAT of ₹316 Cr
• Standalone revenue at ₹1,169 Cr, up 11.65% compared to Q1FY25, with PAT of ₹307 Cr, up 20%
• Stock gained 16.66% over the last three months
• Strong operational performance supporting technical breakout
Sectoral Outlook:
• The Chemicals market in India is projected to grow by 3.46% (2025-2029), resulting in a market volume of US$35.4bn in 2029
• India's speciality chemicals market is expected to increase at a CAGR of 12% to US$64 billion by 2025
• The chemical industry, currently valued at around US$250 billion, aims to grow to US$300 billion by 2025
• The sector is projected to grow by 11 to 12 per cent during 2021–27, tripling its global market share by 2040
Investment Thesis:
• Strong sectoral tailwinds supporting long-term growth
• Company's positioning in the speciality chemicals segment
• Potential beneficiary of India's manufacturing growth story
• Technical breakout aligning with fundamental strength
Key Monitoring Points:
Technical Triggers:
• Sustain above 1,000 levels for breakout confirmation
• Volume patterns on any pullbacks
• Price action at target levels for profit booking decisions
Fundamental Catalysts:
• Quarterly earnings performance and guidance
• New project announcements or capacity expansions
• Sectoral policy developments and government initiatives
• Global chemical prices and demand trends
Risk Monitoring:
• A break below 920 levels would invalidate the bullish setup
• Broader market sentiment and global risk-off scenarios
• Sector rotation away from chemicals and industrials
• Company-specific news flow and management commentary
My Take:
The combination of technical breakout, strong fundamentals, and positive sector outlook makes NSE:TATACHEM an attractive investment proposition at current levels, with the cup and handle pattern suggesting potential for significant upside over the next 6-12 months.
Keep in the Watchlist and DOYR.
NO RECO. For Buy/Sell.
📌Thank you for exploring my idea! I hope you found it valuable.
🙏FOLLOW for more
👍BOOST if you found it useful.
✍️COMMENT below with your views.
Meanwhile, check out my other stock ideas on the right side until this trade is activated. I would love your feedback.
Disclaimer: "I am not a SEBI REGISTERED RESEARCH ANALYST AND INVESTMENT ADVISER."
This analysis is intended solely for informational and educational purposes and should not be interpreted as financial advice. It is advisable to consult a qualified financial advisor or conduct thorough research before making investment decisions.
Chemicalsector
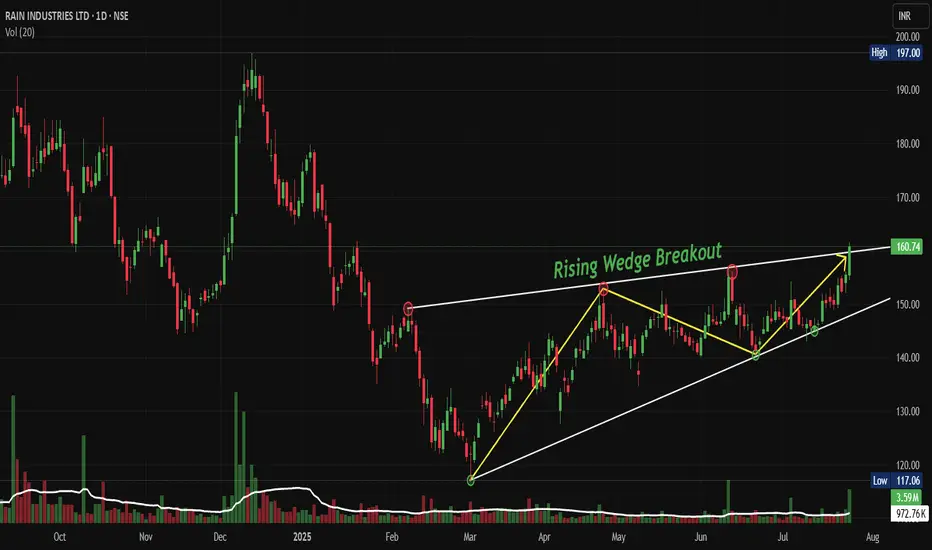
RAIN: Breaks Out of Rising Wedge Pattern Signals Fresh UptrendNSE:RAIN Breaks Out: Rising Wedge Pattern Signals Potential Bullish Run to 180+ Levels
Signals Fresh Uptrend After Months of Consolidation
Price Action:
- NSE:RAIN has been trading within a well-defined rising wedge pattern since March 2025
- The stock has recently broken out above the upper trendline of the wedge at approximately 160 levels
- Current price of 160.74 represents a significant move above the key resistance zone
- The breakout is accompanied by increased volume, suggesting genuine buying interest
Volume Spread Analysis:
• Volume breakout accompanied the wedge pattern breakout
• Higher volumes during up moves compared to down moves indicate bullish participation
• Volume spike visible during the recent breakout at 160+ levels
• Average volume of 972K around today, 3.59M shares with recent surge to higher levels
Base Formation and Accumulation Zone:
• The stock established a strong base between 117-125 levels from March to July 2025
• Multiple retests of the 117 support level showed strong buying interest
• Base formation lasted approximately 4 months, indicating thorough accumulation
• Volume during base formation remained relatively stable with occasional spikes
Key Support and Resistance Levels:
• Primary Support: 117.06 (marked as swing low and base support)
• Secondary Support: 140-145 zone (previous resistance turned support)
• Immediate Resistance: 165-170 zone (next major hurdle)
• Target Resistance: 180-185 zone (measured move target)
• 52-week High: 197.00 (ultimate resistance level)
Technical Patterns:
Rising Wedge Breakout Pattern:
• Clear rising wedge pattern formed over 4-5 months
• Lower highs and higher lows converged into a wedge formation
• Breakout occurred at 160+ levels with strong volume confirmation
• Pattern suggests continuation of the broader uptrend
Trend Analysis:
• Long-term trend: Bullish (higher highs and higher lows since March 2025)
• Medium-term trend: Bullish breakout from consolidation
• Short-term trend: Strong bullish momentum post-breakout
• Moving averages alignment suggests sustained upward momentum
Chart Patterns and Indicators:
• Cup and handle formation visible in the broader timeframe
• Multiple flag patterns during the consolidation phase
• Price above all key moving averages, indicating bullish sentiment
Trade Setup and Strategy:
Entry Levels:
• Aggressive Entry: 155-160 levels (on any minor pullback)
• Conservative Entry: 145-150 levels (on deeper retracement to support)
• Breakout Entry: Above 165 levels with volume confirmation
• averaging between 150-160 for position building
Exit Levels and Targets:
• Target 1: 180-185 levels (initial profit booking - 15-20% upside)
• Target 2: 195-200 levels (testing previous highs - 25-30% upside)
• Target 3: 220-230 levels (extended target - 40-45% upside)
• Swing high exit: Trail stops below key support levels
Stop-Loss Strategy:
• Initial Stop-Loss: Below 140 levels (10-12% risk from current levels)
• Trailing Stop-Loss: Below 150 levels once 180 is achieved
• Pattern Stop-Loss: Below the wedge support around 145 levels
• Time-based stop: Exit if no progress in 2-3 months
Position Sizing and Risk Management:
• Maximum position size: 2-3% of total portfolio
• Risk per trade: Not more than 1% of portfolio value
• Scale in approach: 50% at entry, 30% on dip, 20% on breakout confirmation
• Maintain a risk-reward ratio of a minimum of 1:3
Sectoral and Fundamental Backdrop:
Company Overview:
• NSE:RAIN is one of the world's largest producers of calcined petroleum coke, coal tar pitch and other high-quality basic and speciality chemicals
• Market Cap: 5,405 Crore with Revenue: 15,472 Cr
• Promoter Holding: 41.2% indicating stable management control
Financial Health Assessment:
• The company has a low interest coverage ratio, which poses some financial risk
• Net Profit: ₹-115.10Cr as on March 2025 (Q4 FY25) showing current losses
• The company has delivered a poor sales growth of 4.46% over the past five years
• Recent debt reduction efforts as management focuses on prepaying obligations
Business Segments Performance:
• Carbon Business: Environment-friendly and energy-efficient practices have made RAIN's carbon business highly profitable and sustainable
• The carbon business co-generates energy at six calcined petroleum coke plants with a combined power-generation capacity of approximately 135 MW
• The speciality chemicals segment is showing resilience despite market challenges
Sector Outlook and Industry Trends:
• In 2025, the industry is expected to continue its recovery, adjusting to new market drivers while balancing short- and long-term goals
• Chemical industry focusing on decarbonization and innovation initiatives
• India Ratings affirms Rain Industries' credit rating at IND A/Stable with stable outlook and improved operational outlook
Key Risk Factors:
• Cyclical nature of the chemical industry affecting margins
• High debt levels and interest coverage concerns
• Global economic slowdown has an impact on demand
• Raw material price volatility
• Environmental regulations affecting operations
Positive Catalysts
• Debt reduction strategy showing management commitment
• Stable credit rating with improved operational outlook
• Strong technical breakout indicating renewed investor interest
• Global chemical industry recovery supporting sector sentiment
• Energy co-generation capabilities providing cost advantages
Risk Assessment and Monitoring:
Key Levels to Watch:
• Break below 145: Bearish signal, consider exit
• Sustain above 165: Bullish confirmation for higher targets
• Volume patterns: Declining volume on up moves would be concerning
• Sector rotation: Monitor chemical sector performance relative to the broader market
Regular Review Parameters:
• Weekly closing above key moving averages
• Monthly volume trends and institutional participation
• Quarterly earnings performance and guidance
• Industry developments and regulatory changes
• Management commentary on debt reduction progress
Exit Triggers:
• Fundamental deterioration in business metrics
• Break of key technical support levels
• Adverse sector developments
• Better opportunities in other stocks/sectors
• Achievement of target levels with profit booking
My Take:
NSE:RAIN presents a technically attractive setup with the rising wedge breakout, but investors should be cautious about the fundamental challenges. The trade setup offers good risk-reward ratios for short to medium-term positions, while long-term investors should wait for clearer signs of fundamental improvement.
Keep in the Watchlist and DOYR.
NO RECO. For Buy/Sell.
📌Thank you for exploring my idea! I hope you found it valuable.
🙏FOLLOW for more
👍BOOST if you found it useful.
✍️COMMENT below with your views.
Meanwhile, check out my other stock ideas on the right side until this trade is activated. I would love your feedback.
Disclaimer: "I am not a SEBI REGISTERED RESEARCH ANALYST AND INVESTMENT ADVISER."
This analysis is intended solely for informational and educational purposes and should not be interpreted as financial advice. It is advisable to consult a qualified financial advisor or conduct thorough research before making investment decisions.
Hikal Ltd. - Base Breakout above 412#Hikal Ltd. Base Breakout on sustained close above 412. CMP 403.85.
Resistance at 477/544/667 for expected level of life high 742 & beyond. Long Term Trade. View negated below 365. Q2 FY25 EBITDA Margin improved on YoY & QoQ basis released on 12/Nov/24. Management needs to deliver in future as per the investor presentation.
#TMPV #StockInvesting #ChemicalSector #PharmaSector #AgroChemical #TechnoFunda #SmartEye

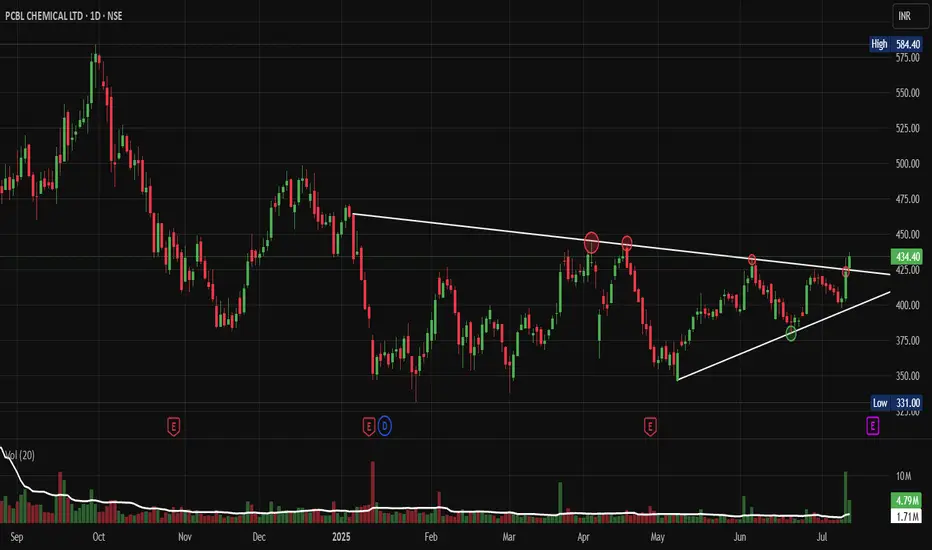
PCBL: The Sleeping Giant Ready to BreakOut of Its TriangleNSE:PCBL : The Sleeping Giant Ready to Break Out of Its Consolidation Triangle
Price Action Analysis:
• Stock has been trading in a well-defined ascending triangle pattern since early 2025
• Current price at ₹434.40 represents a +2.53% gain, showing bullish momentum
• The pattern shows a higher low formation with resistance around ₹450-460 levels
• Recent price action suggests an accumulation phase with controlled volatility
Volume Spread Analysis:
• Volume has been consistently above average during recent sessions (4.79M vs 1.71M average)
• Volume spike visible in recent trading sessions, indicating increased institutional interest
• The volume pattern supports the price consolidation with periodic accumulation phases
• Higher volume during up-moves compared to down-moves suggests buying interest
Key Technical Levels:
Support Levels:
• Primary Support: ₹420-425 (recent swing low)
• Secondary Support: ₹390-395 (ascending trendline support)
• Major Support: ₹360-370 (previous consolidation zone)
Resistance Levels:
• Immediate Resistance: ₹450-460 (triangle upper boundary)
• Key Resistance: ₹480-490 (previous highs)
• Major Resistance: ₹520-530 (psychological level)
Base Formation:
• The stock has formed a strong ascending triangle base over 6-7 months
• Base depth of approximately 15-20% from highs to lows
• Duration suggests a sustainable breakout when it occurs
• Base shows characteristics of institutional accumulation
Technical Patterns:
• Primary Pattern: Ascending Triangle (Bullish)
• Secondary Pattern: Flag formation on shorter timeframes
• Volume-Price Relationship: Positive divergence during recent consolidation
• Moving Average Setup: Price trading above all its key moving averages
Trade Setup:
Entry Strategy:
• Breakout Entry: ₹465-470 (above triangle resistance with volume confirmation)
• Pullback Entry: ₹440-445 (on any dip to support with volume)
• Accumulation Entry: ₹420-430 (for longer-term investors)
Exit Levels:
• Target 1: ₹520-530 (measured move from triangle base)
• Target 2: ₹580-590 (previous swing high zone)
• Target 3: ₹650-680 (extension target based on base depth)
Stop-Loss Levels:
• For Breakout Trades: ₹445-450 (below breakout level)
• For Accumulation Trades: ₹410-415 (below key support)
• Trailing Stop: Use an 8-10% trailing stop after the first target
Position Sizing:
• Conservative Approach: 2-3% of portfolio
• Moderate Approach: 3-5% of portfolio
• Aggressive Approach: 5-7% of portfolio (only for experienced traders)
Risk Management:
• Risk-Reward Ratio: Minimum 1:2 for all trades
• Maximum risk per trade: 2% of total capital
• Use the position sizing calculator based on stop-loss distance
• Avoid adding to losing positions
• Book partial profits at each target level
Sectoral Backdrop:
Chemical Sector Overview:
• Indian chemical sector showing strong fundamentals with export growth
• The speciality chemicals segment is experiencing robust demand
• The government's PLI scheme supports domestic chemical manufacturing
• Global supply chain diversification benefiting Indian chemical companies
Industry Trends:
• Increasing demand for agrochemicals and pharmaceutical intermediates
• Focus on sustainable and green chemistry practices
• Rising input costs are being managed through pricing power
• Strong export opportunities in speciality chemicals
Fundamental Backdrop:
Company Overview:
• NSE:PCBL is a leading player in speciality chemicals and carbon black
• Strong presence in the tire industry through carbon black manufacturing
• Diversified product portfolio, reducing concentration risk
• Established relationships with major tire manufacturers
Financial Highlights:
• Consistent revenue growth over the past few quarters
• Improving margin profile due to operational efficiency
• Strong balance sheet with manageable debt levels
• Increasing return on equity and asset efficiency
Growth Drivers:
• Expanding tire industry in India and globally
• New product launches in speciality chemicals
• Capacity expansion plans for key products
• Focus on high-margin speciality products
Risk Factors:
• Raw material price volatility
• Environmental regulations compliance costs
• Competition from global players
• Cyclical nature of the tire industry
My Take:
NSE:PCBL presents a compelling technical setup with its ascending triangle pattern nearing completion. The combination of strong volume accumulation, supportive sectoral trends, and improving fundamentals creates a favourable risk-reward scenario. Traders should wait for a decisive breakout above the ₹465 levels, accompanied by volume confirmation, for optimal entry. Meanwhile, investors can consider gradual accumulation at current levels, exercising proper risk management.
Keep in the Watchlist.
NO RECO. For Buy/Sell.
📌Thank you for exploring my idea! I hope you found it valuable.
🙏FOLLOW for more
👍BOOST if you found it useful.
✍️COMMENT below with your views.
Meanwhile, check out my other stock ideas on the right side until this trade is activated. I would love your feedback.
Disclaimer: "I am not a SEBI REGISTERED RESEARCH ANALYST AND INVESTMENT ADVISER."
This analysis is intended solely for informational and educational purposes and should not be interpreted as financial advice. It is advisable to consult a qualified financial advisor or conduct thorough research before making investment decisions.
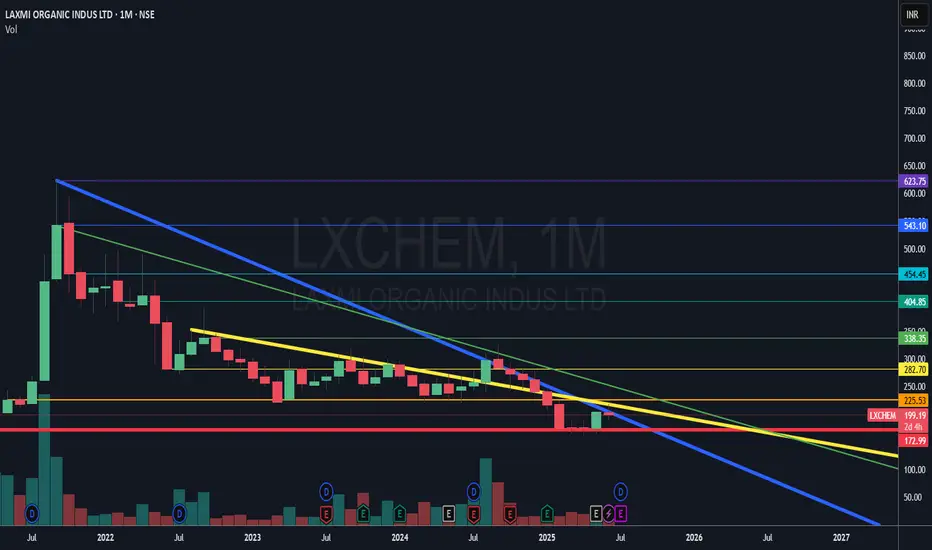
"growth partner of choice"Laxmi Organic Industries Ltd: CMP 199
Update: The previous breakout attempt didn’t hold, but the chart is showing renewed strength. Most chemical stocks are looking strong, indicating sector-wide momentum. Volume has started picking up again, which is a positive sign. Although the risk-to-reward ratio is currently limited, a decisive breakout and monthly close above ₹230 could confirm a trend reversal and open up significant upside potential. Watching closely for confirmation.
Global Tariff Relief? These Indian Equities Could Shine Bright!Hello Traders!
Big news from the global front — talks of tariff relief between major economies are heating up again. If these discussions progress, it could bring a wave of positivity across the global markets. More importantly, India stands to benefit as a strong alternative in the supply chain realignment story. So let’s explore which Indian sectors and stocks may shine the brightest if this global tariff relaxation becomes reality.
Why Tariff Relief Could Boost Indian Equities
Lower Global Tensions = Higher Risk Appetite: Markets generally rally when trade tensions reduce, boosting FII confidence.
India as a Trusted Export Partner: Global firms are shifting away from China. Tariff easing may boost Indian exports in sectors like textiles, pharma, and chemicals .
Better Margins for Exporters: Reduced tariffs mean better profitability for Indian companies with international exposure.
Sectors to Watch if Tariffs Ease Globally
Textiles & Apparel: India could become a preferred manufacturing hub.
Specialty Chemicals: Key beneficiary as India already replaces China in global supply chains.
Pharmaceuticals: Low-cost, high-quality drugs from Indian firms may find smoother access to developed markets.
Auto Ancillaries & Electronics Manufacturing: Benefit from stable trade policies and global outsourcing.
Rahul’s Tip
Tariff relief = margin relief. Focus on companies with strong exports, lean cost structures, and consistent order books. That’s where the real swing is.
Conclusion
While global headlines may seem distant, their impact on Indian markets is direct and powerful. With global tariff relief on the table, sectors like textiles, chemicals, and pharma are likely to benefit first. Keep an eye on these sectors — and get ready to ride the trend if it confirms.
What are your top stock picks for a global trade bounce-back? Let’s chat in the comments!

Specialty Chemicals Sees Sharp Rise on Refrigerant Price Hike◉ Key Takeaways
● The phasing down of HFCs in the U.S. is driving significant changes in the refrigerant market.
● Indian specialty chemicals companies, particularly those involved in refrigerant production, are poised to benefit from this market shift.
● The demand-supply imbalance in the refrigerant gas segment is expected to persist, creating favourable conditions for industry growth.
◉ Introduction
On January 9, 2025, the Indian specialty chemicals sector witnessed a significant surge, driven by a sharp increase in refrigerant gas prices. This surge was primarily attributed to the phasing down of hydrofluorocarbons (HFCs) in the United States, as mandated by the U.S. Environmental Protection Agency (EPA).
◉ Market Dynamics
● Phasing down HFCs: The EPA aims to reduce hydrofluorocarbon (HFC) emissions by 85% over the next 15 years. This will impact the production and pricing of refrigerants.
● Refrigerant price increases: As HFC production declines, prices for existing refrigerants like R-410A and R-22 may rise. This could lead to higher costs for consumers and businesses.
● New refrigerant alternatives: The industry is shifting towards alternative refrigerants with lower global warming potential (GWP), such as R-32, R-454B, and R-1234yf. These alternatives may become more widely adopted and affordable.
◉ Impact on Indian Companies
The surge in refrigerant gas prices significantly benefited leading Indian players:
● SRF NSE:SRF and Navin Fluorine NSE:NAVINFLUOR : These companies were prominent beneficiaries, witnessing a remarkable 14% increase in their stock prices.
● Financial Gains: Analysts estimate that every $1/kg increase in R32 prices could boost SRF's EBITDA by ₹260 crore and Navin Fluorine's by ₹77 crore.
● Capacity Expansion: With SRF's production capacity for R32 at approximately 29,000 to 30,000 tons and plans for Navin Fluorine to double its capacity from 4,500 tons to 9,000 tons by February 2025, both companies are well-positioned to capitalize on this market shift.
◉ Wider Market Impact
The price hike triggered a broader rally in the specialty chemicals sector, with companies like Balaji Amines NSE:BALAMINES and Alkyl Amines NSE:ALKYLAMINE also witnessing stock price increases.
◉ Future Outlook
As the U.S. transitions to more environmentally friendly refrigerants, the dynamics of supply and pricing for these alternatives are likely to continue evolving. This evolving landscape presents significant opportunities for Indian specialty chemicals companies that are well-positioned to capitalize on the growing demand for these new-generation refrigerants.

Positional Long : Aarti Industries
Aarti Industry has given a good correction of ~64% from its top due to weakness in its energy business, drop in Mono Methyl Aniline (MMA) margins ,and is trading near a important support area i.e 400 level.
Currently its following a descending channel pattern and has formed a double bottom pattern.
Earlier price has formed a Head & Shoulder pattern, & price descended ~25% which was due as per the H&S Pattern.
Given the headwinds looks like a good positional buy with a staggered accumulation approach in major dips.
⚡Note: This is just for analysis purpose, please do your own research before punching any orders.
🔍 For more technical analysis and trade setups, make sure to follow me on trading view.
🔗 Trading View: in.tradingview.com/u/DebasisT/

BODALCHEMBODALCHEM is on strong support on long term (M) chart. Stock is in range since long. Currently available at very good risk-return. 65 seems very strong support. So closing below 65 may change my view. Some action in chemical sector may start momentum soon. Keep it on radar.

GSFC | Trendline + Resistance BO | Double Bottom For Education Purpose only!!!!
✅GSFC is a key player in fertilizers and industrial chemicals, but recent financials suggest challenges in growth and efficiency. Suitable for risk-averse investors seeking dividends, but requires deeper analysis for growth prospects.
⭕️ Swing Trading opportunity: Price Action Analysis Alert !!!⭕️
⚠️Buy on most timeframes, with positive indicators supporting upward movement
⚡️Strong "buy" signal from exponential and simple moving averages over medium and long durations
🎯Stock is in an uptrend with bullish signals from longer-term moving averages (50-day and 200-day moving averages)
✅Check out my TradingView profile to see how we analyze charts and execute trades.
💡✍️Technical Analysis:-
✅Trendline BO
✅Resistance BO
✅Range BO
✅Strong Demand Zone
🙋♀️🙋♂️If you have any questions about this stock, feel free to reach out to me.
📍📌Thank you for exploring our idea! We hope you found it valuable.
🙏FLLOW for more !
👍LIKE if useful !
✍️COMMENT Below your view !

Sharda Cropchem for 60% gainsDate: 11 Nov’24
Symbol: SHARDACROP
Timeframe: Daily
Sharda Cropchem seems to be in Wave III of 3 which is heading towards 1350 (~60% from current price of 800) as seen in the chart. Wave 3 could even extend to 1500 which can be reviewed after closing above 1100 in Wave V of 3. Recent Q2 results are good with better margins compared to last FY.
This is not a trade recommendation. Please do your own analysis. And I have the right to be wrong.
HINGLISH VERSION
Jaisa ki chart mein dekha gaya hai, Sharda Cropchem 3 ke Wave III mein dikh raha hai jo 1350 (800 ki maujooda keemat se ~60%) ki taraf badh raha hai. Wave 3 1500 tak bhi jaa sakta hai; jiskee sameeksha 3 ke Wave V mein 1100 se upar band hone ke baad ki jaa sakti hai. Pichhle FY ki tulana mein behatar margin ke saath haal ke Q2 ke nateeje achchhe hain.
Yah koi trade lene ya nivesh karne ki salah nahin hai. Kripya apna vishleshan svayan karen. Aur mujhe galat hone ka adhikaar hai.

Epigral Ltd for 30%+ gains; Strong Q2 resultsDate: 10 Nov’24
Symbol: EPIGRAL
Timeframe: Daily
Epigral (formerly known as Meghmani Finechem) seems to be in Wave V of 3 which is heading towards 2800 (33% from current price of 2100) as seen in the chart. There is a possibility of Wave V extending to 3000 which we can assess once it closes above 2500. Let’s keep a stop loss at 1840 on closing basis. Q2FY25 results on Saturday were good so the run up should continue.
This is not a trade recommendation. Please do your own analysis. And I have the right to be wrong.
Epigral (jise pehle Meghmani Finechem ke naam se jaana jaata tha) 3 ke Wave V mein hai aisa lagta hai jo 2800 (2100 kee vartamaan keemat se 33%) ki taraf badh raha hai jaisa ki chart mein dekha gaya hai. Wave V ke 3000 tak badhane ki sambhaavana hai jiska aakalan hum 2500 se upar band hone par kar sakte hain. 1840 ke neeche closing basis stop loss rakhein. Shanivaar ko Q2FY25 ke nateeje achhe rahe to teji jaari rehni chahiye.
Yah koi trade lene ki salah nahin hai. Kripya apana vishleshan khud karein. Aur mujhe galat hone ka adhikaar hai.

Jubilant Ingrevia for 60%+ gainsDate: 3 Oct’24
Stock: Jublingrea
Timeframe: Daily chart
Jubilant Ingrevia seems to be in Wave III of 3 which is heading towards 1300+ (60%+ from current price of 810) as seen in the chart. Wave III could end around 940 and Wave IV could correct to 750 levels (returns would be even higher if entered at the end of Wave IV of 3). High volume and strong RSI support this stance.
If the industry tailwinds remain, it won’t surprise me if the target is done in a year’s time.
This is not a trade recommendation. Please do your own analysis.
Jubilant Ingrevia 3 ke Wave III mein dikh raha hai jo 1300+ (800 ki vartamaan keemat se 60%+) kee taraf badh raha hai jaisa ki chart mein dikh raha hai. Wave III 940 ke aas-paas samaapt ho sakta hai aur Wave IV 750 ke star tak neeche aa sakta hai (yadi 3 ke Wave IV ke ant mein entry ki jaye to return aur bhee adhik hoga). Adhik volume aur majaboot RSI is trend ka samarthan karate hain.
Yadi sector mein teji kee sthiti banee rahee, to yah koee aascharya kee baat nahin hogee yadi lakshya ek varsh ke bheetar poora ho jae.
Yeh koi invest karne ki hitaayad nahin hai. Kripya apana analysis khud karein.

AARTIIND: Reversal! Hidden bullish divergenceAARTIIND can be a good reversal candidate. You can enter with a small SL at the low of 558. Targets can reach upto 750-800-900-950.
NOTE: I'm not a SEBI REG. Study before investing.

Fourth largest manufacturer of Chlor-Alkali has given breakoutHello Everyone, i hope you all will be doing good in your trading and your life as well, i have brought another stock from chemical sector which produces Chloralkalis: Caustic Soda Lye and Flakes, Liquid Chlorine, Hydrogen, Caustic Potash Lye and Flakes, etc. Company belongs from solid fundamentally Meghami Group. it is the fourth largest manufacturer of Chlor-Alkali in India.
Stock has already given breakout of Triangle Pattern on weekly timeframe and after retesting the breakout level stock has given breakout of neckline of previous highs. Now there is high probability stock should fly from here towards our given targets on charts. Stock is good to hold for long term also, this can give you multifolds returns in long term. For short term and near long term targets i have already placed on chart.
Market Cap
₹ 5,092 Cr.
Current Price
₹ 1,226
High / Low
₹ 1,277 / 811
Stock P/E
26.0
Book Value
₹ 272
Dividend Yield
0.41 %
ROCE
32.1 %
ROE
39.4 %
Face Value
₹ 10.0
Industry PE
18.6
Debt
₹ 971 Cr.
EPS
₹ 47.2
Promoter holding
71.4 %
Intrinsic Value
₹ 1,483
Pledged percentage
0.00 %
EVEBITDA
12.4
Change in Prom Hold
0.00 %
Profit Var 5Yrs
18.3 %
Sales growth 5Years
29.6 %
Return over 5years
%
Debt to equity
0.86
Net profit
₹ 196 Cr.
ROE 5Yr
37.7 %
Profit growth
-47.8 %
PROS:-
Company has delivered good profit growth of 18.3% CAGR over last 5 years
Company has a good return on equity (ROE) track record: 3 Years ROE 36.8%
Debtor days have improved from 46.8 to 27.7 days.
CONS:-
Company might be capitalizing the interest cost.
Disclaimer:- Please always do your own analysis or consult with your financial advisor before taking any kind of trades.
Dear traders, If you like my work then do not forget to hit like and follow me, and guy's let me know what do you think about this idea in comment box, i would be love to reply all of you guy's.
Thankyou.

Price Making "W" on Monthly Time "Akshar Chemical"Key Highlights : 🔰
🔷 Script Name : AKSHAR CHEMICAL (India)
🔷 Script Symbol : NSE:AKSHARCHEM
🔶 Support Level : Price Trade Above All Moving Averages on Weekly Time 🔥
🔶 Volume : High Volume Spikes 💚
🔶 Rate Of Change 🔥
🔷 Entry : Near 200EMA High 👀
🔷 Stop Loss : Close Below 200EMA on Weekly Time 👀
🔷 Target : 🤔😊
🔶🔶 If You Get 100% Than 50% Exit & 50% Ride For Long Term 🔥
Disclaimer : This is NOT Investment Advice. This Post is Meant for Learning Purposes Only. Invest Your Capital at Your Own Risk.
Happy Learning. Cheers!!
Shyorawat Arun Singh ❤️
(@Shyorawat_ArunSingh)
Founder : Shyorawat Investing School

LONG FLUROCHEM - BROKE TRENDLINE RESISTANCE - TGT 4150Buy FLUROCHEM!!
Broke Resistance in 1D Time Frame. It will again reach its previous ATH. It can also form new ATH.
Buy - 3500
Target - 4150
SL - 3100
All The Best!!
Note: This is just for educational purposes. I am not SEBI registered. Do consult your financial advisor before investing.

FINEORG - PERFECT STAGE 2 BREAKOUTFINEORG - FINE ORGANIC IND. LTD.
Trade Type - Short Term (4 month to 7 month)
Trade Logic - Stage 2 breakout
CMP - 5507.10
Time Frame - Weekly
Target 1 : 6050
Target 2 : 6632
Target 3 : 7328
Target 4 : 8250
Stop : 4900
Risk/Reward Ratio (1: 4.3)
Disclaimer: The stock information shared above is not a recommendation to buy, sell, or hold. It reflects my own analysis and is intended solely for educational purposes. Any actions you take based on this information are your responsibility, and the admin of this channel is not liable for any financial gains or losses. Please consult a financial advisor before making any investment decisions. I am not a SEBI-registered advisor.

Rossari Biotech-A reversal in yet another chemical sector stock?Rossari Biotech has given a breakout of horizontal resistance of around 890-900 is sustaining above it.
Stock is looking attractive for good reversal and might reach its ATH in medium term if broader markets are supportive. However, there is an immediate resistance near 1000 as well.
As we have seen this week, there are lot of global tensions leading to high market volatility.
Focus on managing your risk and saving your capital.

ACI given breakout on weekly timeframeACI seems good on weekly timeframe. Result today. Upside potential

Tirumalai Chemicals - Rounding Bottom at ATHA strong breakout at 330 levels
A rounding bottom of 170 points height.
Target : 500
SL 280

Epigral-DO NOT MISS!Logic:-RSI positive divergence near trendline support followed by Consolidation breakout
Epigral is yet another chemical stock showing reversal signs. It has got decent return ratios (ROE , ROCE above 30% ) and PE ratio of 18 at CMP.
Relatively safer stock to bet as technofundamentals are strong together.
Happy trading!

ARCHEAN CHEMICAL INDHello & welcome to this analysis
It was listed in end 2022 and ever since we have see the stock move across both sides.
Currently in a parallel channel zone with strong support near 650 and a possible breakout above 725
Happy Investing
