Cholafin Long - Investment Ideas & AnalysisTechnical Analysis : Cholamandalam Investment and Finance Co. Ltd.
Current Price: 1,610.30
Multi-Timeframe Technical Analysis
Weekly Timeframe Pattern
The stock has formed a **Cup and Handle** pattern on the weekly chart, which is traditionally considered a bullish continuation pattern. This pattern suggests potential accumulation and a possible breakout scenario.
Daily Timeframe Analysis
On the daily chart, a * *Bullish Pennant* * formation has developed, indicating consolidation after a strong upward move. This pattern typically suggests continuation of the prior trend once a breakout occurs.
Key Technical Levels
Fibonacci Retracement Levels:
- 0 Level: ₹1,491.20
- 0.5 Level: ₹1,567.70 (approximate support zone)
- 0.618 Level: ₹1,595.45 (golden ratio support)
- 1 Level: ₹1,644.20
- 1.272 Level: ₹1,685.80
- 1.414 Level: ₹1,707.55
Current Price Action:
The stock is trading near ₹1,610.30, positioned between the 0.618 and 1.0 Fibonacci levels, suggesting a mid-range consolidation zone.
Upside Targets
If the bullish patterns play out and the stock breaks above recent resistance:
- **Primary Target:** Based on the Fibonacci extension, the measured move suggests potential toward ₹1,685-₹1,708 range
- **Pattern Target:** The Cup and Handle height projection aligns with Fibonacci extension levels
Support Analysis
- **Immediate Support:** ₹1,595-₹1,600 zone (0.618 Fibonacci level)
- **Strong Support:** ₹1,567 region (0.5 Fibonacci level)
- **Major Support:** ₹1,491 (pattern base/0 level)
With Nifty made a Bounce back and if the rally continues, adds advantage for the stock to break previous resistance." This highlights the **correlation with broader market sentiment** (Nifty index), suggesting the stock's performance may be influenced by overall market conditions.
Swing Trading Perspective
For short-term traders, the Cup and Handle height provides a **measured move target**. However, confirmation of breakout above resistance with volume would be essential before entry.
**Disclaimer:** This is a technical analysis based on chart patterns and historical price action. This is not financial advice. Traders should conduct their own research, consider risk management strategies, and consult with financial advisors before making trading decisions. Past performance does not guarantee future results.
CHOLAFIN

Cholamandalam Financial Holdings Ltd (CFHL) Triangle Breakout 1DCholamandalam Financial Holdings Ltd (CFHL) – Triangle Breakout & 1-Year Resistance Breakout 🚀
📊 Technical View:
CFHL has given a triangle breakout along with a 1-year resistance breakout, indicating strong bullish momentum. If Trend continues, The price action also shows a successful retest of the breakout zone, shows trend continuation.
Resistance Turned Support: ₹1650 – previously a resistance, now acting as strong support.
Current Action: Price broke above the ₹1650 range, retested the level today , and is now moving upward again.
Next Resistance Targets Levels: ₹1824 / ₹2004
Support Levels: ₹1536 / ₹1410
🏦 Company Overview:
Cholamandalam Financial Holdings Limited (CFHL), incorporated in 1949, is a part of the Murugappa Group, one of India’s most diversified business conglomerates.
CFHL is a Non-Deposit Taking Systemically Important Core Investment Company (CIC) registered with the Reserve Bank of India (RBI).
The company holds substantial investments in group companies and provides a diverse range of financial products and risk management services to individual and corporate clients through its subsidiaries and group companies.
📈 For educational purpose only. Not a buy/sell recommendation.

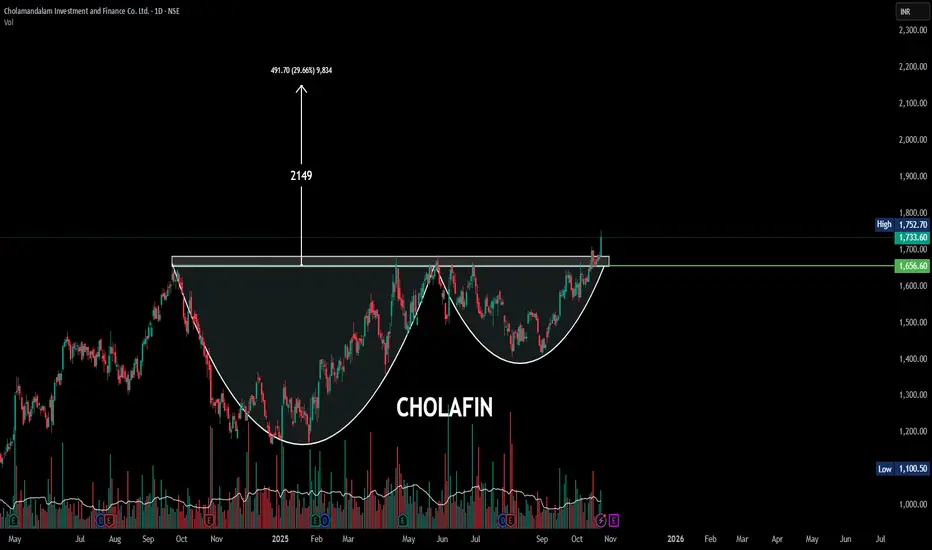
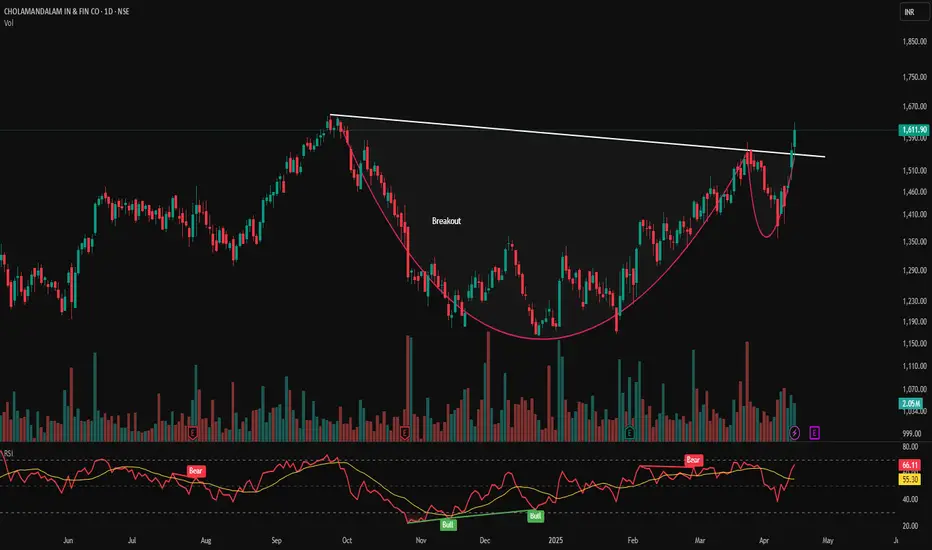
CHOLAFIN| ! Cup and Handle pattern | DailyThe chart displays a confirmed Cup and Handle pattern, which is a highly bullish continuation pattern.
Pattern: Cup and Handle (Daily Chart).Breakout: The price has successfully broken out above the pattern's resistance level (the lip of the cup) at approximately $₹1,656.60. This move is typically followed by a strong upward rally.
Target: The measured move target for this pattern is projected at $₹2,149.
Recommendation: Strongly Bullish on a daily timeframe. Maintain the breakout level ₹1,656.60 as a key support/stop loss.
This technical signal is further reinforced by positive fundamental indicators, with Cholamandalam Investment & Finance reporting strong recent earnings growth and a positive consensus from institutional analysts.
CHOLAFIN Technical & Trade AnalysisCHOLAFIN Technical & Trade Analysis
1️⃣ Price Action
CHOLAFIN surged +4.31% to close at ₹1,583.10, marking a strong bullish candle on the daily chart. Price action shows a clean breakout attempt, with momentum reclaiming higher zones. The stock is now eyeing ₹1,662 → ₹1,737 → ₹1,845 as upside targets, while support holds near ₹1,536 – ₹1,490 – ₹1,463.
Key Levels:
🔴 Resistance: 1,609 | 1,635 | 1,681
🟢 Support: 1,536 | 1,490 | 1,463
________________________________________
2️⃣ Volume Analysis
Breakout is strongly backed by heavy volume. On breakout day, traded volume stood at 3.34M shares, almost 3.89× its 20-day average (1.15M shares). Such abnormal activity indicates institutional participation, confirming this is not a random spike but a move with strong backing.
________________________________________
3️⃣ Technical Indicators
✅ RSI: 65 → Bullish but not overbought yet
✅ MACD: Daily & Weekly bullish crossover confirmed
✅ CCI: 152 → Shows overbought momentum, supports trend
✅ Stochastic: 97 (Daily) → High momentum zone, short-term overheated
⚡ Multi-timeframe View: Daily & Weekly bullish, Monthly still sideways → Good for swing traders, long-term investors should stagger entries
________________________________________
4️⃣ Trade Setup
📈 Daily Closing Basis Trade
Entry: ₹1,588.20
SL: ₹1,513.77
Target 1: ₹1,662.63
Target 2: ₹1,737.06
⚖️ Risk–Reward: ~1:2 | Momentum strongly in favor
📊 Swing Trade Setup
Entry: ₹1,588.20
SL: ₹1,489.40
Target 1: ₹1,687
Target 2: ₹1,785
🚀 Higher potential: ₹1,845 (Fib extension)
Intraday Pullback level: 1560
Swing Pullback level: 1577
________________________________________
5️⃣ Investment Outlook
📈 Bullish Case – Why CHOLAFIN may go up
Strong bullish candle with massive volume (3.89× avg.)
RSI breakout with MACD crossover
Sectoral momentum in NBFC/finance space
Strong support zone near 1,490–1,460 ensures limited downside
📉 Bearish Case – Watch out for
Overheated stochastic (near 97) may cause short-term pullback
Resistance around ₹1,681–1,735 is critical supply zone
Broader market weakness could stall momentum
________________________________________
⚡ Final Outlook
Momentum: Strong | Trend: Bullish | Risk: Low | Volume: High
________________________________________
💡 Learning Note
This setup is a classic high-volume breakout trade → when price action, RSI, MACD, and volume align, probability of success is high. NBFC sector plays like CHOLAFIN can deliver strong short-term swing moves when backed by 3–4× volume spikes.
________________________________________
📈 Chart Pattern Analysis
CHOLAFIN on the daily timeframe has given a Double Bottom / Inverse Head & Shoulders–type breakout, a classic bullish reversal setup. The two key lows were formed near the ₹1,470–1,490 zone, showing strong demand absorption at that level. The neckline breakout came around ₹1,544–1,550, confirmed with a big green candle and 3.89× average volume, which validates institutional participation. This breakout indicates that sellers failed to push the stock lower twice, and buyers have now taken control, shifting momentum firmly to the upside. Based on the pattern projection and Fibonacci extensions, the upside potential extends towards ₹1,684 → ₹1,760 → ₹1,800, aligning with the 1.0 and 1.272 Fib levels.
________________________________________
⚠️ Disclaimer – Please Read Carefully
The information shared here is meant purely for learning and awareness. It is not a buy or sell recommendation and should not be taken as investment advice. I am not a SEBI-registered investment advisor, and all views expressed are based on personal study, chart patterns, and publicly available market data.
Trading — whether in stocks or options — carries risk. Markets can move unexpectedly, and losses can sometimes exceed the money you have invested. Past performance or past setups do not guarantee future results.
If you are a beginner, treat this as a guide to understand how the market works — practice on paper trades before risking real money. If you are experienced, always assess your own risk, position sizing, and strategy suitability before entering trades.
Consult a SEBI-registered financial advisor before making any real trading decision. By engaging with this content, you acknowledge full responsibility for your trades and investments.
💬 Found this useful?
🔼 Give this post a Boost to help more traders discover clean, structured learning.
✍️ Drop your thoughts, questions, or setups in the comments — let’s grow together!
🔁 Share with fellow traders and beginners to spread awareness.
👉 “If you liked this breakdown, follow for more clean, structured setups with discipline at the core.”
🚀 Stay Calm. Stay Clean. Trade With Patience.
Trade Smart | Learn Zones | Be Self-Reliant 📊

CHOLAFIN - ReassessmentThe last time I posted the chart, the inverted Head and Shoulder pattern was evident and it had signaled that the downward trajectory has been arrested. However, the analysis was premature and with the very close Stoploss we were safely out of the stock. That is the benefit of having a stoploss.
Since then the stock has gone on to form a nice base respecting that bottom zone the Inverted Head and Shoulder had arrested and also now it is making a more evident Triple Bottom on the Support line of the Ascending Channel.
I believe the stock is now ready for an up move.

Chola Finance: as expected cup & handle pattern formed.Chola Finance: as expected cup & handle pattern formed sustaining above 1642.
At breakout levels. CMP 1643.
Pattern target of 2100.
View negated below 1500.
CHOLAFIN: Potential for 15-20% Upside AheadThe chart of CHOLAFIN provides delineates critical price thresholds that signify breakout points, along with specific support levels that serve as indicators of where buying interest may manifest.
Additionally, the chart highlights regions likely to act as ceiling points for future price ascensions, allowing for informed decisions on entry and exit strategies.
Disclaimer: The information contained in this technical analysis report is intended solely for informational and educational purposes. It should not be interpreted as financial advice or a recommendation to buy or sell any security. Investors are strongly encouraged to conduct their own research and consult with a qualified financial advisor before making any investment decisions.

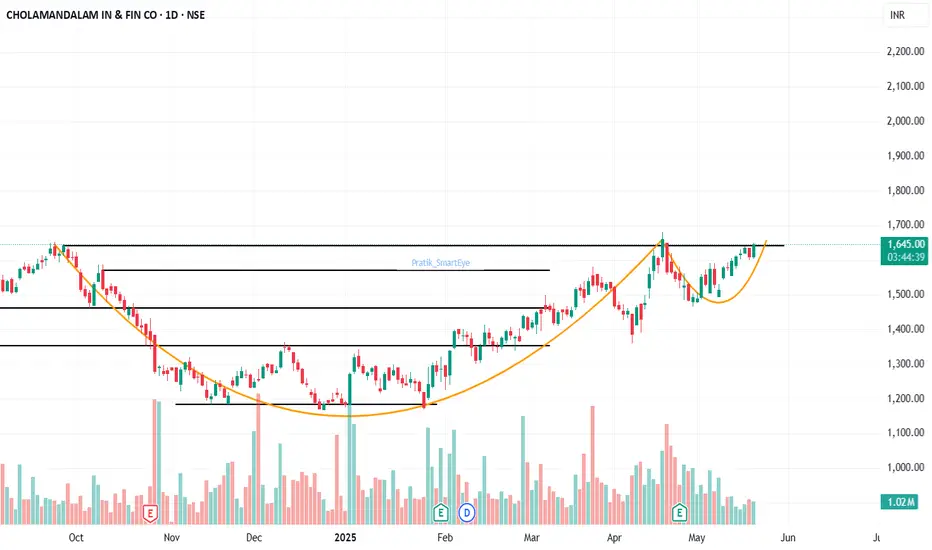
CHOLAFIN- Cup & Handle Breakout with Strong FundamentalsCHOLAFIN – Cup & Handle Breakout with Strong Fundamentals ☕📈
📅 Published on: April 17, 2025
📊 Technical Analysis:
CHOLAFIN has formed a classic Cup & Handle pattern on the daily chart, indicating a potential bullish continuation. The breakout above the neckline is accompanied by increased volume, suggesting strong buying interest.
Pattern: Cup & Handle
Neckline Breakout Level: ₹1,570
Current Price: ₹1,611.90 (+3.31%)
Volume: 2.05M—significant increase confirming breakout
Support & Resistance Levels:
Immediate Support: ₹1,570
Next Support: ₹1,500
Resistance Levels:
₹1,635
₹1,680
₹1,750
Indicators:
RSI: 66.11—approaching overbought territory, indicating strong momentum
MACD: Bullish crossover observed, supporting upward movement
🏢 Fundamental Analysis:
Cholamandalam Investment and Finance Company Ltd. is a leading NBFC in India, operating in vehicle finance, home loans, and corporate finance sectors.
Key Financial Metrics:
Market Cap: ₹1,20,302 Cr
PE Ratio: 29.60
PB Ratio: 5.62
ROE: 17.41%
ROCE: 11.23%
Dividend Yield: 0.14%
Recent Performance:
Net Profit Margin: 18.16%
Return on Assets: 2.18%
Asset Turnover Ratio: 0.14
The company has demonstrated consistent profit growth over the past five years, with a CAGR of 23.4%.
📌 Trade Strategy (For Educational Purposes):
Entry Point: ₹1,570–₹1,600 (on retest)
Stop Loss: ₹1,500
Target Levels:
₹1,635
₹1,680
₹1,750
📍 Visual Elements:
Cup & Handle pattern highlighted
Breakout point marked
Support and resistance levels indicated
Volume bars showing increased activity
RSI and MACD indicators displayed
🔔 Disclaimer: This analysis is for educational purposes only. Please conduct your own research or consult a financial advisor before making investment decisions.
CHOLAFIN : Breakout and retestTechinical anlysis : shorterm uptrend on weekly chart of CHOLAFIN, and on daily chart lets wait for the retest confirmation obove previous swing high 1366
with a target 1476 and stop loss below 1330

Chola Fin co., Looking good ; min 20% Roi ; swingFor short term investment ;
Leave a " Like If you agree ". 👍
.
Wait for small retracement & daily candle to close above - "1260".
Trade carefully untill ENTRY level.
.
Entry: 1260
Target: 1430-1560
sl: 1199
major stoploss/ support: 1190
.
.
Enter only if market Breaks
"Yellow box" mentioned.
.
.
Don't make complicated trade set-up.📈📉
Keep it " simple, focus on consistency "💹
Refer our old ideas for accuracy rate🧑💻
Follow for daily updates👍
.
Refer old posted idea attached below.

Cholafin - Bearish PossiblityResistance zone at 1335 - 65
Expecting a pull back from the area
If falls downside target may be around 1200
View negates with hourly close above 1270

CHOLAMANDALAM FINANCEAfter the correction waves in the mark down stage of the price action, the accumulation phase is complete with a Head and Shoulder pattern. There is assurance in the base formation by way of a double bottom. The stock may not race fast enough but the trajectory seems to have turned bullish.

CHOLAFIN - Breakout and retestCHOLAFIN - Breakout and retest in Daily timeframe. The company has been in uptrend and the trend is likely to continue. I see a good upside potential/ Swing trading opportunity in this stock. There is a good entry point now with a very good R:R.
The company has very good fundamentals and has been a consistent good performer.
Note: These are my personal views only. Please conduct your own research before making a buy/ sell decision.

Cholamandalam Investment - Breakout Setup, Move is ON...#CHOLAFIN trading above Resistance of 1566
Next Resistance is at 1807
Support is at 1231
Here are previous charts:
Chart is self explanatory. Levels of breakout, possible up-moves (where stock may find resistances) and support (close below which, setup will be invalidated) are clearly defined.
Disclaimer: This is for demonstration and educational purpose only. This is not buying or selling recommendations. I am not SEBI registered. Please consult your financial advisor before taking any trade.

Cholamandalam Investment And Finance - Long Setup, Move is ON...#CHOLAFIN trading above Resistance of 1231
Next Resistance is at 1566
Support is at 966
Here are previous charts:
Chart is self explanatory. Entry, Resistances and Support are mentioned on the chart.
Disclaimer: This is for demonstration and educational purpose only. This is not buying or selling recommendations. I am not SEBI registered. Please consult your financial advisor before taking any trade.

CholaFin Breakout: Riding the Momentum Wave"CholaFin has broken out on the daily timeframe, signaling a strong upward momentum. With technical indicators supporting the breakout, the price is expected to rise further, presenting an excellent opportunity for traders to ride the bullish wave.

Double Moving Averages Crossover Swing Trade📊 Script: CHOLAFIN
📊 Sector: Finance
📊 Industry: Finance & Investments
⏱️ C.M.P 📑💰- 1337
🟢 Target 🎯🏆 - 1443
⚠️ Stoploss ☠️🚫 - 1295
📊 Script: PRAJIND
📊 Sector: Capital Goods-Non Electrical Equipment
📊 Industry: Engineering
⏱️ C.M.P 📑💰- 590
🟢 Target 🎯🏆 - 623
⚠️ Stoploss ☠️🚫 - 574
📊 Script: LATENTVIEW
📊 Sector: IT - Software
📊 Industry: Computers - Software - Medium / Small
⏱️ C.M.P 📑💰- 514
🟢 Target 🎯🏆 - 543
⚠️ Stoploss ☠️🚫 - 503
⚠️ Important: Always maintain your Risk & Reward Ratio.
✅Like and follow to never miss a new idea!✅
Disclaimer: I am not SEBI Registered Advisor. My posts are purely for training and educational purposes.
Eat🍜 Sleep😴 TradingView📈 Repeat 🔁
Happy learning with trading. Cheers!🥂

CholaFin Wave Analysis - Wave 3 is Running! Use Ichimoku to RideCHOLAMANDALAM (CholaFin) Chart Analysis
As per Elliott Wave analysis, CholaFin is still bullish. The price reversed after a strong bullish divergence in the MACD and has completed the subwaves of Wave 2 of Wave 3. Currently, it is moving up in Wave 3 of Wave 3.
Use Ichimoku for entry & exits (Daily time frame):
Entry Point: Look for a good dip to enter and avg(for long-term) when the price is near the Ichimoku Cloud's support. Enter when the Price breaks TS/KS with momentum candle.
Exit Point: Consider exiting the position when the price starts to show weakness near TS and KS in daily chart. Another exit signal could be when the candle close below the cloud.
By using the Ichimoku indicator in conjunction with Elliott Wave analysis, you can identify more precise entry and exit points to maximize your trading strategy.
Disclaimer: We are not SEBI registered. The content presented here is based on our personal opinions. Conduct your own research and consult with a qualified financial advisor before making any investment decisions

CHOLAFIN - LOOKING SUPER BULLISH - LONG ENTRYAs per chart CHOLAFIN taken very good support and any close above 1100 will show more strength to this stock.
So keep on eyes for 1100 if break and sustain we can see 1150 .
Pattern is weak below 1050 .
Always wait for levels to active

CHOLAFINCholamandalam Investment and Finance Company Limited (CHOLAFIN) is engaged in providing vehicle finance, home loans, and loans against property. The analysis below combines technical indicators and fundamental aspects to provide a comprehensive view.
Shareholding Pattern:
Total Shareholders: 1,46,815
Promoters: 51.43%
FIIs: 21.51%
DIIs: 20.04%
Public: 7.03%
The company has demonstrated a robust profit growth of 23.8% CAGR over the last 5 years. Net Profit: ₹2,665 crore.
Considering the positive profit growth, anticipated good quarter, and potential technical indicators, there is a long signal for CHOLAFIN.
Entry: 1183, Targets: 1280, 1377, 1474, 1571 ++ SL: 1085 DCB
Disclaimer: Strictly for Educational and Learning purpose only.

cholamandalam finance new buying zonecholafinance can see again in channel pattern and now we can go with long...

Cholafin long view (buy)As we can see the bullish reveral as per channel pattern consideration we can plan long trade.
Entry = 1147
Target = 1172, 1192, 1220, 1264
Stoploss = 1120
Disclaimer : Only for educational purpose, trade at your own risk.

Cholamandalam Investment And Finance - Long Setup, Move is ON...#CHOLAFIN trading above Resistance of 1111
Next Resistance is at 1231
Support is at 855
Here are previous charts:
Chart is self explanatory. Entry, Resistances and Support are mentioned on the chart.
Disclaimer: This is for demonstration and educational purpose only. This is not buying or selling recommendations. I am not SEBI registered. Please consult your financial advisor before taking any trade.
