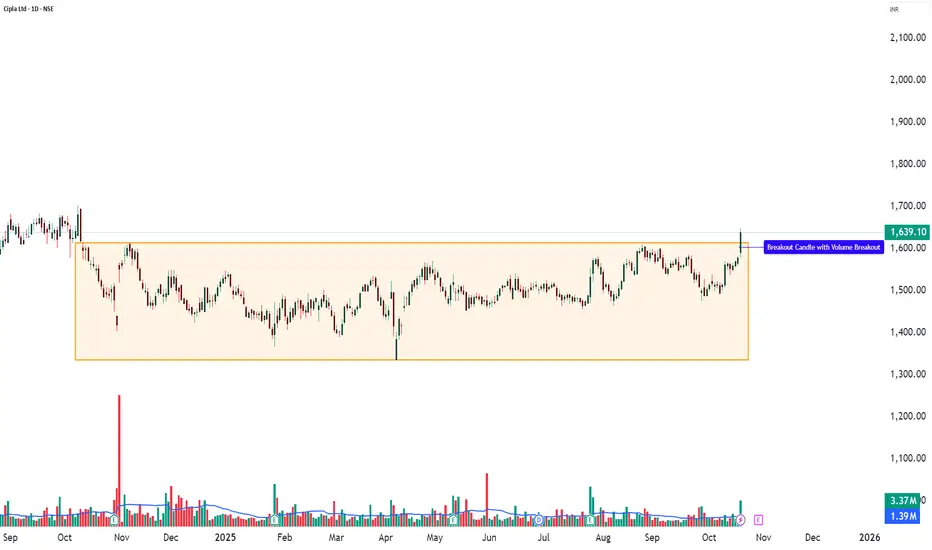
CIPLA – 10-Day Volume Breakout | Bullish Continuation Setup💹 Cipla Ltd (NSE: CIPLA)
Sector: Pharmaceuticals | CMP: ₹1,639.10 | View: Bullish Continuation Setup
🔹 Technical Analysis / Chart Pattern / Price Action / Volume Analysis:
Cipla Ltd shows strong bullish momentum with a clear breakout candle supported by a significant volume surge of 3,372,906 shares, compared to its 20-day average of 1,386,709 shares — a rise of over 2.4 times. This confirms fresh institutional buying and genuine participation behind the move. The open-equals-low formation reflects strong buyer control from the start, while a Bollinger Band breakout with a BB squeeze-off signals that volatility compression has ended, hinting at a sharp upward continuation. The RSI breakout further supports growing momentum, and consistent volume expansion validates trend strength. Overall, the setup represents a bullish continuation structure, where price, volume, and momentum align perfectly — a textbook example of a powerful breakout phase supported by conviction buying.
🔹 Key Levels:
Resistance: 1665 / 1690 / 1733
Support: 1566 / 1537 / 1498
🔹 STWP Trade Analysis:
Bias: Bullish
Breakout Level: 1647
Intraday Support: 1620
Swing Support: 1553
Intermediate Support: 1535
🔹 HNI Trade Analysis:
Possible Accumulation Level: 1639 - 1647
Possible Low Levels: 1629
Support Levels: 1624 - 1606
🔹 Final Outlook:
Momentum: Moderate | Trend: Neutral | Risk: Low | Volume: High
🔹 Learning Note (Educational Purpose):
This setup is a great example of how a breakout with strong volume and RSI confirmation can signal a shift from consolidation to momentum. It helps learners understand that when price, volume, and indicators align together, it often leads to a trend continuation phase. Always observe how volume expands during breakouts — it’s one of the strongest clues of institutional activity.
🔹 STWP Mentor Note:
A clean breakout backed by strong volume is not just a signal — it’s a lesson in patience and timing. Smart traders wait for clarity, not noise. As a learner, focus on identifying structure, strength, and sustainability in every move. Remember, every breakout teaches discipline — stay consistent, study reactions, and always trade with patience and purpose.
───────────────────────────────────────────────
⚠️ **DISCLOSURE & DISCLAIMER (SEBI-Compliant)**
───────────────────────────────────────────────
📘 **Purpose:**
This content is created **solely for educational and informational purposes** to help readers understand market structure, price action, and technical analysis.
It does **not constitute investment advice**, research recommendation, or a solicitation to buy or sell any security.
👤 **Author Disclosure:**
The author is **not a SEBI-registered investment adviser or research analyst.**
All chart studies, price levels, and observations are based on publicly available data (e.g., **NSE India**, **TradingView**) and are presented purely for **learning illustration**.
📊 **Position Status:**
No active position in * * at the time of publication.
“The author may sometimes trade in the securities discussed, but such trades are independent and shared here only for educational understanding.”
⚠️ **Risk Disclosure:**
Trading and investing involve financial risk. Market movements can be unpredictable, and losses may exceed invested capital.
Readers are strongly advised to consult a **SEBI-registered investment adviser** before making any trading or investment decisions.
🧠 **Responsibility Clause:**
By engaging with this post, you acknowledge that you are **solely responsible for your own trading or investment decisions**, and that this content is intended only for **market education and awareness**.
───────────────────────────────────────────────
💬 **Did You Find This Useful?**
If this analysis helped you understand price structure or market psychology better:
🔼 **Boost** to support transparent & structured financial education.
✍️ **Comment** your insights, observations, or questions — let’s learn together.
🔁 **Share** this post with learners and aspiring traders who value discipline.
📚 **Follow stwp** for more structured, educational breakdowns on stocks & setups.
🚀 *Stay Calm. Stay Clean. Trade With Patience.*
💡 *Trade Smart | Learn Zones | Be Self-Reliant.*
───────────────────────────────────────────────
Cipla
CIPLA (Weekly Timeframe) - Can it breakout ??Cipla has been in an accumulation stage for a while. Few attempts to breakout of the 1600 zone has not been successful. With EMAs in positive cross-over state, the stock looks to breakout of this key resistance zone. The volume is also OK in the past few weeks.
To be monitored on how it goes in the coming weeks.
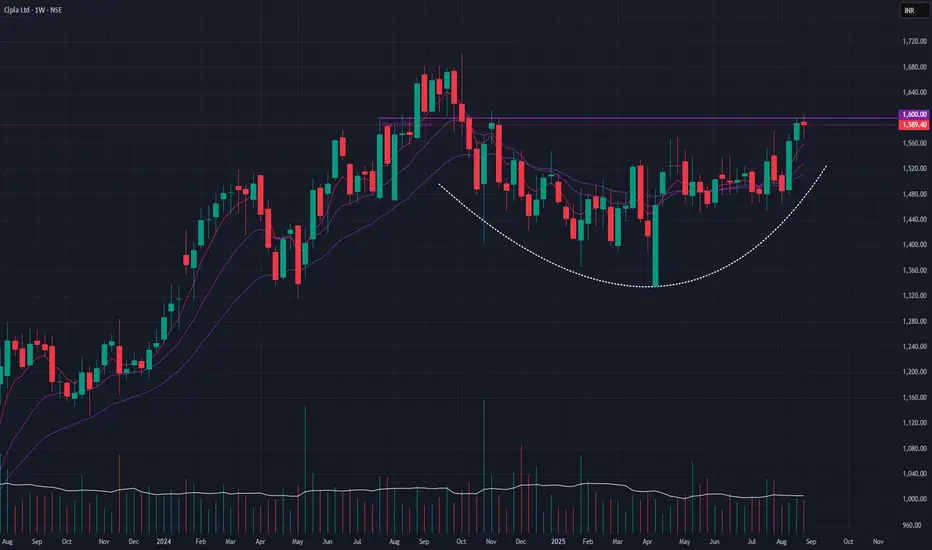
Breakout from cup-and-handle pattern
✅ Strong EMA alignment (20 > 50).
✅ RSI > 60 with bullish slope.
🚩 Needs follow-through above ₹1600 for sustained rally.
🎯 Target zones: ~₹1630, ₹1683, ₹1837 (Fib extensions).
🛑 Stop-loss: ₹1571 (tight ATR-based).
U.S. Inhaler Play and Strong Earnings Fuel Long-Term UpsideTicker: NSE: CIPLA
Sector: Pharmaceuticals
Market Cap: ₹1.26 lakh crore+
Current Price: ₹1,572 (as of July 28, 2025)
Technical Rating: ⭐⭐⭐⭐⭐ (Strong Buy across platforms)
________________________________________________________________________________
🔍 Strong Fundamentals Back the Bullish Momentum
CIPLA has delivered an encouraging performance in Q1 FY26, reinforcing its long-term bullish narrative. The company posted a 10% year-on-year growth in profit after tax (PAT), reaching ₹1,298 crore, while revenues climbed 4% to ₹6,957 crore. These gains were driven largely by robust performance across its domestic Indian market and continued traction in Africa. The earnings beat estimates and demonstrate management's ability to maintain profitability despite sector-wide margin pressures.
Brokerages have taken note. Antique Broking has issued a bullish price target of ₹1,875, citing confidence in CIPLA’s U.S. respiratory pipeline. Meanwhile, Nuvama has pegged a more conservative target of ₹1,651, emphasizing margin resilience. Both reflect a broader positive sentiment from the street, bolstered by the company’s continued strategic execution.
Perhaps most importantly, CIPLA's U.S. growth roadmap is gaining clarity. With a stated goal of achieving $1 billion in U.S. revenue by FY27, the company is betting big on its inhalation portfolio. The upcoming launches of generic Advair and Symbicort are expected to cushion the impact from the anticipated decline in Revlimid revenues. This pipeline visibility is a key factor that differentiates CIPLA from its peers in the pharma space.
________________________________________________________________________________
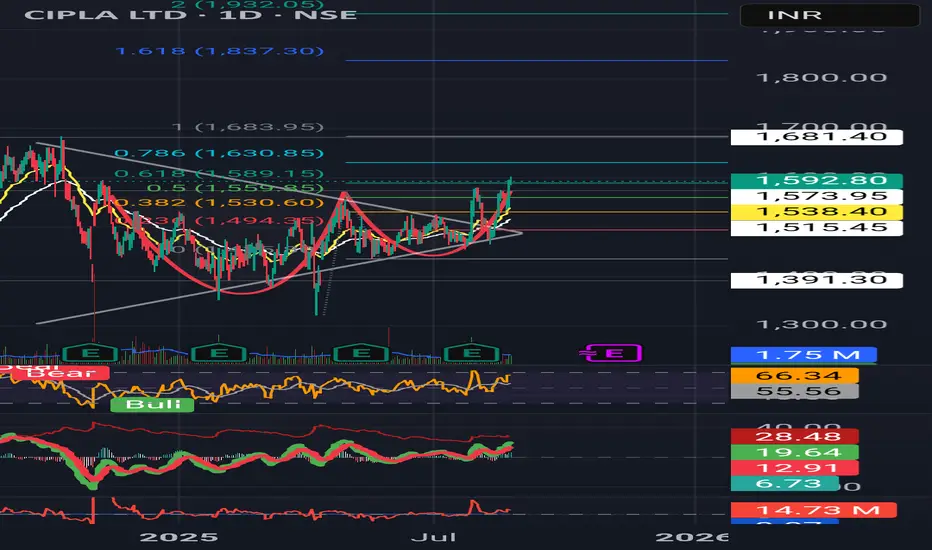
📊 Technical Structure Signals Bullish Breakout
From a technical standpoint, CIPLA has just confirmed a breakout from an ascending triangle pattern, typically viewed as a continuation setup in an uptrend. On July 28th, the stock surged above the key breakout zone of ₹1,575–₹1,580, backed by a substantial increase in volume (3.84M vs 1.68M avg), signaling institutional participation. The daily close at ₹1,572 marks a technical inflection point, with the price now firmly above its 20, 50, 100, and 200 EMAs, indicating strong trend alignment.
The momentum indicators are also supportive, though cautionary. The Relative Strength Index (RSI) hovers around 71, suggesting overbought conditions, while the MACD has given a fresh bullish crossover. Additionally, the ADX (above 25) confirms trend strength. However, traders should be prepared for short-term volatility or pullbacks, as these indicators often cool off before further upside continues.
Key support levels to watch include ₹1,536, followed by ₹1,500 and ₹1,479.5. On the upside, immediate resistances lie at ₹1,592.5, then ₹1,613 and ₹1,649. A sustained close above ₹1,580–1,592 may unlock the next bullish leg toward ₹1,650+ levels.
________________________________________________________________________________
⚠️ Risks Remain – Pricing Pressure and Valuation a Concern
Despite the bullish setup, there are risks that could temper upside momentum. CIPLA’s U.S. Revlimid portfolio is facing pricing pressure, a trend impacting the broader generics market. Any further compression could drag margins in upcoming quarters. Additionally, while the company has posted solid profits, its EBITDA margin has seen a slight dip to 25.6%, suggesting limited operating leverage.
On the valuation front, CIPLA now trades at nearly 27× P/E, pricing in much of the future growth optimism. This elevates the bar for quarterly execution. From a technical lens, the RSI and stochastic indicators remain in overbought territory, raising the possibility of near-term consolidation or minor pullbacks before the next move higher.
________________________________________________________________________________
⏳ Tactical & Strategic View – Trade the Momentum, Invest in the Vision
In the short term, momentum traders should monitor how the stock behaves around the ₹1,575–₹1,580 breakout level. If the price sustains above this zone with continued volume, it signals strength and potential for a rapid move toward ₹1,600–₹1,650. However, any retracement to the ₹1,540–₹1,550 support range could present an ideal buying opportunity, especially for swing traders looking for a defined risk-reward setup.
For long-term investors, the bullish thesis rests on execution of the U.S. strategy and maintaining growth in high-margin geographies. With brokerages projecting upside toward ₹1,650–₹1,875, and a strategic focus on inhalation therapies, CIPLA is well-positioned for structural growth. That said, investors must remain patient and allow the multi-year thesis to unfold.
________________________________________________________________________________
🧠 Market Sentiment – Cautious Optimism
Overall market sentiment remains decisively positive, supported by strong earnings, a visible product pipeline, and favorable technical alignment. Yet, caution stems from the overbought technicals and valuation concerns. A prudent approach would be to accumulate on dips near ₹1,540–₹1,550, while watching for a decisive breakout and close above ₹1,580 to confirm trend continuation.
________________________________________________________________________________
📍 Investment Thesis: Accumulate with Conviction
CIPLA’s combination of strong fundamentals, a defined U.S. strategy, technical momentum, and institutional interest makes it a compelling long-term investment. Traders and investors alike can look to accumulate on dips, while treating a breakout above ₹1,580 as a confirmation trigger for further upside. Execution risk remains, but the broader setup favors a bullish bias heading into the next quarter.
For traders looking to capitalize on Cipla’s potential breakout, two entry strategies stand out. An aggressive entry can be considered in the ₹1,572–₹1,577 range, with a stop loss placed at ₹1,558. This suits momentum traders aiming to ride an early breakout, targeting ₹1,590 as an initial objective and ₹1,610+ for extended gains, offering a risk-reward ratio of 1:1 to 1:2+. Alternatively, a low-cost entry is ideal near ₹1,564 for those seeking a better cushion against volatility, with a tighter stop loss at ₹1,542. This setup also offers attractive upside toward ₹1,580–₹1,605+, maintaining similar or better risk-reward dynamics. In both cases, a decisive breakout above ₹1,580 on strong volume would confirm the bullish structure. Traders are advised to follow strict stop-loss discipline and avoid chasing if the price stretches sharply.
________________________________________________________________________________
⚠ Disclaimer (Please Read):
• These Trades are shared for educational purposes only and is not investment advice.
• I am not a SEBI-registered advisor.
• The information provided here is based on personal market observation.
• No buy/sell recommendations are being made.
• Please do your own research or consult a registered financial advisor before making any trading decisions.
• Trading involves risk. Always use proper risk management.
• I am not responsible for trading decisions based on this post.
________________________________________________________________________________
💬 Found this helpful?
Drop your thoughts or questions in the comments below ⬇️
🔁 Share this post with your trading community – let them benefit from clean charts, structured setups, and zone-based learning.
✅ Follow simpletradewithpatience for charts, clean setups, and educational content based on price action, zones, and risk-managed trades.
🚀 Trade with patience, trust your charts, and stay clear-headed!
Be Self-Reliant | Trade with Patience | Learn with Charts & Zones 📊________________________________________________________________________________

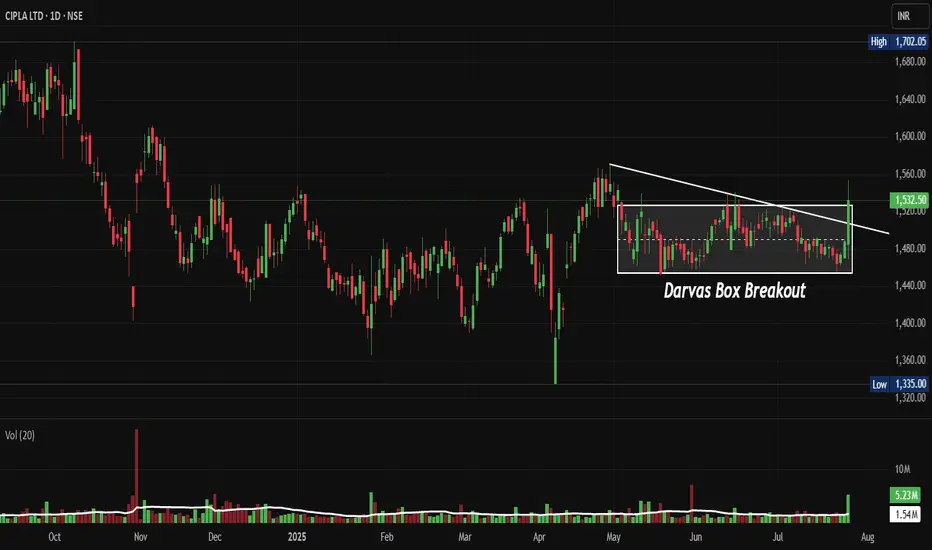
CIPLA: Darvas Box Breakout Post Results ReactionNSE:CIPLA Darvas Box Breakout Post Q1 FY 26 Results Reaction: Why This Pharma Giant Could Be Your Next Big Winner Let's Analyze
Price Action:
Price Movement Characteristics:
- Volatility: Compressed volatility within the Darvas Box range
- Price Swings: Controlled swings between ₹1,480-1,532.50 boundaries
- Breakout Attempts: Multiple tests of upper resistance without sustained follow-through
- Support Tests: Clean bounces from the lower boundary showing strong institutional support
Volume Spread Analysis
- Current Volume: 5.23M (above 20-day average)
- Volume Pattern: Declining during consolidation (bullish accumulation sign)
- Volume Spike Required: Need 1.5x average volume for breakout confirmation
- Volume Trend: Steady participation without panic selling
Market Structure Analysis:
- Higher Lows Formation: Gradual increase in swing lows within the consolidation
- Lower Highs Compression: Resistance level holding firm, creating compression
- Price Coiling: Decreasing range suggesting energy buildup for directional move
- Time Compression: Extended sideways movement indicating a major move is pending
Chart Pattern Recognition:
- Primary Pattern: Darvas Box Formation (clearly marked on the chart)
- Box Range: ₹1,480 - ₹1,532.50 consolidation zone
- Pattern Duration: Approximately 3-4 months of sideways consolidation
- Volume Context: Declining volume during the consolidation phase, typical of accumulation
Candlestick Pattern Analysis:
- Recent Candles Formation: Doji and small-bodied candles indicating indecision at resistance
- Candle Bodies: Predominantly small bodies suggesting balanced buying/selling pressure
- Wicks Analysis: Upper wicks at resistance showing selling pressure, lower wicks showing support
- Colour Distribution: Mixed red/green candles within the box showing consolidation
Key Support and Resistance Levels:
- Immediate Support: ₹1,480 (Darvas Box lower boundary)
- Strong Support: ₹1,420 (previous swing low)
- Critical Support: ₹1,335 (yearly low)
- Immediate Resistance: ₹1,532.50 (Darvas Box upper boundary)
- Target Resistance: ₹1,600-1,620 (measured move projection)
- Ultimate Target: ₹1,700+ (analyst consensus target)
Base Formation:
- Base Type: Rectangular consolidation/Darvas Box
- Base Duration: 3-4 months (adequate for institutional accumulation)
- Base Tightness: Well-defined boundaries showing controlled supply
- Breakout Confirmation: Price action at upper boundary with volume expansion needed
Trend Analysis:
- Short-term Trend: Sideways consolidation
- Medium-term Trend: Neutral to slightly bullish
- Long-term Trend: Recovery phase from 2024 lows
Momentum Indicators:
- Current Momentum: Building up for potential breakout
- Price Position: Near upper boundary of consolidation range
- Market Structure: Higher lows formation within the box
Trade Setup Strategy:
Entry Strategy:
- Primary Entry: Breakout above ₹1,535 with volume confirmation
- Secondary Entry: Retest of breakout level around ₹1,520-1,525
- Conservative Entry: Support bounce from ₹1,485-1,490
Target Levels:
- Target 1: ₹1,580 (initial resistance)
- Target 2: ₹1,620 (measured move from box height)
- Target 3: ₹1,700 (analyst target consensus)
- Long-term Target: ₹1,800+ (bull case scenario)
Stop-Loss Levels:
- Aggressive: ₹1,470 (below box support)
- Conservative: ₹1,450 (below key support zone)
- Risk Management: ₹1,420 (major support failure)
Position Sizing Guidelines:
- High Conviction: 2-3% of portfolio (on confirmed breakout)
- Medium Conviction: 1-2% of portfolio (on retest entry)
- Conservative: 0.5-1% of portfolio (support bounce play)
- Maximum Risk per Trade: Not more than 1% of total capital
Risk Management Framework:
- Risk-Reward Ratio: Minimum 1:2 for all entries
- Position Scaling: Add on strength after initial 5% move
- Profit Booking: Book 30% at Target 1, 40% at Target 2, trail rest
- Stop-Loss Management: Trail stop to breakeven after 7-8% profit
Sectoral and Fundamental Backdrop:
Pharmaceutical Sector Outlook:
- Market Size: The Indian pharma market is expected to reach US$18.8 billion by 2028 at an 8% CAGR
- Global Position: 500 facilities approved by the US FDA, the highest number outside the US
- Growth Drivers: Speedy introduction of generic drugs and focus on rural health programmes
CIPLA Fundamental Strengths:
- Market Capitalization: ₹1,23,842 Crore
- Performance: ₹27,548 Cr revenue with ₹5,269 Cr profit
Key Fundamental Concerns:
- Growth Rate: Poor sales growth of 10% over the past five years
- Promoter Holding: Decreased by 4.42% over the last 3 years, currently at 29.19%
Industry Catalysts:
- FDA Approvals: India has received 6,316 USFDA approvals for formulation plants
- Global Market Share: India supplies 40 per cent of generic drugs globally
- Export Potential: Strong positioning as a global generic supplier
Risk Assessment:
Technical Risks:
- Pattern Failure: Box breakdown below ₹1,470 would negate the bullish thesis
- Volume Concerns: Breakout without volume confirmation could lead to a false move
- Market Sentiment: Broader market correction could impact individual stock performance
Fundamental Risks:
- Regulatory Changes: FDA compliance issues or policy changes
- Competition: Intense pricing pressure in the generic segment
- Currency Risk: Rupee fluctuation impact on export revenues
Market Risks:
- Sector Rotation: Money flow away from the pharma sector
- Global Slowdown: Impact on export-dependent business model
- Geopolitical Factors: Trade tensions affecting pharmaceutical exports
My Take:
Trading/Investment Thesis:
The Darvas Box pattern on NSE:CIPLA represents a classic accumulation phase, characterised by institutional buying at lower levels. The pharmaceutical sector's strong fundamentals, combined with CIPLA's established market position, create a favourable environment for a potential breakout.
My Action Plan:
- Watch for breakout above ₹1,535 with 1.5x volume
- Enter in phases rather than a lump-sum investment
- Maintain strict stop-loss discipline
- Book profits in tranches as targets are achieved
Keep in the Watchlist and DOYR.
NO RECO. For Buy/Sell.
📌Thank you for exploring my idea! I hope you found it valuable.
🙏FOLLOW for more
👍BOOST if you found it useful.
✍️COMMENT below with your views.
Meanwhile, check out my other stock ideas on the right side until this trade is activated. I would love your feedback.
Disclaimer: "I am not a SEBI REGISTERED RESEARCH ANALYST AND INVESTMENT ADVISER."
This analysis is intended solely for informational and educational purposes and should not be interpreted as financial advice. It is advisable to consult a qualified financial advisor or conduct thorough research before making investment decisions.
CIPLA | SYMETRICAL TRIANGLE | DAILYCIPLA
Here’s a concise **technical analysis** of the **CIPLA** chart:
✅ **Pattern**: A **Cup and Handle** formation is evident, and the price has just broken out of the handle’s upper trendline.
✅ **Breakout Zone**: The breakout level is around **₹1,504**, confirming the pattern breakout.
✅ **Targets & Projections**:
* **Immediate Target**: ₹1,567 (calculated from the handle height).
* **Potential Higher Target**: ₹1,800 (if momentum sustains beyond ₹1,567).
✅ **Support Levels**:
* Immediate support at **₹1,476** (handle base and retest zone).
* Stronger support at ₹1,335.
✅ **RSI Analysis**: RSI is near 60, and a bullish divergence was recently confirmed, suggesting positive momentum.
✅ **Volume**: The breakout is supported by a spike in volume, further confirming the strength of the move.
**Summary**:
CIPLA is showing a bullish Cup and Handle breakout with initial target of ₹1,567. If sustained momentum continues, the longer-term target could be ₹1,800. Keep an eye on ₹1,476 for any retest or pullback.
We’d love to hear your thoughts!
What’s your view on CIPLA’s breakout? Do you see further upside, or do you have other key levels in mind?
💬 Drop your analysis, questions, or any interesting observations in the comments below!
Your input always helps the community learn and grow together. Let’s discuss!

Cipla - triple bottom patternCipla has formed a triple bottom pattern on the daily chart, suggesting a potential bullish reversal. The stock has been consolidating near its key support level, indicating accumulation by buyers. Increased trading volume highlights growing buying interest and supports the possibility of continued bullish momentum.
The technical indicators also align with this outlook. The RSI is trending upwards at 43.59, signaling improving strength, while the Stochastic RSI has shown a positive crossover, further confirming the potential for an upward move. A breakout above Rs 1,460 could trigger a rally toward the immediate targets of Rs 1,550 and Rs 1,580. On the downside, the support at Rs 1,430 provides a favourable buying opportunity for investors.
Strategy: Buy
Target: Rs 1,550, Rs 1,580
Stop-Loss: Rs 1,400


Natco Pharma for 45%+ gainsDate: 21 Nov’24
Symbol: NATCOPHARM
Timeframe: Daily
Natco Pharma currently seems to be in Wave IV of 3 which could end around 1240-1220 and Wave V could then head towards 1800-1900 levels (45%+ from where Wave IV would end) as seen in the chart. A more precise target can be pinned once it makes a fresh ATH. Two levels (1770 & 1900) have been marked as possible supply zone.
The company recently posted good Q2 numbers. The stock is currently trading at a PE multiple of 12.6 while the industry average is around 32.
This is not a prediction but a possible wave count. This is also not a recommendation to trade or invest. Please do your own analysis.
HINGLISH VERSION
Natco Pharma vartamaan mein 3 ke Wave IV mein hai, jo 1240-1220 ke aaspaas samaapt ho sakta hai aur Wave V phir 1800-1900 ke star (45%+ jahaan Wave IV samaapt hoga) kee taraf badh sakta hai, jaisa ki chart mein dekh sakte hain. Ek baar naya ATH banaane par adhik sateek target pin kiya ja sakta hai. Do staron (1770 aur 1900) ko sambhaavit supply zone ke roop mein mark kiya gaya hai.
Company ne haal hee mein achhe Q2 ke numbers post kiye hain. Stock vartamaan mein 12.6 ke PE multiple par kaarobaar kar raha hai jabki industry ka average lagbhag 32 hai.
Yah koee bhavishyavaanee nahin balki sambhaavit Wave count hai. Yah trade lene ya invest karne ki bhi salaah nahi hai. Kripya apana vishleshan svayan karen.

Cipla - BullishStock now resting at previous support area
Which also happens to be a flip zone
Area can be read as 1550-60
Quite possible stock may take a break here before starting upward journey
Any close below 1545 will negate the view
If sustains stock may at least try to reach previous high of 1700
Risk reward is excellent, trade accordingly
Better to wait for at least 1 good candle in Hourly TF

Granules India for 35%+ gainsDate: 3 Oct’24
Stock: Granules
Timeframe: Daily chart
Granules India seems to have begun its up move in Wave V of 5 which could end around 810-820 (>35% from current price of 595) as seen in the chart. High volumes and strong reversal of RSI supports this stance.
This is not a trade recommendation. Please do your own analysis.
Aisa lagata hai ki Granules India ne 5 ke Wave V mein apni badhat shuroo kar dee hai, jo 810-820 (595 kee vartamaan keemat se 35%) ke aasapaas samaapt ho sakatee hai, jaisa ki chart mein dekh sakte hain. Achhi volume aur RSI ka majaboot ulataav is rukh ka samarthan karta hai.
Yeh koi vyaapaar ki rai nahin hai. Kripya apna vishleshan khud karein.

CIPLA -Rising wedge BreakoutCIPLA-Rising -Rising wedge Breakout
Name - CIPLA
Pattern - Rising wedge
Status - BreakOut with good volume
Cmp - 1654
Target - 1850
SL - 1600
Pattern
A rising wedge pattern is a technical analysis tool that often signals a potential bearish reversal. It forms when the price of an asset is moving upward, but the trendlines converge, indicating a loss of momentum. When the price breaks below the lower trendline, it typically suggests a downward move.
Fundamentals :
Here are some key financial ratios for Cipla Limited:
Price-to-Earnings (PE) Ratio: 28.71
Debt-to-Equity Ratio: 0.021
Return on Equity (ROE): 16.8%1
Net Profit Margin: 16.5%2
Revenue Growth (TTM): 10.3%2
Enterprise Value to EBITDA: 19.813
Price-to-Sales Ratio: 4.943
These ratios indicate Cipla’s strong financial health, low leverage, and efficient profitability. The company is well-positioned in the pharmaceutical industry with a solid market presence.

CIPLA - Looks good for new highsMay take support of flip zone
Fall has been absorbed it seems
1500-1520 strong support zone
Second strong area for support is 1475-80
Expect atlst 1700-1850 in coming days if holds

CIPLA BULLISH VIEWCIPLA
Now is the right time to invest in cipla
Cipla is ready to break out the resistance trend line
Volumes are also good
my first target@1540
Second target@1660
Stop loss@1317
Disclaimer:
I am not a SEBI Registered Analyst. Anything posted here is my own analysis and views. This is created for educational purposes only. Always consult your Financial Advisor before taking any decision or trade.
Happy trading.
Cipla Ltd. engages in the manufacture and distribution of healthcare products and bulk drugs. It operates through the following segments: Pharmaceuticals and New Ventures. The Pharmaceuticals segment develops, manufactures, sells and distributes generic or branded generic medicines as well as active pharmaceutical ingredients. The New Ventures segment includes the operations of the two wholly owned subsidiaries, Cipla Health Ltd., a consumer healthcare company and Cipla BioTec Pvt. Ltd, which is into the business of Biosimilars. The company was founded by Khwaja Abdul Hamied in 1935 and is headquartered in Mumbai, India.
so please keep CIPLA in your watchlist for long term investment.
If yoU like my view, do support it with a boost witch is valuable inspiration for me to post ideas like this in future. thank you friends!

Cipla Buying Opportunity There is Institution buying zone if price come at that lvl then we can go long.
I am NOT a SEBI registered advisor or a financial adviser. Any of my investment or trade ideas I share on my profile are only my view point.

Cipla - Inverted H&S Cipla has created inverted.
Breakout zone above : 1515
support zone is at 1420 levels
Pattern break out target is 1700.
its a short term trade.

CIPLA - Swing Trade Analysis - 17th May #stocksCIPLA (1D TF) - Swing Trade Analysis given on 17th May, 2024
Pattern: FALLING WEDGE BREAKOUT (Double Bottom)
- Trendline Resistance Breakout - Done ✓
- Volume Buildup at Resistance - Done ✓
- Demand Zone Retest & Consolidation - In Progress
* Disclaimer

Waiting for another Short Trade in Cipla.According to the chart structure the trend is negative.
Today we have an inverted Hammer type candle, the price is rejected from the resistance zone.
Personally I am waiting for a short trade the reason is that on the bigger time frames the correction is pending.
Disclaimer: This is my pre market analysis and my trading journal. Not a suggestion to buy or sell.

CNXPHARMA - Trend Reversal📊 Script: CNXPHARMA (NIFTY PHARMA)
Key highlights: 💡⚡
📈 Nifty Pharma is retesting from its support level shown in chart.
📈 Pharma stocks can give good returns.
📈 One can go for Swing Trade into Pharma stocks.
📊 Script: CIPLA
⏱️ C.M.P 📑💰- 1414
🟢 Target 🎯🏆 - 1510
📊 Script: LUPIN
⏱️ C.M.P 📑💰- 1688
ONLY ABOVE 1700
🟢 Target 🎯🏆 - 1828
📊 Script: AUROPHARMA
⏱️ C.M.P 📑💰- 1177
🟢 Target 🎯🏆 - 1267
📊 Script: GLAND
⏱️ C.M.P 📑💰- 1177
🟢 Target 🎯🏆 - 1267
📊 Script: BIOCON
⏱️ C.M.P 📑💰- 1177
🟢 Target 🎯🏆 - 1267
⚠️ Important: Always maintain your Risk & Reward Ratio.
✅Like and follow to never miss a new idea!✅
Disclaimer: I am not SEBI Registered Advisor. My posts are purely for training and educational purposes.
Eat🍜 Sleep😴 TradingView📈 Repeat 🔁
Happy learning with trading. Cheers!🥂


CIPLA - Ready, Steady, Go!!#CIPLA
Stock gave decent correction last month. Reversed from 1335 levels, then formed a strong damand zone at the level - 1390-1400.
Now earning is there. Market is signing up for the second phase. I never believe that news makes chart. For me chart and technicals are always formed first, many days before, and then news comes into the market.
So as per the chart we can expect a good earning result from Cipla.
The best entry point as per technicals, is at 1435. Stoploss can be seen around 1392-1390 levels on daily closing basis.
The first target we can achieve is at 1500-1520 levels. And if we are able to close above this even on 4 hours candle then target of 1660-1665 can be achived very very soon.
I give classes to #masterclass in live market with practical assignments so won't be able to give much updates. But you don't need it anyway because these are technicals levels and are well defined as per market direction.
This is not a buy/sell reccomendation but a pure study of how we can pick a stock for #SwingTrading. So rather than to jump directly on earning, better focus few days on learning. Because,
Believe or not - Learning is Earning.
Cheers!

CIPLA - In CorrectionCIPLA is in big bullish move but seeing short term correction trend now and price to see its previous support in this month. so may not move up in coming week with out testing support zone.

CIPLA : TARGET - Rs 1490 - Rs 1500 UPWARD MOVEMENTThe excellent bullish engulfing and solid wave pattern displayed by last week's Cipla candles reinforce the upward trend. Cipla should expect achieving the shorter-term target of Rs. 1490–1500, where a significant resistance level is present.
