CIPLA - Ichimoku Bullish Breakout Stock Name - Cipla Limited
Ichimoku Cloud Setup :
1). Today's close is above the Conversion Line
2). Future Kumo is Turning Bullish
3). Chikou span is slanting upwards
All these parameters are showing bullishness at Current Market Price
and more bullishness AFTER crossing 1100
#This is not Buy and Sell recommendation to any one. This is for education purpose and a helping hand to learn trading in Market.
# Cloud Trading
# Ichimoku Cloud
# Ichimoku Followers
I hope you all like my analysis.
Please do share your thoughts into comment section.
Please give a like, it motivates me to do analysis.
Cipla

Nifty Pharma Analysis & LearningNifty Pharma Analysis & Learning. Reversal can be risky but if taken with risk management and proper analysis then it can give good return.


CIPLA INTRADAY STOCK TRADING PROFITKINDLY SWITCH TO 5MIN TIME-FRAME
Used past analysis to find support and resistance level on 15min time frame.
Once marked, waited for breakout or breakdown.
As Cipla breakout, ON 5min Time-frame. A fake breakout green candle formed. And hence reversed back.
Again breakout on 5min Time-frame, then waited for pullback back. A Hammer candle formed at 10:25.
As price break that candle, I took my trade with SL at blue Line.
Hence profit booked.
What if didn't go my way?
Simple take my stop-loss. Because we can increase chances of profit by some analysis. But no analysis is 100% perfect. Just obey stop-loss or Take profit.
You will be profitable.

#CIPLA HarmonicsCipla has given breakout from its supply zone and XABCD is activated. A good opportunity to go long.


CIPLA - Triangle Breakout - Short Term BUYHi Traders,
Cipla has broken the triangle pattern in Daily time frame and expected to reach 1160 levels.
Its an opportunity for Short term BUY.
Buy above 1010 - SL 950
Thanks

3 Swing ideas and Index price action for 21 july I daily make educational content videos on financial markets

CIPLA LTD - BULLISH PATTERNCIPLA LTD seems Inverted Head & shoulder pattern. It's strong bullish pattern. Price breakout the neckline at 985. Now its rally move towards upward resistance. keep concentrate for the price sustain above 985 in daily chart.

Cipla Short term buyTrade strtergy:
Long term in monthly time frame market acting as a support.
based on the support, market broken the day resisting trend line. and also market retested the day tf trend line.
its good time to buy, try to hold upto market monthly resistance

CIPLANSE:CIPLA
One Can Go long with a Strict SL below the Trendline or Swing Low of Daily Candle.
Close should be good, and Clean.
R:R ratio should be 1 :2 .
Disclaimer : You are responsible for your Profits and loss, Shared for Educational purpose

CIPLA for short termChart -> Cipla Daily
Cipla has broken down horizontal and diagonal trendlines as it has closed above 950.
CMP: 953
Targets: 975 and 995
SL: Daily closing below 935
Disclaimer: This is for educational purposes only, not any recommendations to buy or sell. As I am not SEBI registered, please consult your financial advisor before taking any action.

Cipla short termCipla gives a breakpit green candle, short term can cover the last big candle near 970-80 levels, exit below the last support.

CIPLA - Only for IntradayKindly refer trade details as below
1. Sell at/below 953
Target 1 946
Target 2 938
Target 3 931
Target 4 923
Target 5 916
If reverses then
2. Buy at/above 961
Target 1 968
Target 2 976
Target 3 984
Target 4 992
Target 5 1000


CIPLA TRADE SET UP #ciplaHello Friends,
Here is Trade set up in CIPLA as per HARMONIC BAT PATTERN, We can enter in Cipla above 911 for the Target of 972 and 1014 if price go below 860 this set up will not valid.
Happy Trading.

Cipla BuyingCipla-15m
Cmp-865
If it hold the level of 860 then buy for target level of 870 -880
There is a gap border near 900
Below 860 SL

NSE CIPLA: Price Action AnalysisCipla has formed a downtrend channel for two months. Prices are moving below 200 EMA , which indicates a bearish atmosphere. We can see a downtrend channel on the 4-hou r timeframe chart.
Currently, the price has taken support at the lower band of the parallel channel. It has made a range at 938. If the price sustains above 938 , It can touch the upper band of the parallel channel.
Price will make a new low after the breakdown of the parallel channel with heavy supply pressure.
I will Update further information.

Inverted Head And Shoulder in CIPLAInv H&S in daily timeframe
Breakout in 1hr timeframe
Consolidation after breakout in 15min
Trade invalid below 980

CIPLA Shared yesterday and it blasted !!NSE:CIPLA
#NSE:CIPLA shared yesterday and its blasted with 2% result, 9,100 /lot booked and locked in upper circuit.
Wish every one bagged good profits.
Liked our analysis ? Do share your feed back with direct message.
Let LOOT the market together 👍
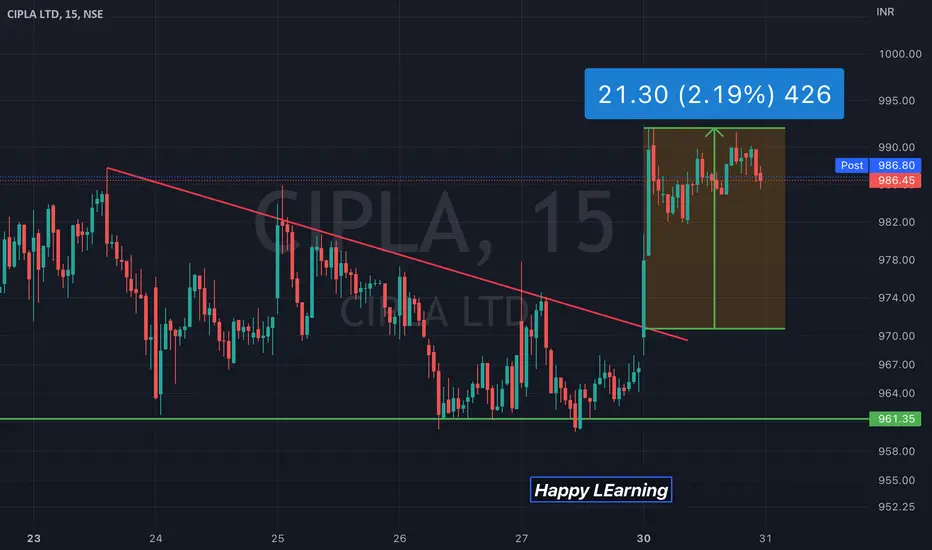
CIPLA descending Triangle !!NSE:CIPLA
#CIPLA Descending triangle, levels marked on chart for practice.
Happy LEarning !!

Cipla forming a pattern on higher time frame.Cipla has been consolidating in a narrow range and is near a break out of trend line.
The stock is forming a inverted head and shoulder pattern on higher time frame (4 hour).
The moving averages are close and stock has been taking support from its 200 ema.
Support :- 963, 941
Resistance :- 988, 1008
There can be a moving averages bullish cross over.
Wait for the price action near the levels and enter the trade with confirmation.
It can be a swing if a daily candle closes above the trend line.

