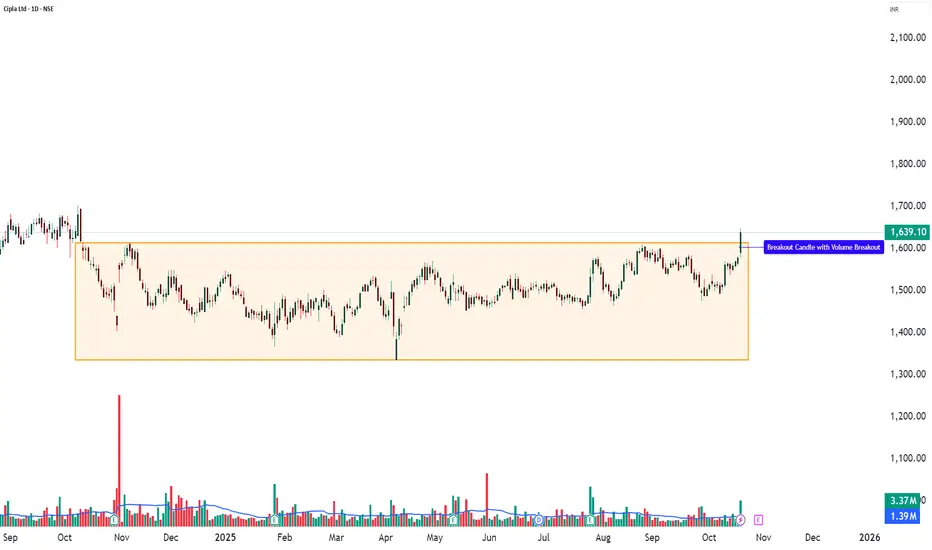
CIPLA – 10-Day Volume Breakout | Bullish Continuation Setup💹 Cipla Ltd (NSE: CIPLA)
Sector: Pharmaceuticals | CMP: ₹1,639.10 | View: Bullish Continuation Setup
🔹 Technical Analysis / Chart Pattern / Price Action / Volume Analysis:
Cipla Ltd shows strong bullish momentum with a clear breakout candle supported by a significant volume surge of 3,372,906 shares, compared to its 20-day average of 1,386,709 shares — a rise of over 2.4 times. This confirms fresh institutional buying and genuine participation behind the move. The open-equals-low formation reflects strong buyer control from the start, while a Bollinger Band breakout with a BB squeeze-off signals that volatility compression has ended, hinting at a sharp upward continuation. The RSI breakout further supports growing momentum, and consistent volume expansion validates trend strength. Overall, the setup represents a bullish continuation structure, where price, volume, and momentum align perfectly — a textbook example of a powerful breakout phase supported by conviction buying.
🔹 Key Levels:
Resistance: 1665 / 1690 / 1733
Support: 1566 / 1537 / 1498
🔹 STWP Trade Analysis:
Bias: Bullish
Breakout Level: 1647
Intraday Support: 1620
Swing Support: 1553
Intermediate Support: 1535
🔹 HNI Trade Analysis:
Possible Accumulation Level: 1639 - 1647
Possible Low Levels: 1629
Support Levels: 1624 - 1606
🔹 Final Outlook:
Momentum: Moderate | Trend: Neutral | Risk: Low | Volume: High
🔹 Learning Note (Educational Purpose):
This setup is a great example of how a breakout with strong volume and RSI confirmation can signal a shift from consolidation to momentum. It helps learners understand that when price, volume, and indicators align together, it often leads to a trend continuation phase. Always observe how volume expands during breakouts — it’s one of the strongest clues of institutional activity.
🔹 STWP Mentor Note:
A clean breakout backed by strong volume is not just a signal — it’s a lesson in patience and timing. Smart traders wait for clarity, not noise. As a learner, focus on identifying structure, strength, and sustainability in every move. Remember, every breakout teaches discipline — stay consistent, study reactions, and always trade with patience and purpose.
───────────────────────────────────────────────
⚠️ **DISCLOSURE & DISCLAIMER (SEBI-Compliant)**
───────────────────────────────────────────────
📘 **Purpose:**
This content is created **solely for educational and informational purposes** to help readers understand market structure, price action, and technical analysis.
It does **not constitute investment advice**, research recommendation, or a solicitation to buy or sell any security.
👤 **Author Disclosure:**
The author is **not a SEBI-registered investment adviser or research analyst.**
All chart studies, price levels, and observations are based on publicly available data (e.g., **NSE India**, **TradingView**) and are presented purely for **learning illustration**.
📊 **Position Status:**
No active position in * * at the time of publication.
“The author may sometimes trade in the securities discussed, but such trades are independent and shared here only for educational understanding.”
⚠️ **Risk Disclosure:**
Trading and investing involve financial risk. Market movements can be unpredictable, and losses may exceed invested capital.
Readers are strongly advised to consult a **SEBI-registered investment adviser** before making any trading or investment decisions.
🧠 **Responsibility Clause:**
By engaging with this post, you acknowledge that you are **solely responsible for your own trading or investment decisions**, and that this content is intended only for **market education and awareness**.
───────────────────────────────────────────────
💬 **Did You Find This Useful?**
If this analysis helped you understand price structure or market psychology better:
🔼 **Boost** to support transparent & structured financial education.
✍️ **Comment** your insights, observations, or questions — let’s learn together.
🔁 **Share** this post with learners and aspiring traders who value discipline.
📚 **Follow stwp** for more structured, educational breakdowns on stocks & setups.
🚀 *Stay Calm. Stay Clean. Trade With Patience.*
💡 *Trade Smart | Learn Zones | Be Self-Reliant.*
───────────────────────────────────────────────
Ciplaanalysis
Cipla - triple bottom patternCipla has formed a triple bottom pattern on the daily chart, suggesting a potential bullish reversal. The stock has been consolidating near its key support level, indicating accumulation by buyers. Increased trading volume highlights growing buying interest and supports the possibility of continued bullish momentum.
The technical indicators also align with this outlook. The RSI is trending upwards at 43.59, signaling improving strength, while the Stochastic RSI has shown a positive crossover, further confirming the potential for an upward move. A breakout above Rs 1,460 could trigger a rally toward the immediate targets of Rs 1,550 and Rs 1,580. On the downside, the support at Rs 1,430 provides a favourable buying opportunity for investors.
Strategy: Buy
Target: Rs 1,550, Rs 1,580
Stop-Loss: Rs 1,400


Cipla - BullishStock now resting at previous support area
Which also happens to be a flip zone
Area can be read as 1550-60
Quite possible stock may take a break here before starting upward journey
Any close below 1545 will negate the view
If sustains stock may at least try to reach previous high of 1700
Risk reward is excellent, trade accordingly
Better to wait for at least 1 good candle in Hourly TF

CIPLA - Looks good for new highsMay take support of flip zone
Fall has been absorbed it seems
1500-1520 strong support zone
Second strong area for support is 1475-80
Expect atlst 1700-1850 in coming days if holds

CIPLA BULLISH VIEWCIPLA
Now is the right time to invest in cipla
Cipla is ready to break out the resistance trend line
Volumes are also good
my first target@1540
Second target@1660
Stop loss@1317
Disclaimer:
I am not a SEBI Registered Analyst. Anything posted here is my own analysis and views. This is created for educational purposes only. Always consult your Financial Advisor before taking any decision or trade.
Happy trading.
Cipla Ltd. engages in the manufacture and distribution of healthcare products and bulk drugs. It operates through the following segments: Pharmaceuticals and New Ventures. The Pharmaceuticals segment develops, manufactures, sells and distributes generic or branded generic medicines as well as active pharmaceutical ingredients. The New Ventures segment includes the operations of the two wholly owned subsidiaries, Cipla Health Ltd., a consumer healthcare company and Cipla BioTec Pvt. Ltd, which is into the business of Biosimilars. The company was founded by Khwaja Abdul Hamied in 1935 and is headquartered in Mumbai, India.
so please keep CIPLA in your watchlist for long term investment.
If yoU like my view, do support it with a boost witch is valuable inspiration for me to post ideas like this in future. thank you friends!

Cipla Buying Opportunity There is Institution buying zone if price come at that lvl then we can go long.
I am NOT a SEBI registered advisor or a financial adviser. Any of my investment or trade ideas I share on my profile are only my view point.

CIPLA TARGET 1400 ?????? 50% Rise On Cards ?????It Will Be 20 Year Channel Breakout
If Cipla Closes Abvoe 865 On 31st Jan 2021
Watch It Closely..

Cipla Short Term TargetCipla taken Multiple support at previous resistance level of 1415 - 1420.
Morning star pattern observed near support, along with positive reversal in momentum.
Entry was today @ 1440 with a stop loss @ 1415 and a target of 1500, 1505, 1510.
Happy Trading,
Cheers,
Yamini Prabu
NISM Certified TA,
Independent Trader/Trainer.

CIPLA CIPLA Looks good for Swing or Longterm Investment We can clearly see a Perfect Breakout with Mandatory Retest & Now Stock Ready to Fly further Rally
KEEP ON RADAR

buy sidekeeping trades simple - based on trendline + resistance breakout
and with strong market support
buy entry in cipla for target range 1214-1218-122
stop as per comfort
disclaimer - trade @ ON RISK

intra tradeintraday eyeing for target 1178
purely based on resistance cross - and fibo level
disclaimer - trade at own risk

INTRADAY TRADE FOR TOMORROW If Stock opens Gap up or Gap down from the buy price please Avoid trade
DISCLAIMER:- I'm not SEBI registered research analyst or investment adviser. All stocks & information given is for educational purpose only. Consult with your financial advisor before taking the trade on my views given here.

Cipla BO Analysis Stock is trading maintaining supportive trendline, If the stock sustained above BO level, then near target may be achieved in coming days, follow chart for proper support and resistance levels.

Cipla - Stuck in parallel zone , Anticipating break out Posted for educational purpose.
Weekly chart of Cipla. It’s stuck in parallel supply and demand zone range for past 6 weeks.
Last spike is result day reaction. As the latest quarterly results posted on Friday ( 12th May ) looks to be good and may potentially trigger break out from this range.
Current price is 937.5
Stop loss of 930 ( < 1 % )
1st target 955 - 960 ( ~2% ) and if it sustains the potentially reach 996 - 1000 ( 6% ) as next target.

head and shoulder formation in cipla cipla have formed a very good head and shoulder parttern lets hope we can short sell it tomorrow, one thing you should keep in your mind is this parttern is formed on daily timeframe meaning that it well more powerfull and effective but if it goes up then you should wait few hours or days one thing i know is this partern is definetly going to ork keep your keep eyes on cilpa

Cipla Monthly Chart: Looks InterestingCipla Monthly Chart:
Looks intresting.
Currently trading just below long term trend line after a long consolidation period from 2014-2020.
If it breaks we may see 2004-2014 move in this

Cipla Ltd. (CIPL)breakoutlevelCipla Ltd. (CIPL) @breakout level
Strong breakout with volume break out and momentum created in day chart.
breakout for long. so strong upside are coming.
BUY above 1052
NEXT TARGET 1067.40,1092.40,1110.3
Time to go for long, get ready to catch the profit. Thank you.

CIPLA INTRADAY STOCK TRADING PROFITKINDLY SWITCH TO 5MIN TIME-FRAME
Used past analysis to find support and resistance level on 15min time frame.
Once marked, waited for breakout or breakdown.
As Cipla breakout, ON 5min Time-frame. A fake breakout green candle formed. And hence reversed back.
Again breakout on 5min Time-frame, then waited for pullback back. A Hammer candle formed at 10:25.
As price break that candle, I took my trade with SL at blue Line.
Hence profit booked.
What if didn't go my way?
Simple take my stop-loss. Because we can increase chances of profit by some analysis. But no analysis is 100% perfect. Just obey stop-loss or Take profit.
You will be profitable.

CIPLA LTD - BULLISH PATTERNCIPLA LTD seems Inverted Head & shoulder pattern. It's strong bullish pattern. Price breakout the neckline at 985. Now its rally move towards upward resistance. keep concentrate for the price sustain above 985 in daily chart.

CIPLA - Only for IntradayKindly refer trade details as below
1. Sell at/below 953
Target 1 946
Target 2 938
Target 3 931
Target 4 923
Target 5 916
If reverses then
2. Buy at/above 961
Target 1 968
Target 2 976
Target 3 984
Target 4 992
Target 5 1000

CIPLA TRADE SET UP #ciplaHello Friends,
Here is Trade set up in CIPLA as per HARMONIC BAT PATTERN, We can enter in Cipla above 911 for the Target of 972 and 1014 if price go below 860 this set up will not valid.
Happy Trading.

NSE CIPLA: Price Action AnalysisCipla has formed a downtrend channel for two months. Prices are moving below 200 EMA , which indicates a bearish atmosphere. We can see a downtrend channel on the 4-hou r timeframe chart.
Currently, the price has taken support at the lower band of the parallel channel. It has made a range at 938. If the price sustains above 938 , It can touch the upper band of the parallel channel.
Price will make a new low after the breakdown of the parallel channel with heavy supply pressure.
I will Update further information.
