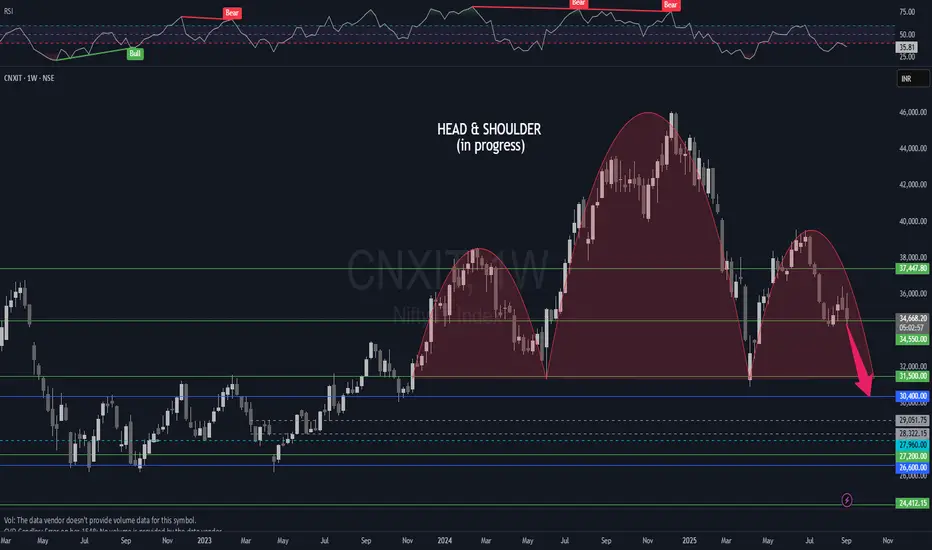
CNXIT - Head & Shoulder in progress on weekly chartsThe Indian IT sector is in a terrible state. The formation of a head and shoulder pattern on a weekly chart is a disastrous indication of worse times ahead. While NSE:TCS fired 15k employees in the recent past, the future seems dimmer. A similar pattern can be observed in almost all IT stocks. Caution is the way forward. All the long positions in IT must be doubly checked and closely monitored.
Disclaimer: The idea is for educational and informational purposes only and must not be construed as advice to buy/sell. Please consult your investment advisor before making a financial decision. Investments are subject to market risks!
CNXIT
Nifty - Sellers have applied their brakes! On Friday’s red candle, buyers actually beat sellers by 26 million in volume.
And exactly as expected, that showed up today – market gave the move.
If you understand price and volume analysis in NSE:NIFTY , you’ve already cracked 90% of the game. The rest is just how well you execute and manage your psychology. #LearningIsEarning
Now about today’s move –
Nifty again saw buyers ahead of sellers by 60 million volume.
But honestly, I’m a bit doubtful about this rally. It looks more like short covering from last week’s positions.
Many traders closed early because Friday is off for Independence Day – fewer days left for options traders this week.
My view remains – sell on rise.
Options data still suggests bounce till 24800 If Nifty crosses 24635 tomorrow, it can head to 24800 and even 25000 in the coming days. I’ll be watching that resistance closely.
Support from intraday perspective is around 24450.
NSE:BANKNIFTY can also follow through till 55575 in the next few days if it breaks 55650.
For sectors, keep NSE:CNXPSUBANK , NSE:CNXIT and NSE:NIFTY_IND_DEFENCE on the radar.
That’s all for today. Take care and have a profitable tomorrow.

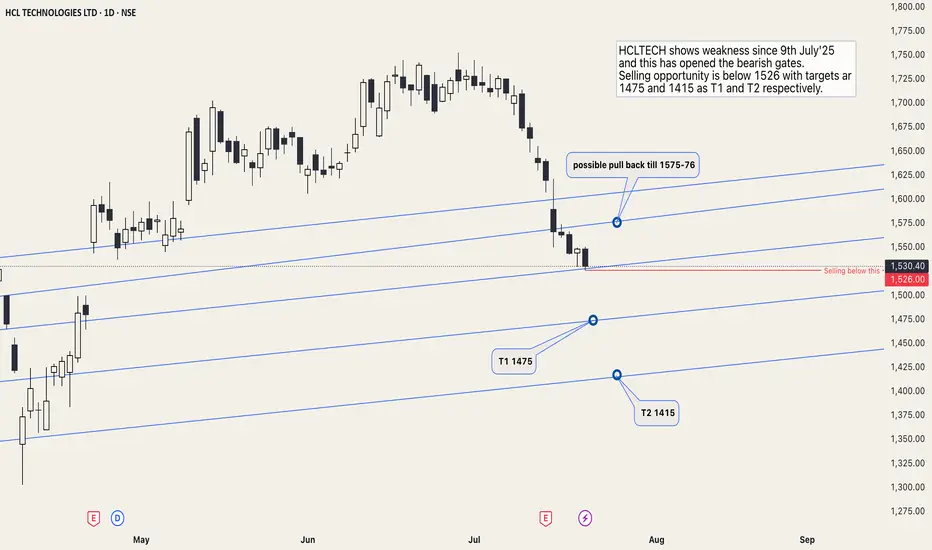
HCLTech bearish strategyHCLTECH has shown weakness since 9th July'25, and this has opened the bearish gates.
The selling opportunity is below 1526, with targets at 1475 and 1415 as T1 and T2, respectively.
The price is also inclined to pull back before it falls further, almost till 1576-75. If the price doesnt give a valid breakdown at the selling entry price, the bearish move will be at halt for sometime.
CNXITThe CNX IT index is currently forming an inverse Head & Shoulders pattern, a bullish reversal formation. The index made a bottom at 30918 on 7th April 2024, which aligns with a prior support zone tested on 4th June 2024, followed by a strong upward move. This double test of support indicates a solid base formation.
If the pattern plays out, a breakout above the neckline could open the way toward the supply zone of 41600–43430, where previous selling pressure was observed.

Nifty IT, bearish signalsBearish Divergence Alert on #NIFTYIT
A classic warning sign! Price made a higher high, but RSI made a lower high
RSI nearing 50, a breakdown confirms further fall.
Be alert for IT stocks.

Sector analysisHello & welcome to this analysis
In this video I have covered Nifty Next 50, Bank Nifty, Nifty IT, Nifty Oil & Gas and Nifty Realty indexes.
You can check out my coverage of sector analysis done earlier on November 16 also in the link below
Happy Investing & Trading

NiftyIT - CNXIT - Weekly -Cup and HandleNifty IT Weekly analysis of the Nifty IT Index, showing a Cup and Handle pattern
Key Insights:
Cup and Handle Pattern:
The pattern began forming around mid-2022 and completed by 2023.
The breakout from the handle occurred around 38,539.00, which is a critical support level now.
Measured Move and Target:
The chart projects a potential upside target near 51,077.75, based on the height of the cup.
A 48.01% gain from the lowest point of the cup is also marked, giving more context to the potential upside.
The measurement from the cup's bottom to the breakout level shows a 32.48% gain potential from the breakout point.
Price Action:
The index reached a recent high of 43,645.90 before pulling back slightly to 42,089.30.
The pullback might be a healthy consolidation after the strong upward move.
Support Levels:
Key support is identified at 38,539.00, which was the breakout point of the handle.
The chart shows another strong support level at 26,164.20, which was the bottom of the cup, though this level seems far from the current price.
Conclusion:
The Nifty IT Index appears to be in a bullish continuation phase after breaking out of a multi-month cup and handle pattern. While the target of 51,000 seems plausible, a healthy pullback or consolidation might occur around the 42,000 to 38,500 levels before further upside.
The CNX IT (Nifty IT) index consists of the major IT companies
Here's a list of the top stocks that are generally part of the Nifty IT Index:
Tata Consultancy Services (TCS)
Infosys Ltd.
Wipro Ltd.
HCL Technologies Ltd.
Tech Mahindra Ltd.
L&T Technology Services Ltd.
Mphasis Ltd.
Coforge Ltd.
Persistent Systems Ltd.
LTIMindtree Ltd.

CNXIT BULLISH !
1. Resistance Breakout:
- The index has historically faced selling pressure at 38,653 - 38,405 Zone, causing it to reverse or pause its upward movement.
- When a stock breaks above a strong resistance level, it means that buying demand has overwhelmed the selling pressure at that price point. This breakout is a positive sign, indicating that the chart may move higher, especially if it is a clean break (i.e., it closes significantly above the resistance level).
- The **strength of the breakout** is often measured by the volume of trading activity. If the breakout occurs on **high volume*, it indicates that a large number of market participants are involved, adding credibility to the When a stock breaks through a strong resistance level and retests that level with good volume, it can signal a strong bullish move. Here's a detailed breakdown:
2. Retest of the Resistance Level:
- After the breakout, it’s common to see a retest of the previous resistance level, which now acts as a support level. This retest occurs as some traders may take profits, or there may be some temporary selling pressure as the market re-evaluates the new price.
- If the stock successfully holds above the previous resistance (now support) on the retest, it confirms that the breakout was valid. This gives bulls (buyers) more confidence that the level will hold and that the stock has further upside potential.
3. Volume Confirmation:
- A retest with good volume is essential. If the stock holds the new support on strong volume, it signals that buyers are stepping in to defend the level, further reinforcing the idea that the stock is in a bullish phase.
- Conversely, if the retest occurs on low volume, it may indicate a lack of conviction from buyers, and the breakout may be prone to failure.
4. Bullish Expectations:
- When a stock breaks out of resistance and successfully retests it with strong volume, the expectation is that the stock will enter a new bullish trend. The prior resistance has now been transformed into a solid base of support, and the stock may experience momentum buying, pushing prices higher.
- Traders often see this scenario as a low-risk, high-reward setup. Their stop-loss would typically be placed just below the new support level, while the upside target could be based on previous price patterns, such as Fibonacci extensions or previous highs.
5.Target :
- it is on its all-time high targets on fib zones,pivots 0r based on future price action basis.
# Summary:
- **Breakout of strong resistance Indicates potential for higher prices.
- **Retest of resistance as support Confirms strength of the move if support holds.
- **Good volume on retest: Adds confidence in the bullish move.
- **Bullish expectation Likely continuation of the upward trend.
This combination forms a high-probability bullish setup in technical analysis.
#cnxit #itsector #nifty

CNXIT // Levels // 1 hour "Welcome to SkyTradingZone "
Hello Everyone 👋
CNXIT (Nifty IT) index on a 1-hour interval
Support Levels: These are price levels where the index historically tends to find buying interest. Look for recent lows or previous points where the price has bounced back up.
Resistance Levels: These are price levels where the index has historically struggled to rise above. Look for recent highs or points where the price has reversed downwards.
Support Levels:
42,800
42,500
Resistance Levels:
43,200
43,500

CNXIT // levels // 1 hour "Welcome to SkyTradingZone "
Hello Everyone 👋
Support Levels
Definition: A support level is a price point where a downtrend is expected to pause due to a concentration of demand. It represents a level where buyers tend to enter the market, which prevents the price from falling further.
Identifying Support: Support levels can be identified by looking at past price movements. If the price has bounced off a certain level multiple times, that level may be considered support.
Trading Strategy: Traders often look for buying opportunities around support levels, anticipating that the price will rise again after hitting this level.
Resistance Levels
Definition: A resistance level is a price point where an uptrend is expected to pause due to a concentration of supply. It represents a level where sellers tend to enter the market, which prevents the price from rising further.
Identifying Resistance: Resistance levels are identified similarly to support levels. If the price has hit a certain level multiple times and failed to break through, that level is considered resistance.
Trading Strategy: Traders often look for selling opportunities around resistance levels, anticipating that the price will drop after reaching this point.

Nifty IT Levels For Long or swing TradingNifty IT Chart Overview:
Current Value: ₹24,7801.
Recent Performance:
1 day: +0.76%
5 days: +1.47%
1 month: +2.40%
6 months: +12.59%
Year to date: +15.11%
1 year: +29.61%
5 years: +127.45%
Key Data Points:
Volume: Not specified
Previous close: Not specified
Open: Not specified
Day’s range: Not specified
Recent Analyst Views (August 22nd):
Price was moving in a wide range for two days and broke out above the consolidation range.
Buy Above: ₹24,780
Stop Loss: ₹24,740
Targets: ₹24,820, ₹24,860, ₹24,890, and ₹24,920
Sell Below: ₹24,680
Stop Loss: ₹24,720
Targets: ₹24,640.

Coforge Swing Idea Weekly timeframe is bullish
Daily timeframe is bullish and price has tapped into daily demand zone and reacted positively
4HR is also bullish
Also, Nifty and CNX IT is also bullish
Company is also 10% away from all time highs because of that the stock can rip high
Note : this is not Financial advise

CNXIT or Nifty-IT Levels For Swing Trader's #stocksCertainly! Here are the intraday trading levels for the CNXIT or Nifty-IT :
Intraday Trading Levels:
For intraday trading in CNXIT or Nifty-IT , consider the following levels:
Support & Resistance Trend Lines from Daily Chart: These trend lines provide important support and resistance levels.
Previous Day High (PDH) and Previous Day Low (PDL): These levels act as support and resistance during live market hours.
Remember that trading involves risks, and it’s essential to have a well-defined strategy and risk management plan.
NOTE
#This channel Purpose to share market ideas.
Thanks for Watching🙏

CNXITCNXIT breadth is 100% since 3rd May 2023
past 20 year this index is in parallel channel.
after sideways movement can we may expect an upmove which will bring bear trap for current setup


CNXIT | ITBEESDisclaimer: This analysis is solely for educational purposes and does not make me a SEBI registered analyst.
If you found this analysis helpful, I encourage you to like and share it. Your observations and comments are also welcomed below. Your support, likes, follows, and comments motivate me to consistently share valuable insights with you.
🔍 More Analysis & Trade Setups 🔍
For more technical analysis and trade setups, make sure to follow me on TradingView: www.tradingview.com


NIFTY IT - Breakout + RetestNSE:CNXIT Looks Good for Fresh Entry.
NOT A RECOMMENDATION. JUST FOR EDUCATION.

CNXIT OR NIFTYIT INTRADAY BUY PUT 🤑👑👑Royal Trade👑
CNXIT IMPORTANT LEVEL
we buy Put and my Target in videos
Dont buy any trade without stop loss
This is only level we upload new idea in morning 9.30
Buy when Market Break
The support or Resistance
and wait for the closing and
set stop loss at the
last opening of the candle.
NOTE
#We Are Not Promote Anything
#This channel Purpose to share market ideas.
Thanks for Watching🙏

CNXIT OR NIFTY IT INTRADAY TRADE👑Royal Trade👑
CNXIT IMPORTANT LEVEL
we buy Put and my Target in videos
Dont buy any trade without stop loss
This is only level we upload new idea in morning 9.30
Buy when Market Break
The support or Resistance
and wait for the closing and
set stop loss at the
last opening of the candle.
NOTE
#We Are Not Promote Anything
#This channel Purpose to share market ideas.
Thanks for Watching🙏

CNXIT or Nifty IT INTRADAY TRADE👑🤑💸👑Royal Trade👑
CNXIT IMPORTANT LEVEL
we buy Put and my Target in videos
Dont buy any trade without stop loss
This is only level we upload new idea in morning 9.30
Buy when Market Break
The support or Resistance
and wait for the closing and
set stop loss at the
last opening of the candle.
NOTE
#We Are Not Promote Anything
#This channel Purpose to share market ideas.
Thanks for Watching🙏

