Nifty is Bullish but not Fully. Waiting for Confirmation move So just like we anticipated, Nifty opened with a gap down — and gave a beautiful bounce right from the start. NSE:CNXPHARMA led the charge exactly as we discussed yesterday, proving once again how preparation beats prediction.
Nifty's Pivot has now shifted to 24755, and the Pivot Percentile has climbed to 0.26 — clear sign that we may see another directional move tomorrow. The market is heating up again.
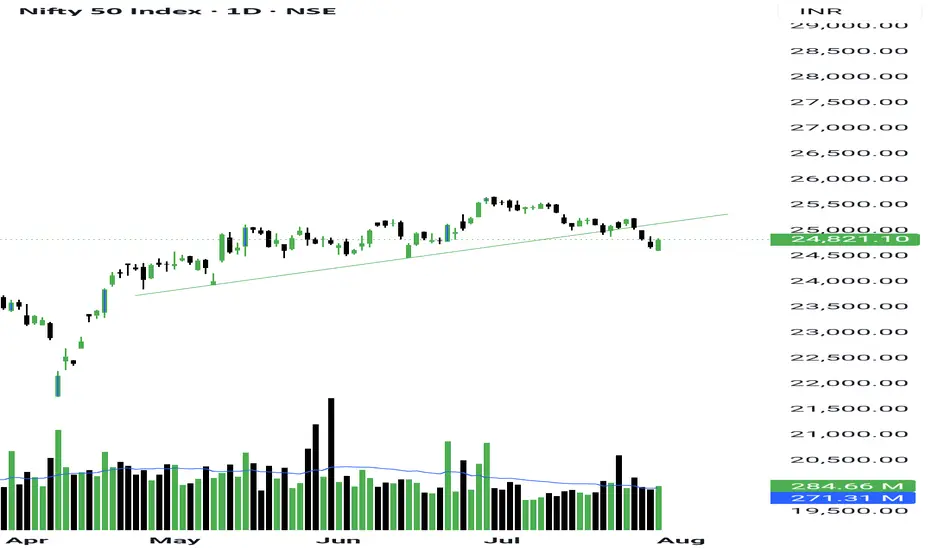
Today's candle on NSE:NIFTY is a classic liquidity grab — trapped shorts at the bottom and a clean reversal. That has flipped the intraday trend to the upside. From here, any dip should be seen as a buying opportunity — but only with a strict stoploss.
Support for Nifty stands strong at 24800, while the key resistance remains at 25000. If momentum holds, we might just test that level tomorrow.
Now coming to NSE:BANKNIFTY — the pivot is at 56120 with support around 56000. This index also looks bullish on the intraday timeframe, showing signs of strength building up.
Remember clearly that the market is just bouncy on intraday and a clear bullish sign is still not visible. So trade with that in mind. Use tight Stoploss.
On the sectoral front, #Fertilizer and NSE:NIFTY_MS_IT_TELCM stocks are catching our attention. Both showing solid accumulation patterns and might lead the next leg of momentum.
As for trades, today was another green day. Here's how the setups I traded recently played out:
1. NSE:HIRECT – locked 19.99%
2. NSE:PARADEEP – up 8.57%
3. NSE:TATACHEM – added 7.03%
4. #DHANUKA – 6.01% in the green
5. #JBCHEPHARMA – gave a clean 5%
6. #IXIGO – hit 5% upside
7. #PRIVISCL – moved more than 5%
Another day of solid execution following my Earnings Pivot Strategy.
That’s it for today. Rest well, manage your risk, and let’s get ready for tomorrow.
Stay sharp and trade safe.
CNXPHARMA
CNXPharmaCNXpharma has double in 2 yrs. pls check our post from 2022 for bear trap formed thr
multiple stocks are showing early sign of distribution in cnxpharma
be careful with your longs.
21380 below selling may start and 23900 above fresh bulls could be watched

CNXPHARMA: Pharma Index Showing Strength
#CNXPHARMA
The Pharma Index is demonstrating robust strength compared to other indices in recent sessions. Key observations include:
Bullish Momentum: The chart reflects strong bullish candles over the past few days, indicating growing buying interest.
Trend Confirmation: The index is forming a consistent pattern of Higher Highs (HH) and Higher Lows (HL), a classic sign of an uptrend.
EMA Support: All critical Exponential Moving Averages (EMAs) are providing strong support, and the price has been closing above these levels consistently, reinforcing the bullish sentiment.
Positive Relative Strength: Relative strength against Nifty has turned positive, highlighting Pharma's outperformance within the broader market.
Action Plan
Consider exploring Pharma ETFs as an option to capture the sector's upward momentum.
Analyze individual pharma stocks within the index for potential breakouts. Look for stocks aligning with this bullish trend for entry opportunities.

CNX Pharma also testing 3 times tested resistanceCNX Pharma about to break long Parallel Channel, when it break pharma stocks will move immensely.

CNXPHARMA - Trend Reversal📊 Script: CNXPHARMA (NIFTY PHARMA)
Key highlights: 💡⚡
📈 Nifty Pharma is retesting from its support level shown in chart.
📈 Pharma stocks can give good returns.
📈 One can go for Swing Trade into Pharma stocks.
📊 Script: CIPLA
⏱️ C.M.P 📑💰- 1414
🟢 Target 🎯🏆 - 1510
📊 Script: LUPIN
⏱️ C.M.P 📑💰- 1688
ONLY ABOVE 1700
🟢 Target 🎯🏆 - 1828
📊 Script: AUROPHARMA
⏱️ C.M.P 📑💰- 1177
🟢 Target 🎯🏆 - 1267
📊 Script: GLAND
⏱️ C.M.P 📑💰- 1177
🟢 Target 🎯🏆 - 1267
📊 Script: BIOCON
⏱️ C.M.P 📑💰- 1177
🟢 Target 🎯🏆 - 1267
⚠️ Important: Always maintain your Risk & Reward Ratio.
✅Like and follow to never miss a new idea!✅
Disclaimer: I am not SEBI Registered Advisor. My posts are purely for training and educational purposes.
Eat🍜 Sleep😴 TradingView📈 Repeat 🔁
Happy learning with trading. Cheers!🥂


INDSWFT LAB :- A STRONG BREAKOUT ON THE LINE NSE:INDSWFTLAB
Ind-Swift Laboratories Ltd. engages in the manufacture, development, and marketing of pharmaceutical ingredients. The firm operates throughout India and Outside India's geographical segments. Its products include API's and impurities. The firm supplies active pharmaceutical ingredients to pharmaceutical companies and also provides research and development services.
📊Technical analysis:
1. IT has formed a strong horizontal resistance at 125 zone from the last 13 years.
2. Now it's consolidating near resistance for a few weeks and may attempt to break that.
3. Volume has been spiking.
4. Trading above all EMA clusters (short, mid and long term EMA)
🟢Entry : Wait for a day candle confirmation to close it above the 125 level then enter the high.
🔴Same with stop-loss levels it will be triggered on weekly candle closing.
⏳Trade Duration: Few months ( positional basis)
🎯Targets are marked on the chart.
Finally reached here then like please share with friends.
Keep Learning,
Happy Trading.

AUROBINDO PHARMA - STRONGEST STOCK IN CNXPHARMA UNIVERSEAuroPharm is leading this up move in CNX Pharma.
Potential target of 1300+ in 1-3 months.

CNPHARMA HEADING HIGHERNifty Pharma has been consolidating since 9th August 2023 in a complex range-bound correction.
It is now reading to head higher in a wave 5 circle. Today's strong move is possibly wave i of 5.
Lupin, Aurobindo Pharma, and Glenmark are stronger sub-counters.

Strength is coming Ratio chart is showing positive divergence which means index is likely to strengthen against Nifty50.
11300-11100 is the zone to watch out for bottom or wait for positive divergence on daily CNX Pharma chart. Pharmabees is the instrument which can be used for investment.
Disc : It's not an investment advise to buy or sell.

CNXPHARMAIt is breaking out in ratio chart that means in coming days pharma will be outperforming the NIFTY. Strong stock from this sector can be bought.

#CNXPHARMAUpside only on crossing 12618 decisively
Upside then till 13458
Currently forms TinyIC on Weekly

#CNXPHARMAUpside only on crossing 12618 decisively
Upside then till 13458
Currently forms TinyIC on Weekly


CNXPHARMA - view for Aug second weekCNXPHARMA -Pharma is in falling channel with and also probably forming a H&S pattern. Invalidation level for the same is marked which is also closed to the channel breakout levels ...

LALPATHLAB Watchlist
#LALPATHLAB (D):-CMP 2484.2 Looks Good for more upsides :)
#Disclaimer:-View shared is for educational purposes only.

SUNPHARMA | Near 7Yr Resistance| Rocket Abv 1080 | 70% UpsideNSE:SUNPHARMA
7 month Consolidation between 800 - 940 & recently Breakout from Ascending Triangle
Price approaching 7 Year Resistance zone of 1070 - 1080.
Breakout above the resistance zone will make Sunpharma a Rocket.
Short Term Target : 1070
Long Term Target : 1542 - 1831
Upside : 50%-70%
SL : 880
Rising in Channel since March 2020 and Taking support from 20 & 50 Week EMA
RSI is consistently in Bullish Zone

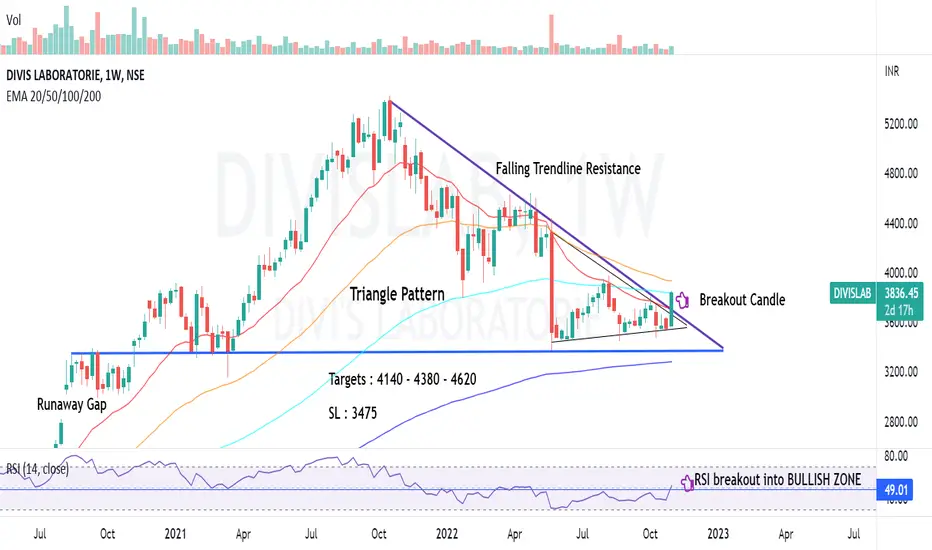
DIVIS LAB | Triangle Pattern BO with Vol | 20%NSE:DIVISLAB
Breakout with volume from Triangle Pattern
Targets : 4140 - 4380 - 4620
Upside : 20%
SL : 3475
Time Frame : 3-6 Months
RSI Back in Bullish Zone
CMP above 20 & 200 Week EMA
TORRENT PHARMA | W Pattern & ATH BO | Minm 35%NSE:TORNTPHARM
All Time High Breakout
W Pattern Breakout
Price moving up in Rising Channel
Targets : 1890 - 2030 - 2250
Upside : 35%
SL : 1550
Time Frame : 3-6 Months
RSI in Bullish Zone & Weekly EMAs acting as Support

ZYDUS LIFESCIENCE | Positive Trend with Newsflow | 35% PotentialNSE:ZYDUSLIFE
Stock is in Higher High Higher Low Formation after major correction, which indicates Positive Trend.
CMP above all Weekly EMAs & RSI Rising in Bullish Zone
Immediate Resistance Zone @430-435 after which
Targets : 460 - 500 - 540
Upside : 35%
SL : 395
Time Frame : 3 - 12 Months

CNX PHARMA | Flag Breakout | 27% UpsideNSE:CNXPHARMA
Flag Breakout on Monthly Charts
Monthly Closing above 50 Month EMA & trading above all long term EMAs
RSI in Bullish Zone
Next Targets : 14700 - 16500
Upside : 27%
SL : 12100
Time Frame : 6 - 12 Months
Participate via PHARMABEES, PharmaFund

CN Pharma - NIfty PharmaVery good trend reversal candle on 19th Sep.
beautiful daily trend breakout.
trend up.
any pullback to be bought into.
important trend lines marked.
Crucial Level marked.
Follow for more updates.
Like and share the idea with your trading collegues / friends.
