COALINDIA | Price at Major Supply, Volume Spike Signals Decision💹 Coal India Ltd (NSE: COALINDIA)
Sector: Mining & Energy | CMP: 427.9
View: Range Breakout Test — Price at Major Supply, Volume Spike Signals Decision Zone
Coal India has transitioned out of a prolonged consolidation phase marked by a rising base and repeated supply absorption near the upper band. A sharp upside expansion, supported by exceptionally high volume, has pushed price above the earlier range high near 420 and into a major historical supply zone between 430 and 440, placing the stock in a critical decision area. While this move reflects strong participation and a shift in market character, it also carries elevated risk, as prior rallies from this region have seen profit absorption. Acceptance above the 425–429 zone is now the key validation point; sustained stability would indicate a structural change, while rejection would reaffirm the broader range context. Momentum indicators and price–volume alignment confirm strength, with bullish VWAP alignment, Bollinger Band expansion, and a release from compression, though oscillators remain overbought, signalling the possibility of near-term cooling after an aggressive expansion. Relative strength versus the broader market remains positive, reinforcing leadership behaviour, albeit with price extended from its mean.
From a derivatives perspective, positioning remains bullish yet institutionally controlled, with activity clustered around the near-ATM 425–430 zone and 427.5 acting as a liquidity pivot, suggesting efficient directional expression rather than speculative chasing. The structure reflects a combination of near-ATM call long build-up and ITM call short covering across 400–420, explaining the sharp upside momentum while highlighting that sustained continuation will depend on fresh long participation once covering normalizes. Selective long build-up is emerging at higher strikes in the 430–440 zone, adding depth and credibility to the bullish structure. Volatility remains constructive, with implied volatility in a low-to-moderate band expanding in an orderly manner alongside price, supporting structured directional frameworks while keeping time-decay considerations relevant. On the put side, short build-up across 420, 415, and 410 is supportive, effectively building a visible support base below spot, while long unwinding in deeper puts points to reduced downside hedging demand rather than rising fear.
The demand framework is well layered across timeframes, providing clarity on potential reaction zones during pullbacks. Intraday demand is visible at 414–411.90, with a deeper cushion at 408.60–406.75, complemented by aggressive demand pockets at 408.35–407.60 and 402.90–402.50. From a swing perspective, 402.80–399.50 marks a key accumulation band, while on the daily timeframe 404–395.50 defines the primary trend support and 387.35–382.85 anchors the higher-timeframe demand base. As long as these higher-timeframe zones are respected, pullbacks are more likely to be absorptive rather than distributive.
STWP Trade Analysis: The observed price zone is 429.50, with a structure-based risk reference level at 397.15 and a defined risk distance of 32.35. Within the STWP HNI framework, the primary observation zone lies between 427.90 and 429.50, with a structural invalidation level at 424.08. An alternate low-risk observation area is identified near 421.56, with a corresponding risk level at 415.65, while higher observation zones are mapped at 439.35 and 446.98. These levels function purely as price-behaviour checkpoints to evaluate strength, acceptance, or rejection within the prevailing structure and are not intended as entry, exit, or profit targets, being shared strictly for educational and analytical purposes only.
Final Outlook:
Momentum: Strong | Trend: Up | Risk: High (extension and supply proximity) | Volume: High (institutional participation evident)
⚠️ STWP Educational & Legal Disclaimer
This content is shared strictly for educational and informational purposes only. All discussions, illustrations, charts, price zones, and options structures are meant to explain market behaviour and do not constitute any buy, sell, or hold recommendation. STWP does not provide investment advice, trading calls, tips, or personalized financial guidance, and is not a SEBI-registered intermediary or research analyst.
The analysis is based on publicly available market data and observed price–derivatives behaviour, which is dynamic in nature and may change without notice. Financial markets involve inherent risk, and derivatives carry elevated risk, including the potential for significant capital loss. Factors such as option premiums, implied volatility, open interest, delta, and other Greeks can shift rapidly and unpredictably.
All trading and investment decisions, including position sizing and risk management, are solely the responsibility of the reader. Always consult a SEBI-registered investment advisor before taking any financial action. STWP, its associates, or affiliates shall not be liable for any direct or indirect loss arising from the use of this material. Past patterns, structures, or historical behaviour must never be treated as guarantees of future outcomes.
Position Status: No active position in this instrument at the time of analysis
Data Source: TradingView & NSE India
💬 Did this add value?
🔼 Boost to support structured learning
✍️ Share your views or questions in the comments
🔁 Forward to traders who value disciplined analysis
👉 Follow for clean, probability-driven STWP insights
🚀 Stay Calm. Stay Clean. Trade With Patience.
Trade Smart | Learn Zones | Be Self-Reliant 📊
COALINDIA

COALINDIA on weekly breakoutKeep an eye on this Scrip for a weekly breakout above 414-422.
volume increased in each trading day.
keep sl at swing low
TGT - all time high soon.

Coal India – Technical SetupCoal India has been trading in a healthy consolidation range over the last few sessions, indicating absorption of supply and steady accumulation by buyers. The price action suggests that the consolidation phase is now maturing, often a precursor to a directional move.
The stock has managed to hold above its key short-term support zones during this phase, reflecting strength and stability in the structure. With consolidation nearing completion, Coal India appears poised for a potential upside breakout, provided it sustains above the current range.
Momentum indicators are gradually turning positive, supporting the possibility of a fresh bullish leg once buying interest picks up.
Trade Plan:
Buy: ₹390 (After some pullback)
Stop Loss: ₹370
Target: ₹430
A close below ₹370 would invalidate the setup, so strict stop-loss discipline is advised.
Trade with proper risk management.
BUY TODAY SELL TOMORROW for 5%DON’T HAVE TIME TO MANAGE YOUR TRADES?
- Take BTST Option trades at 3:25 pm every day
- Try to exit by taking 4-7% profit of each trade
Resistance Breakout in COAL INDIA
BUY TODAY, SELL TOMORROW for 5%

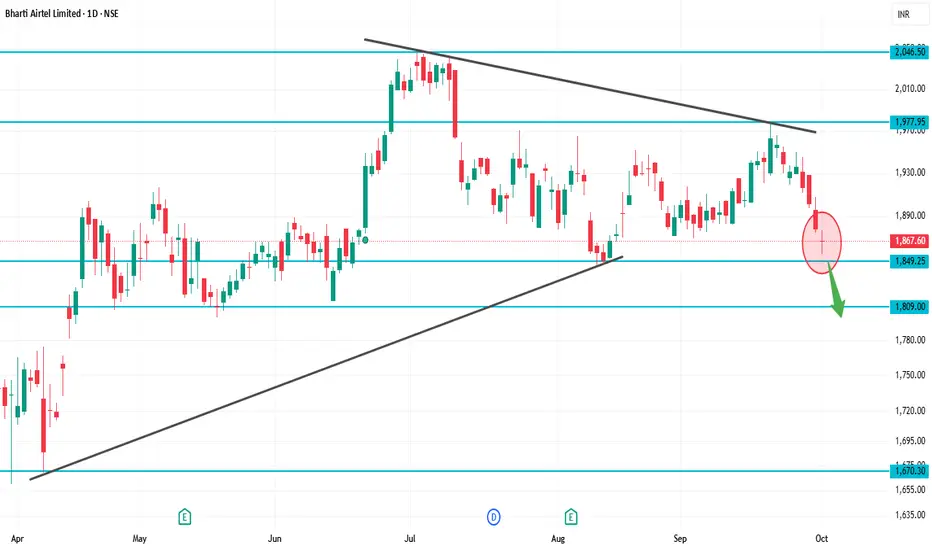
BHARTIARTL 1D Time frameCurrent Price: ~₹1,867
52-Week High: ~₹2,045
52-Week Low: ~₹1,511
Explanation
At ₹1,867, Airtel is just above immediate support (₹1,840–1,850).
If buyers hold this support, stock may bounce back toward ₹1,900+.
But if ₹1,840 breaks, then downside may open toward ₹1,800–1,750.
For bulls, a clean breakout above ₹1,920–2,000 is needed for fresh rally.
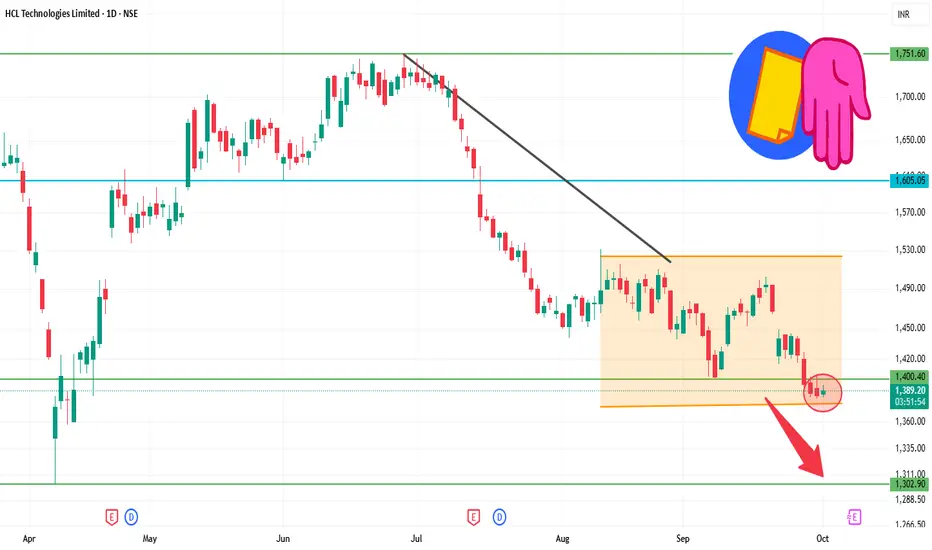
HCLTECH 1D Time frameOpening Price: ₹1,387.40
Closing Price: ₹1,387.40
Day Range: ₹1,383.10 – ₹1,395.00
Previous Close: ₹1,387.40
📉 Trend Analysis
Short-Term Trend: Bearish — The stock is trading below key moving averages, confirming the bearish trend.
Medium-Term Trend: Neutral — The stock is in a consolidation phase, characterized by lower highs and lower lows.
Long-Term Trend: Neutral — No significant trend identified; the stock is trading within a range.
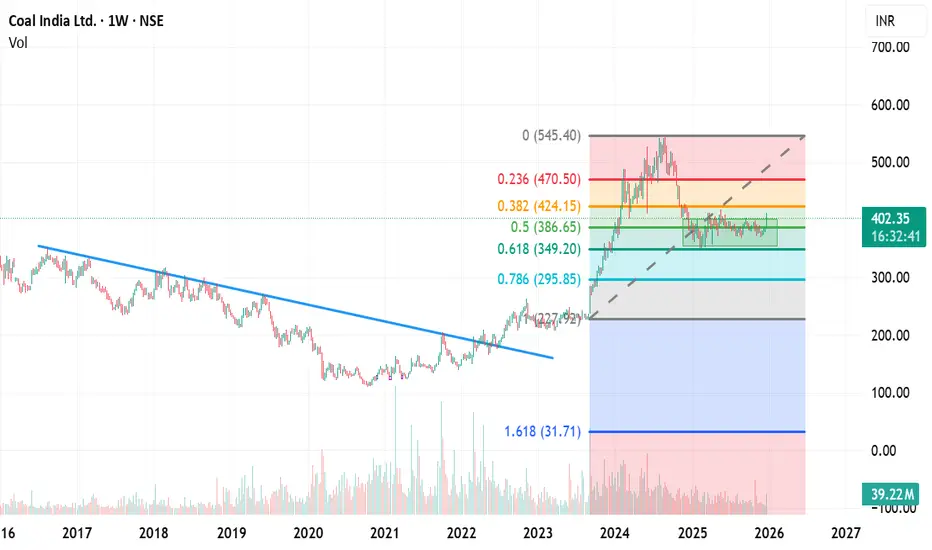
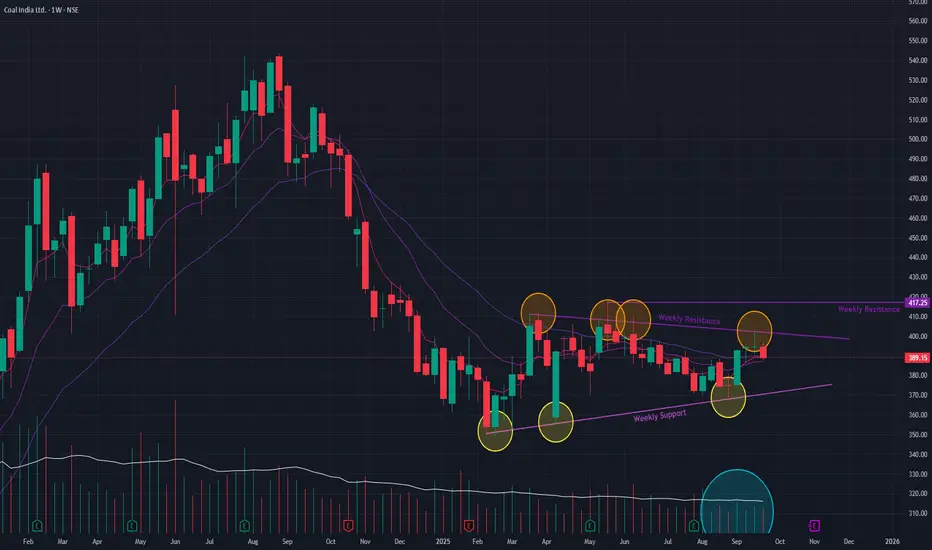
Coal India (W) - Consolidates in a Potential Bear Flag PatternFollowing a significant downtrend that began in August 2024, Coal India has entered a sideways consolidation phase, which has been in place since December 2024. This prolonged period of consolidation after a downtrend is forming what appears to be a Bear Flag , a classic continuation pattern that typically resolves to the downside.
The stock is currently trading within this pattern, approaching a critical juncture.
Bearish Indicators to Note 📉
The negative outlook is supported by key observations:
- Continuation Pattern: The formation of a Bear Flag itself suggests that the pause is likely a prelude to resuming the prior downtrend.
- Declining Volume: Trading volume has been noticeably drying up during this consolidation phase, which often indicates a lack of buying conviction and can precede a breakdown.
Outlook and Key Levels
The price action in the coming weeks will be crucial.
- Bearish Case: A breakdown below the lower trendline of the flag pattern, especially on a spike in volume, would confirm the continuation of the downtrend.
- Bullish Reversal: To invalidate the bearish pattern, the stock must stage a decisive breakout above the upper resistance trendline of the flag, supported by a massive surge in volume. Until such a breakout occurs, the prevailing technical bias remains bearish.
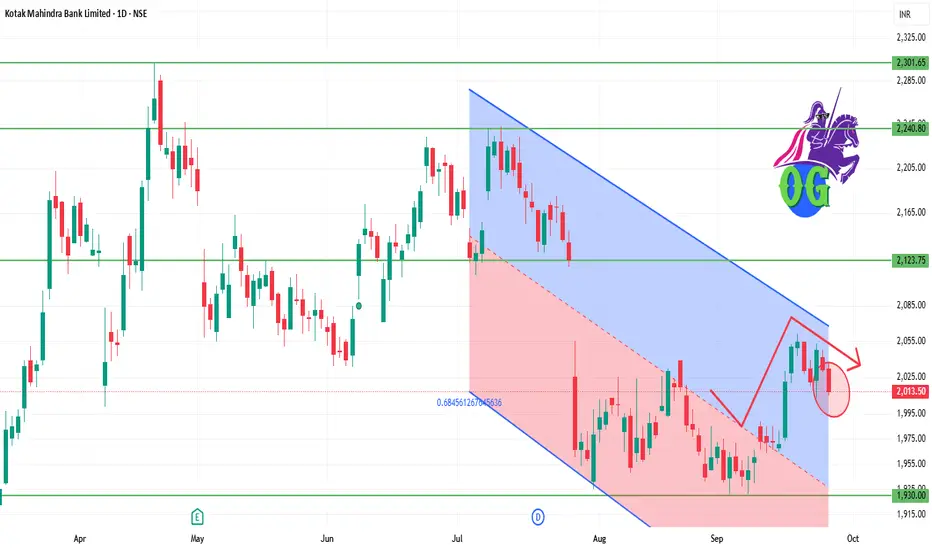
KOTAKBANK 1D Time frame📊 Daily Snapshot
Closing Price: ₹2,013.60
Day’s Range: ₹2,012.50 – ₹2,031.30
Previous Close: ₹2,031.30
Change: Down –0.72%
52-Week Range: ₹1,679.00 – ₹2,302.00
Market Cap: ₹4.04 lakh crore
P/E Ratio: 21.09
Dividend Yield: 0.12%
EPS (TTM): ₹96.30
Beta: 0.80 (indicating lower volatility)
🔑 Key Technical Levels
Immediate Support: ₹2,000.00
Immediate Resistance: ₹2,030.00
All-Time High: ₹2,302.00
📈 Technical Indicators
RSI (14-day): 45.2 – indicating a neutral condition.
MACD: Negative, suggesting bearish momentum.
Moving Averages: Trading below the 50-day and 200-day moving averages, indicating a bearish trend.
📉 Market Sentiment
Recent Performance: Kotak Mahindra Bank's stock declined by 0.72% on September 25, 2025, underperforming the broader market.
Volume: Trading volume was significantly lower than its 50-day average, indicating decreased investor activity.
📈 Strategy (1D Timeframe)
1. Bullish Scenario
Entry: Above ₹2,030.00
Stop-Loss: ₹2,000.00
Target: ₹2,050.00 → ₹2,070.00
2. Bearish Scenario
Entry: Below ₹2,000.00
Stop-Loss: ₹2,030.00
Target: ₹1,980.00 → ₹1,960.00
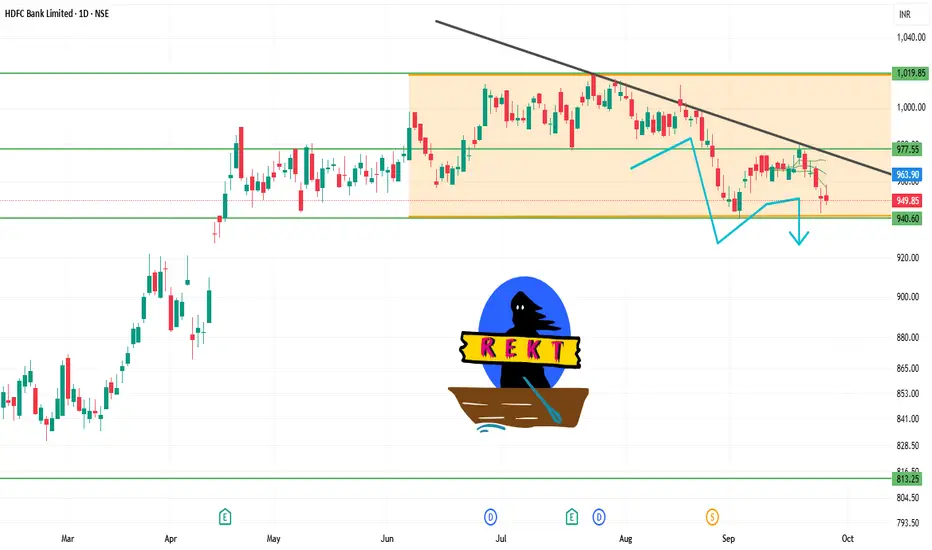
HDFCBANK 1D Time frame📊 Daily Snapshot
Closing Price: ₹949.20
Day’s Range: ₹947.40 – ₹958.00
Previous Close: ₹957.20
Change: Down –0.52%
52-Week Range: ₹806.50 – ₹1,018.85
Market Cap: ₹14.6 lakh crore
P/E Ratio: 20.66
Dividend Yield: 2.32%
EPS (TTM): ₹45.97
Beta: 0.92 (indicating lower volatility)
🔑 Key Technical Levels
Support Zone: ₹947.40 – ₹950.00
Resistance Zone: ₹957.20 – ₹960.00
All-Time High: ₹1,018.85
📈 Strategy (1D Timeframe)
1. Bullish Scenario
Entry: Above ₹957.20
Stop-Loss: ₹947.40
Target: ₹965.00 → ₹970.00
2. Bearish Scenario
Entry: Below ₹947.40
Stop-Loss: ₹957.20
Target: ₹940.00 → ₹935.00
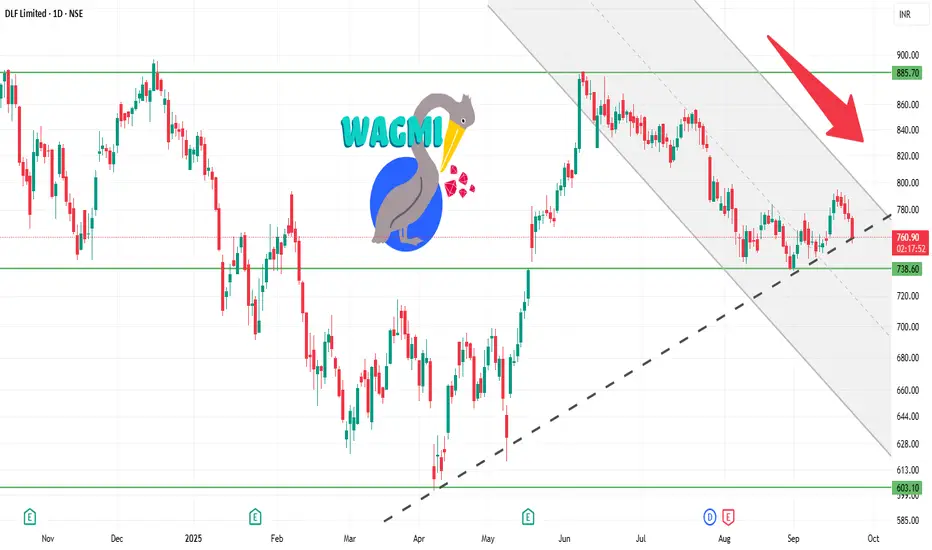
DLF 1D Time frame📍 Today’s Expected Range (Intraday Approximation)
Expected High: ₹767–₹775
Expected Low: ₹756–₹750
These are approximate intraday levels. Actual prices may fluctuate slightly due to market volatility.
🔍 Key Points
Current price: ₹760–₹761, trading near the middle of the day’s range.
If price breaks above ₹767–₹775 with strong volume → bullish momentum likely.
If price falls below ₹756–₹750 → short-term correction or pullback possible.
📊 Suggested Trading Strategy
Bullish Scenario
If DLF breaks ₹767–₹775, you can buy, targeting ₹780–₹785.
Stop-loss: ₹755
Bearish Scenario
If DLF drops below ₹756–₹750, you can sell/short, targeting ₹740–₹735.
Stop-loss: ₹760
Range-Bound / Sideways
If price trades between ₹756–₹767, it’s better to wait and avoid trading until a clear breakout occurs.
💡 Summary
Resistance Zone: ₹767–₹775
Support Zone: ₹750–₹756
Strategy: Trade in the direction of the breakout, and always use stop-loss to manage risk.
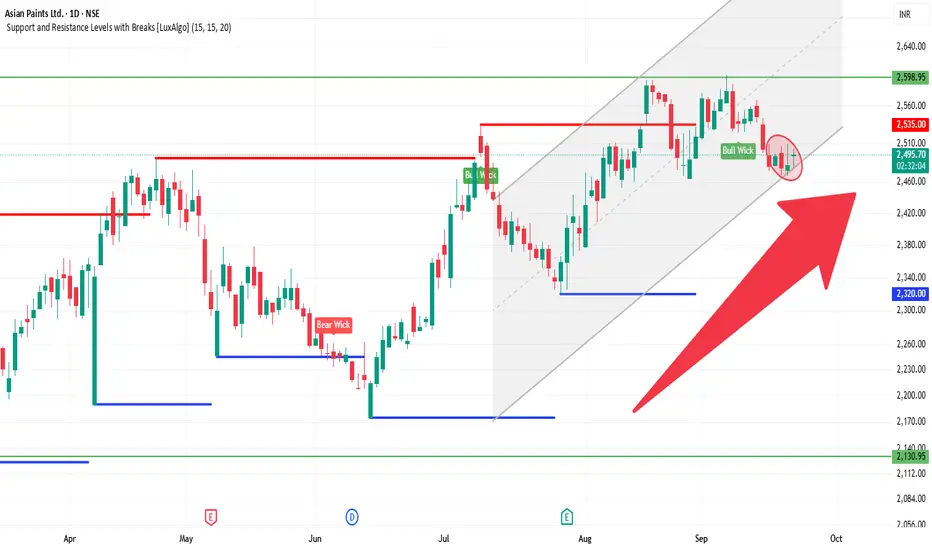
ASIANPAINT 1D Time frame🔍 Current Status
The stock is trading around ₹2,490 – ₹2,500
Recent price action has been somewhat mixed — not a strong trend, some resistance in higher zones.
🧮 Trade Strategy Ideas
Long Setup:
If price holds above ~₹2,460 and shows reversal candlestick or volume strength.
Target resistance around ₹2,505-₹2,528.
Stop-loss could be placed just below ₹2,440 or so (to protect against breakdowns).
Short / Pullback Setup:
If price gets rejected near resistance around ₹2,505-₹2,528 and bearish candlestick forms.
Potential downside toward ~₹2,460 first, then further to ~₹2,420.
Breakout Setup:
If price breaks above ~₹2,528 with good volume, could aim for ~₹2,546 or higher.
Must confirm with strength / follow-through.
✅ Summary: Asian Paints is in a consolidation / neutral phase. Key to watch is how it reacts around the resistance zone ~₹2,505-₹2,528. Holding above support ~₹2,460 is important. A clear breakout gives upside, else downside risk remains.
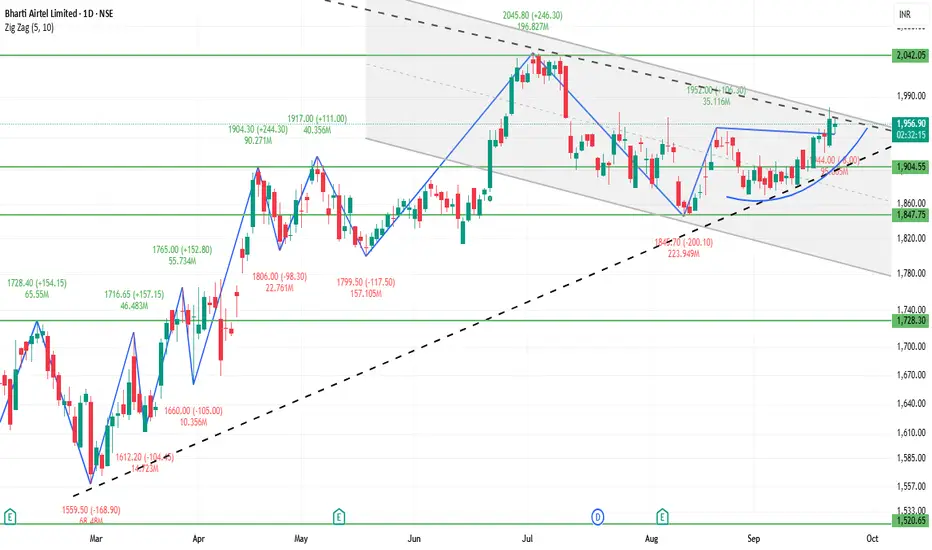
BHARTIARTL 1D Time frame🔍 Current Price & Context
Trading around ₹1,950 – ₹1,960 (approx).
Day’s range recently: low ~ ₹1,944 – ₹1,946, high ~ ₹1,920 – ₹1,925 — showing testing of resistance.
52-week range: low ~ ₹1,510, high ~ ₹2,045.
🧮 Strategy / Trade Ideas
Long Setup:
Entry could be around / just above support zone (₹1,900 – ₹1,895) if there are reversal signals (bullish candles, volume).
Stop loss: slightly below deeper support (~₹1,870 – ₹1,880) to protect against breakdown.
Initial target: resistance around ₹1,920 – ₹1,930. If crossed, then next target near ₹1,950 – ₹1,960.
Short / Pullback Setup:
If price fails to break above resistance (~₹1,920 – ₹1,930) and shows signs of reversal (bearish candle, volume drop).
Target downward to support ~₹1,900, then further to ~₹1,880 – ₹1,870.
Breakout Setup:
If it breaks above ~₹1,950 – ₹1,960 with good volume, then move toward psychological level ~₹2,000 and possibly toward 52-week high (~₹2,045).
✅ Summary
Bharti Airtel in daily chart is showing a mild bullish bias, but the resistance zones (~₹1,920-₹1,930, ₹1,950-₹1,960) are critical. Holding above support around ₹1,900 is important. A clear breakout above resistance could open room for upside; failure to do so may lead to sideways movement or slight downside.
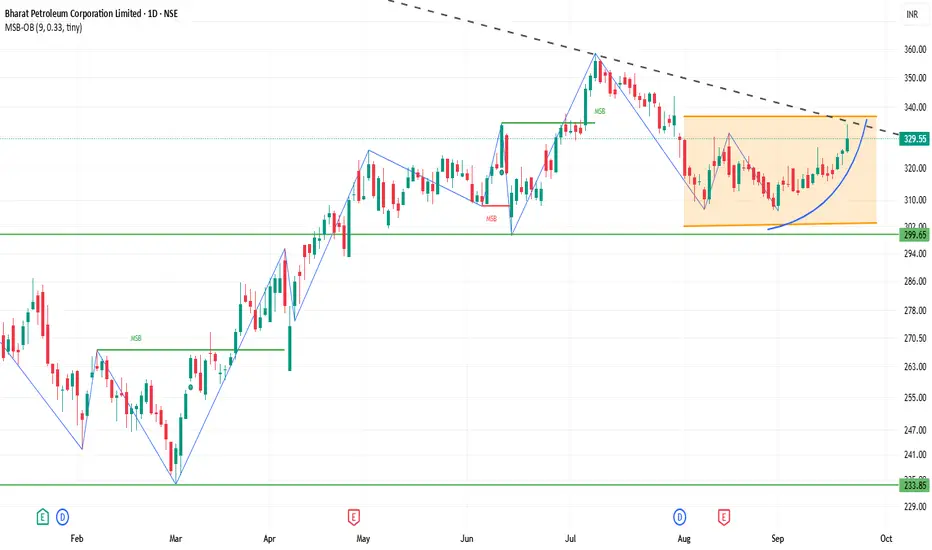
BPCL 1D Time frame📊 Current Snapshot
Closing Price: ₹329.55
Day's Range: ₹324.80 – ₹334.00
52-Week Range: ₹234.01 – ₹376.00
Market Capitalization: ₹1,42,975 Crores
Volume: Approximately 10 million shares traded
P/E Ratio: 8.14
Dividend Yield: 2.99%
⚙️ Technical Indicators
Relative Strength Index (RSI): 60.31 – Neutral to slightly bullish
Moving Average Convergence Divergence (MACD): 0.29 – Neutral
Moving Averages: Short-term averages (5, 10, 20, 50, 100, 200-day) are above the current price, indicating potential resistance.
Pivot Points: Central pivot around ₹322.30, suggesting a balanced market sentiment.
🎯 Possible Scenarios
Bullish Scenario: A breakout above ₹328.25 with strong volume could target ₹331.80 and higher levels.
Bearish Scenario: Failure to hold above ₹325.85 may lead to a decline toward ₹322.30.
⚠️ Key Considerations
Market Sentiment: BPCL has shown strong performance recently, but broader market conditions can impact its movement.
Volume Analysis: Watch for volume spikes to confirm breakout or breakdown signals.
Technical Indicators: While the RSI indicates a neutral to slightly bullish stance, the MACD and moving averages suggest caution.
KOTAKBANK 1D Time frame📊 Current Snapshot
Current Price ≈ ₹2,031
Change: ~ -1.15% on latest trading day
Price is above both 50-day and 200-day simple moving averages, which indicates the medium & longer-term trend is still upwards.
Volume is moderate.
🔍 Indicators / Momentum
RSI (14-day): Mid-range, somewhat bullish (but not overbought).
MFI (Money Flow Index): Also mid-range.
Trend Strength Indicators: Mixed. Some moving averages suggest support (price above), while other oscillators show some weakness or potential for sideways drift.
🔒 Support & Resistance Levels
Type Level (Approx)
Key Support ~ ₹2,010 – ₹2,020
Stronger Support if breaks down ~ ₹1,990 – ₹2,000
Immediate Resistance ~ ₹2,050 – ₹2,060
Higher Resistance ~ ₹2,075 – ₹2,080
⚠️ What to Watch For / Risks
The recent dip suggests sellers are exerting pressure near resistance zones.
If momentum weakens, price could fall toward the support band around ₹2,010‐₹2,020.
Any break below ₹2,000 may trigger more bearish sentiment.
🎯 Possible Scenarios
Bullish Case: If price can hold above current support and break above resistance (~ ₹2,050+), it could aim for ₹2,075-₹2,100.
Bearish Case: Rejection at resistance could pull it back toward ₹2,010 or lower. Further weakness might push it toward ~₹1,950-₹2,000 if broader market is weak.

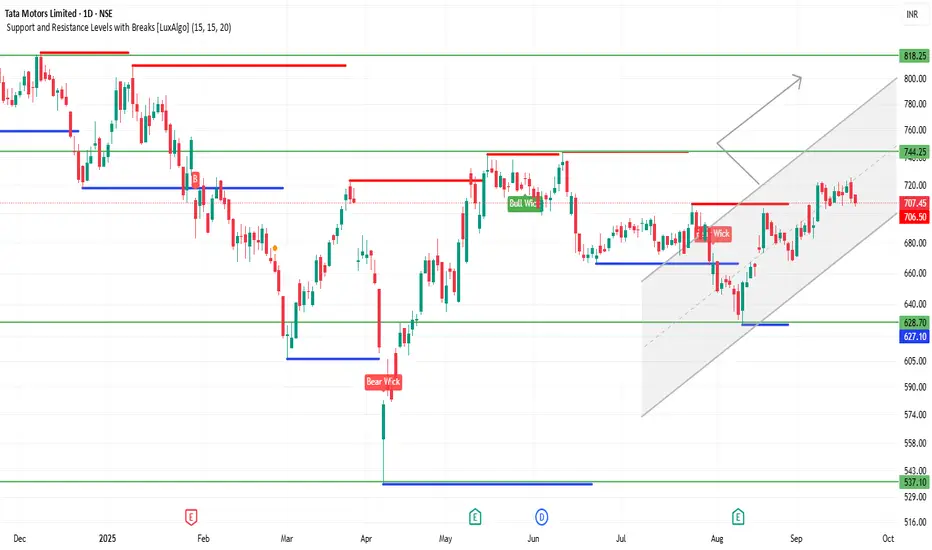
TATAMOTORS 1D Time frameCurrent Price: 707
Current Trend: Strong bullish momentum; stock is trading near recent highs.
Support Zone: Immediate support at 695 – 700. If this holds, uptrend remains intact.
Resistance Zone: Next resistance at 720 – 730. A breakout above this can push toward 750+.
Indicators: Daily candles are bullish, showing higher highs and strong buying interest.
Outlook:
Above 720 → continuation of bullish rally likely.
Below 695 → minor correction possible toward 680–685.
👉 In short (with 707 current price):
Bullish tone.
Range to watch: 695 – 730.
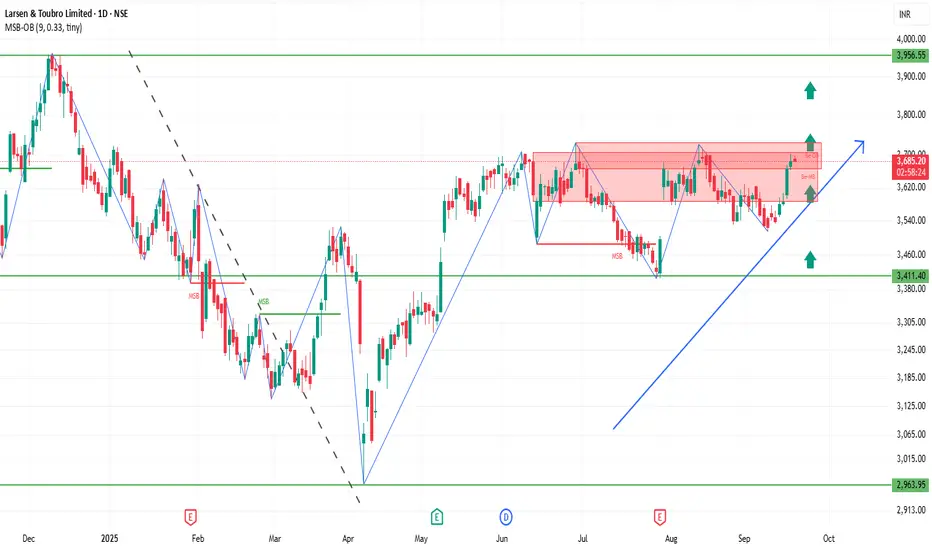
LT 1D Time frameCurrent Snapshot
Price: ₹3,695 (slightly higher than yesterday’s level).
Stock is holding near resistance but still above strong supports.
Trend is bullish to sideways.
📌 Key Levels
Immediate Resistance: ₹3,740 – ₹3,800.
Immediate Support: ₹3,650 – ₹3,670.
Stronger Support: ₹3,600, and deeper support near ₹3,100 on longer timeframe.
✅ Outlook
If LT sustains above ₹3,670, bulls remain strong and a breakout above ₹3,740 could push toward ₹3,800+.
If it falls below ₹3,650, then short-term weakness may test ₹3,600.
As long as it stays above ₹3,600, the larger trend remains intact.
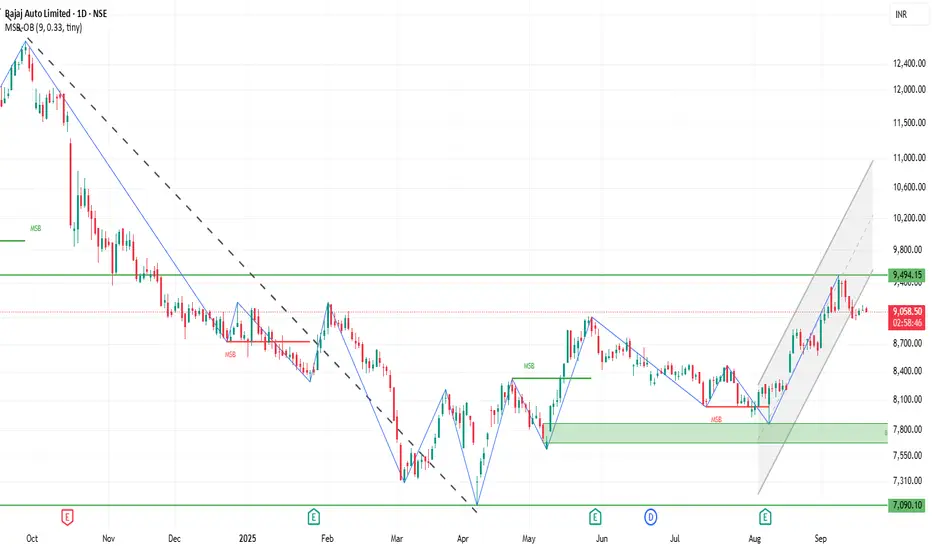
BAJAJ_AUTO 1D Time frameCurrent Snapshot
Price is trading around ₹9,080 – ₹9,100.
Stock is moving above both 50-day and 200-day moving averages, showing a steady uptrend.
It is still below its all-time high, so recovery space remains.
⚙️ Indicators / Momentum
RSI: Neutral, neither overbought nor oversold.
MFI (Money Flow Index): Balanced, showing moderate buying pressure.
Momentum: Stable with a slightly bullish bias.
📌 Key Levels
Immediate Resistance: ₹9,300 – ₹9,400.
Immediate Support: ₹8,800 – ₹9,000.
Stronger Support: Near ₹7,500 on longer-term charts.
✅ Outlook
Trend remains mildly bullish as long as price stays above ₹9,000.
Break above ₹9,400 could push price toward new highs.
Fall below ₹8,800 may lead to deeper correction.
SENSEX 1D Time frameCurrent Status
Sensex Level: 82,623
Change: +594.95 points (+0.73%)
Opening: 81,852
Day’s Range: 81,780 – 82,443
52-Week Range: 71,425 – 85,978
📈 Market Sentiment
Trend: Mildly bullish
Leading Sectors: Auto, Realty, Telecom
Investor Mood: Optimistic, but watching global cues
🔍 Key Levels to Watch
Immediate Support: 81,800 – 81,850
Resistance Zone: 82,400 – 82,500
Psychological Milestone: Breaking above 82,500 may push higher
🧭 Outlook
Sensex is showing positive momentum supported by strong sectors.
Bulls are slightly stronger, but resistance near 82,400–82,500 may cap upside.
A drop below 81,800 could bring downside pressure toward 81,500–81,400.

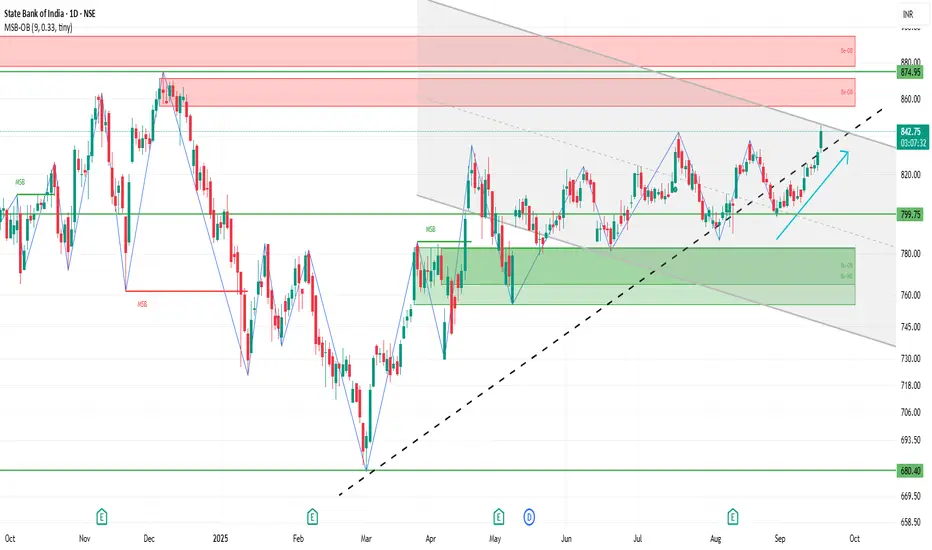
SBIN 1D Time frameCurrent Stock Price
Current Price: ₹842.25
Day’s Range: ₹831.00 – ₹845.80
52-Week Range: ₹680.00 – ₹875.45
Market Cap: ₹7.68 lakh crore
P/E Ratio: 9.77
EPS (TTM): ₹86.06
Dividend Yield: 1.91%
Book Value: ₹527.66
📈 Trend & Outlook
Short-Term Trend: Bullish; trading above key support levels and showing positive momentum.
Resistance Levels: ₹845.80 (day’s high), ₹875.45 (52-week high)
Support Levels: ₹831.00 (day’s low), ₹818.32 (weekly pivot)
Investor Sentiment: Positive, with institutional interest and favorable outlook.
🧭 Key Notes
Immediate support around ₹831–₹818; if it holds, price may rise toward resistance.
If it drops below ₹818, downside may extend toward ₹800 or lower.
Overall, bulls are slightly stronger, but watch resistance near ₹845–₹875.
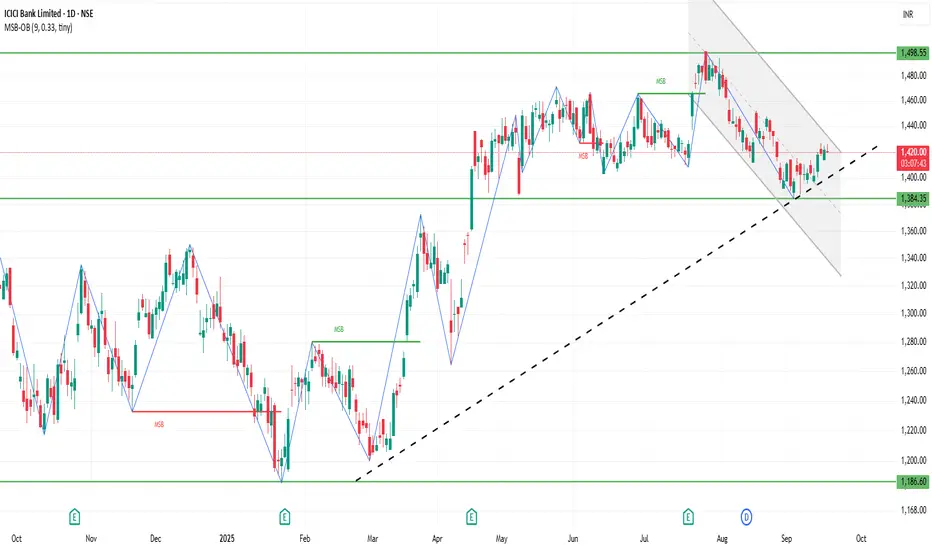
ICICIBANK 1D Time frameCurrent Stock Price
Current Price: ₹1,421.60
Day’s Range: ₹1,420.00 – ₹1,426.10
52-Week Range: ₹1,186.00 – ₹1,500.00
Market Cap: ₹10.17 lakh crore
P/E Ratio (TTM): 18.01
EPS (TTM): ₹74.05
Dividend Yield: 0.77%
Book Value: ₹436.67
📈 Trend & Outlook
Short-Term Trend: Bullish; the stock is trading near its 52-week high, indicating strong investor confidence.
Resistance Levels: ₹1,426.10 (day’s high), ₹1,500.00 (52-week high).
Support Levels: ₹1,420.00 (day’s low), ₹1,400.00 (psychological support).
Investor Sentiment: Positive, with strong institutional interest and favorable analyst outlooks.
🧭 Analyst Insights
Valuation: The stock is trading at a P/E ratio of 18.01, which is slightly below the sector average of 19.82, suggesting potential value.
Growth Prospects: The bank's strong earnings growth and robust capital position support its premium valuation.
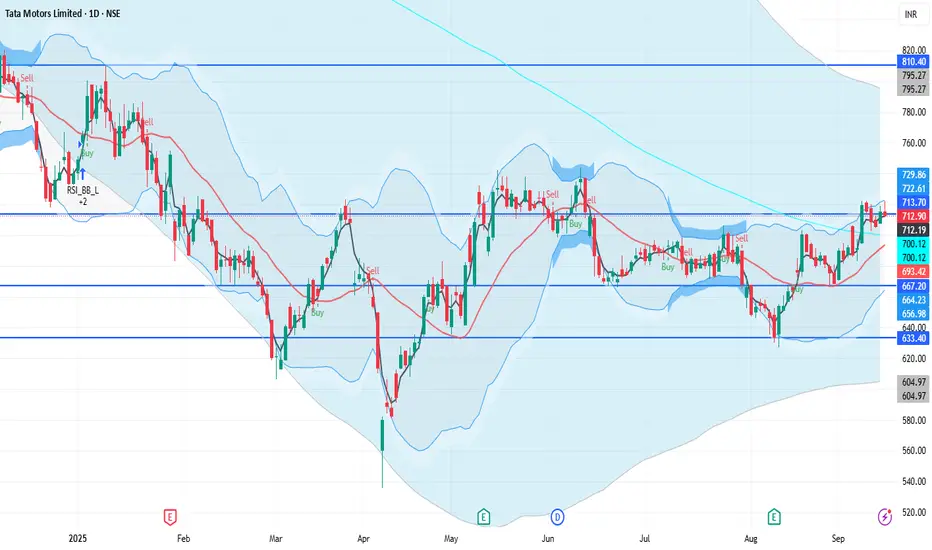
TATAMOTORS 1D Time frameUpdated Snapshot
Current Price: ₹712 – ₹715
Day’s Range: ₹712 – ₹721.95
Previous Close: ₹705.85
🔹 Support & Resistance
Support 1: ₹710 – ₹708
Support 2: ₹700 – ₹705
Resistance 1: ₹721 – ₹725
Resistance 2: ₹735 – ₹740
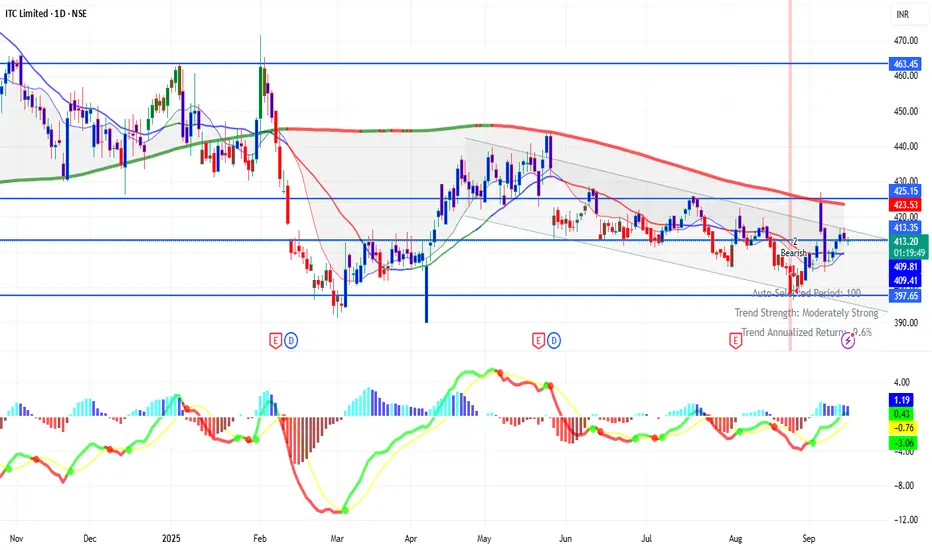
ITC 1D Time framePrice Action
Current Price: ₹413.75 (approx)
Day’s Range: ₹413.05 – ₹414.30
52-Week Range: ₹390.15 – ₹528.50
🔹 Support & Resistance
Immediate Support: ₹410 – ₹408
Next Support: ₹402 – ₹397
Immediate Resistance: ₹416 – ₹420
Next Resistance: ₹422 – ₹428
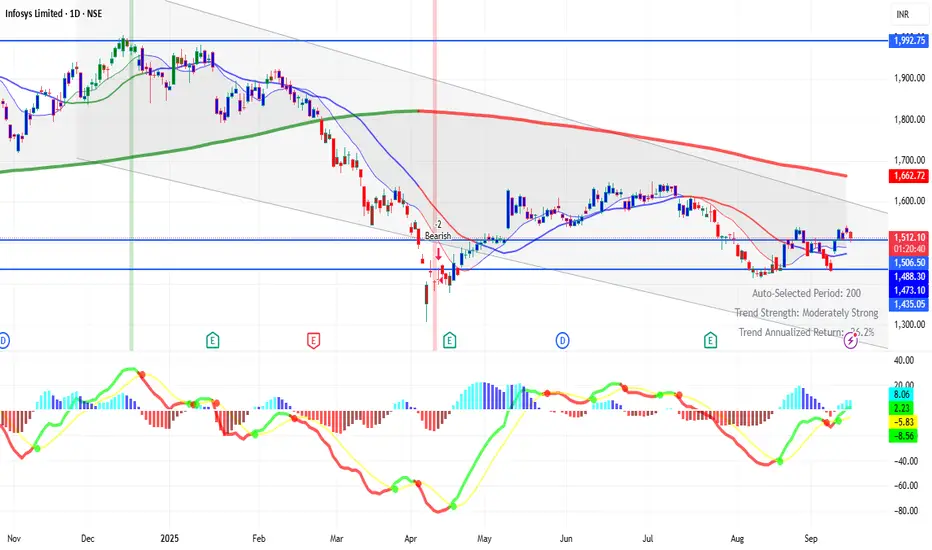
INFY 1D Time frameCurrent Price: ₹1507 (approx)
Day’s Range: ₹1507 – ₹1543
Previous Close: ₹1509.10
🔹 Support & Resistance
Support 1: ₹1500
Support 2: ₹1490 – ₹1470
Resistance 1: ₹1539 – ₹1552
Resistance 2: ₹1560 – ₹1570