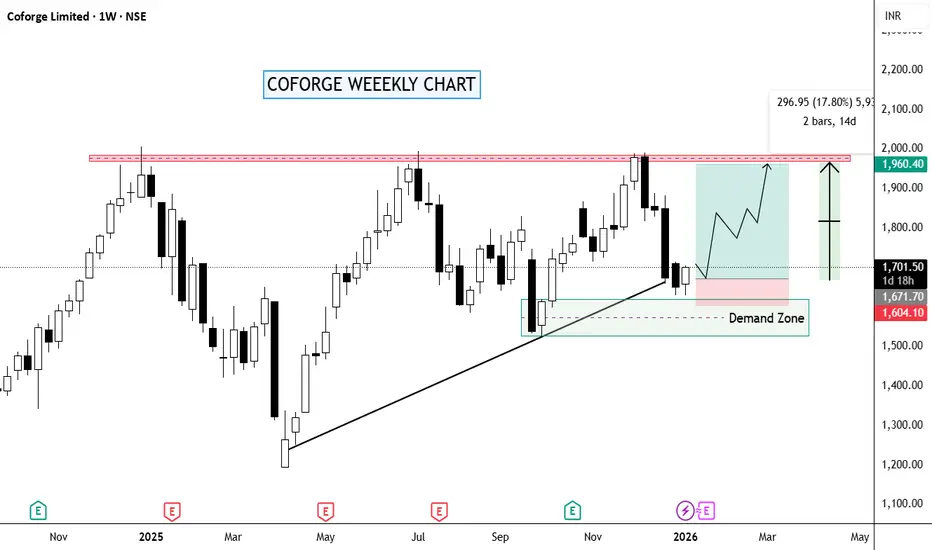
COFORGE – Weekly Chart | Clean Technical ViewNSE:COFORGE
🔹 Trendline + 50 EMA Support:
Price has pulled back into a rising weekly trendline, and the 50 EMA is sitting right there. This confluence is the key zone.
🔹 Price Action:
Rejection from 1950–2000 came with a controlled pullback, not panic selling. That tells me distribution isn’t aggressive yet.
🟢 Buy Zone (Support-based): 1680 – 1700
NIFTYIT Sector About to go for a Breakout attempt
🔹 Bias:
Above trendline + 50 EMA → bullish bias intact
Weekly close above 1750–1780 → scope to retest 1900–2000
Weekly close below demand → bullish view invalid
Keep Learning,
Happy Trading.
COFORGE
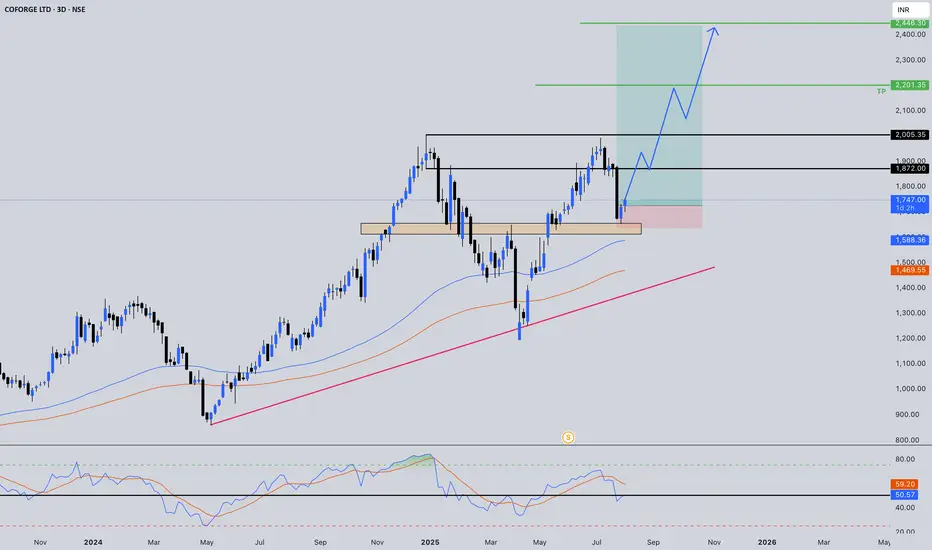
Coforge (D): Strongly Bullish, Triple Top BreakoutTimeframe: Daily | Scale: Linear
The stock has confirmed a major breakout from a 6-month consolidation structure. By closing above the triple-test resistance zone, the "bearish" triple top pattern has been invalidated and converted into a bullish breakout .
📈 1. The Long-Term Structure (The Reversal)
> The Cycle:
- Peak: ATH of ~2,005 in Dec 2024.
- Correction: A downward spiral until April 2025 .
- Turnaround: Since April, the stock has shifted structure to Higher Lows , indicating buyers are stepping in aggressively on dips.
> The "Lid" (Resistance Zone): The 1,951 – 1,959 zone acted as a stiff resistance, rejecting the price three times (ATH, July 2025, and recently). This made it a "Triple Top" barrier.
💥2. The Breakout (Today's Action)
> Pattern Shift: Today, the stock finally **closed above** this resistance zone (1,951–1,959).
- Technical Significance: A close above a Triple Top resistance negates the bearish reversal and triggers a powerful continuation breakout .
> Volume Confirmation: The surge of 2.81% was backed by 3.12 Million in volume. This expansion (after a period of decreasing volume) confirms that "smart money" pushed the price through the wall.
📊 3. Technical Indicators
> RSI: Rising in Monthly, Weekly, and Daily timeframes.
- Caution: Watch for Bearish Divergence (Price making a higher high while RSI makes a lower high) as the stock approaches its ATH.
> EMAs: The PCO (Positive Crossover) state across all timeframes confirms the trend is synchronized to the upside.
🎯 4. Future Scenarios & Key Levels
With the "lid" at 1,960 removed, the path is open to retest the highs.
> 🐂 Bullish Targets:
- Target 1: 2,005 (The ATH). This is the immediate magnet.
- Target 2: Blue Sky . A sustained close above 2,005 puts the stock in price discovery mode.
> 🛡️ Support & Re-test:
- The "Safe" Entry: Waiting for a re-test of the 1,951–1,959 level is the prudent strategy. If the stock pulls back and bounces from here, it confirms the breakout.
- Stop Loss: If the stock falls back below 1,920 , it would signal a "fakeout" and likely trap the new buyers.
Conclusion
The breakout is valid. The "Triple Top" is no longer a threat; it is now a launchpad. Watch for the stock to hold above 1,951 to confirm the move toward 2,005 .

COFORGE - Bullish Breakout Swing Trade Setup💹 Coforge Ltd (NSE: COFORGE)
Sector: IT Services & Consulting | CMP: 1910.20 | View: Bullish Breakout Swing Trade Setup
The COFORGE price structure has begun to reveal a controlled, conviction-based transition from consolidation to momentum. The latest bullish candle wasn’t just a breakout attempt — it carried strength, intent, and participation. Price pushed cleanly through short-term supply while maintaining the higher-low rhythm that has been forming over the past few weeks, indicating a well-built base rather than a reactive spike. Momentum indicators aligned with the price story. RSI broke above its resistance zone, shifting from neutrality into strength — a classic early phase of trend expansion. The Bollinger Bands opened up as the BB Squeeze turned off, confirming that volatility has started releasing in the direction of the breakout. This is typically the moment where institutions begin showing their hand. Volume behaviour strengthened the narrative. The surge wasn’t erratic; it was measured, steady, and consistent with accumulation rather than exhaustion. Buyers absorbed supply efficiently, allowing price to move with stability instead of urgency. This is the type of volume signature that precedes a clean swing leg. Supporting metrics in the broader structure pointed toward balance with a bullish tilt. Market strength indicators showed improving buyer control, the candle body carried dominance, and the range behaviour leaned towards continuation rather than rejection. No distortions, no volatility shocks — just a disciplined transition into momentum.
Taken together, COFORGE presents a well-structured environment:
– Strong candle dominance
– Expanding volatility in the direction of strength
– RSI and BB signals aligning
– Controlled volume confirmation
– A swing-friendly setup with a developing trend backbone
Illustrative Swing Trade Example –
Entry Price: 1910.20
Stop Loss: 1880(On Daily Closing Basis)
View: Short-term swing trade based on bullish breakout
⚠️ Disclaimer
This document is strictly for educational and informational purposes. All examples, charts, levels, and option structures discussed are illustrative and are not intended as buy, sell, or hold recommendations. STWP does not provide investment advice, trading tips, signals, or personalized financial guidance of any kind, nor is it a SEBI-registered intermediary or research analyst.
The analyses, illustrations, and risk–reward structures included here are generic in nature and based on publicly available data and observed market behaviour, which may change without notice. Financial markets involve significant risk; derivatives in particular carry the potential for substantial losses. Option premiums, implied volatility, open interest, delta, and other market variables can fluctuate rapidly and unpredictably. Readers are solely responsible for their trading decisions, capital management, and risk assessment. Before making any investment or trading decision, please consult a SEBI-registered investment advisor. STWP, its representatives, and affiliates shall not be liable for any direct or indirect loss arising from the use of this material. Historical patterns or past market behaviour do not guarantee future outcomes. Nothing in this document should be interpreted as a promise of performance, accuracy, or returns.
Position Status: No active position in COFORGE at the time of analysis.
Data Source: TradingView & NSE India .
💬 Found this useful?
🔼 Boost this post to support structured learning
✍️ Drop your thoughts or questions in the comments
🔁 Share with traders who benefit from clean technical studies
👉 Follow for disciplined, structured, STWP-style analysis.
🚀 Stay Calm. Stay Clean. Trade With Patience.
Trade Smart | Learn Zones | Be Self-Reliant 📊

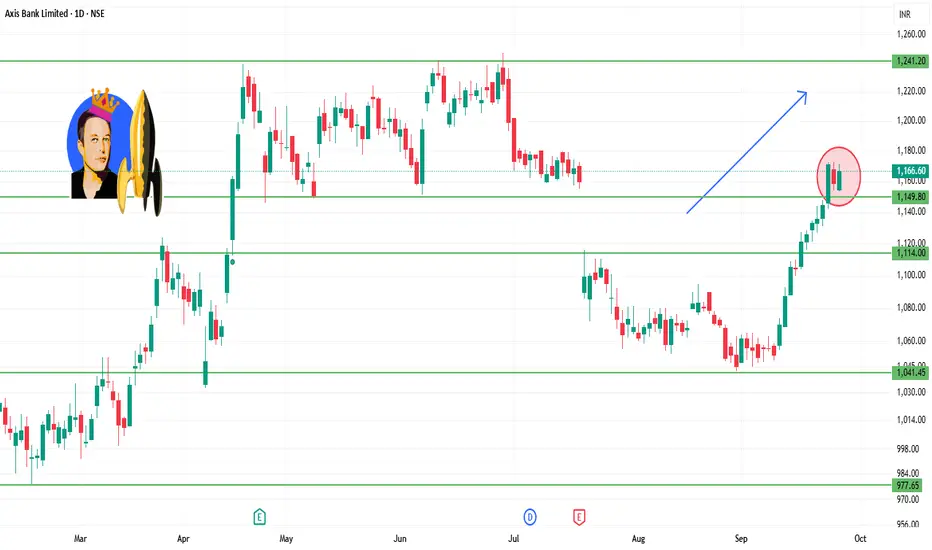
AXISBANK 1D Time frame📊 Daily Snapshot
Closing Price: ₹1,166.10
Day’s Range: ₹1,153.40 – ₹1,171.80
Previous Close: ₹1,158.80
Change: Up +0.28%
52-Week Range: ₹933.50 – ₹1,281.65
Market Cap: ₹3.59 lakh crore
P/E Ratio: 12.9
Dividend Yield: 1.2%
EPS (TTM): ₹90.00
Beta: 1.1 (moderate volatility)
🔑 Key Technical Levels
Immediate Support: ₹1,153.33
Immediate Resistance: ₹1,153.33
Weekly Outlook: Immediate support at ₹1,109.23; major support at ₹1,082.57; immediate resistance at ₹1,153.33; major resistance at ₹1,170.77.
📈 Analyst Insights
Intrinsic Value: Estimated at ₹1,511.77 based on median valuation models, suggesting the stock is trading below its fair value.
📈 Strategy (1D Timeframe)
1. Bullish Scenario
Entry: Above ₹1,153.33
Stop-Loss: ₹1,109.23
Target: ₹1,170.77 → ₹1,200.00
2. Bearish Scenario
Entry: Below ₹1,109.23
Stop-Loss: ₹1,153.33
Target: ₹1,082.57 → ₹1,050.00
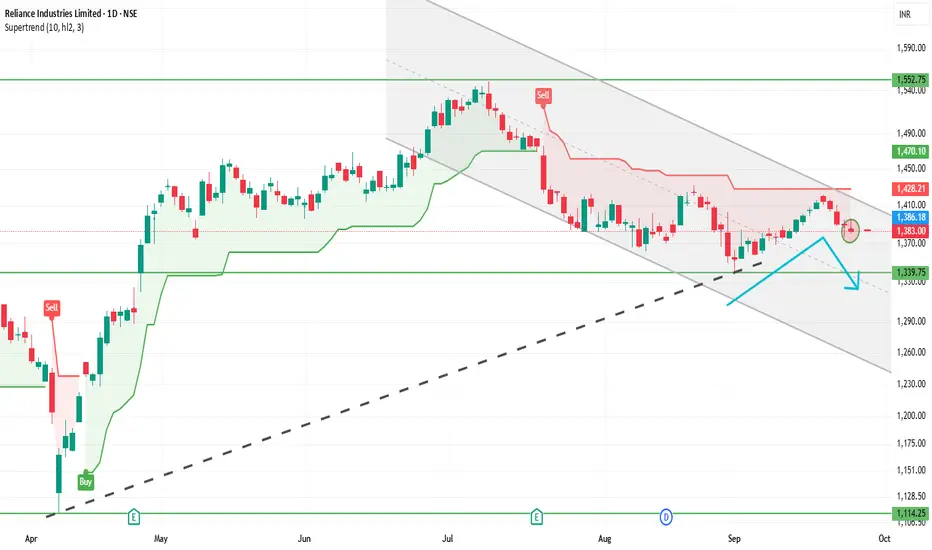
RELIANCE 1D Time frame📊 Reliance Daily (1D) Snapshot
Close: Around ₹1,382
Range of the Day: High near ₹1,396, Low near ₹1,380
Trend: Slight weakness on daily chart (mild red candle)
Stock is consolidating between support and resistance zones.
🎯 Key Daily Levels
Support Zone: ₹1,350 – ₹1,365
Strong Support: ₹1,330
Resistance Zone: ₹1,405 – ₹1,425
Strong Resistance: ₹1,430
📝 Strategy on 1D Chart
Bearish View
If price goes near ₹1,405 – ₹1,425 and fails to sustain, you can short.
Entry: ₹1,410 approx
Stop-loss: ₹1,430
Target: ₹1,365 → ₹1,350
Bullish View
If Reliance holds above ₹1,350 and shows reversal, you can buy.
Entry: ₹1,360 – ₹1,365 zone
Stop-loss: ₹1,330
Target: ₹1,405 → ₹1,425
Breakout Trade
If it closes above ₹1,430 with strong candle, expect momentum upside.
Target: ₹1,460+
Breakdown Trade
If it closes below ₹1,330, selling pressure can push it to ₹1,300 or lower.
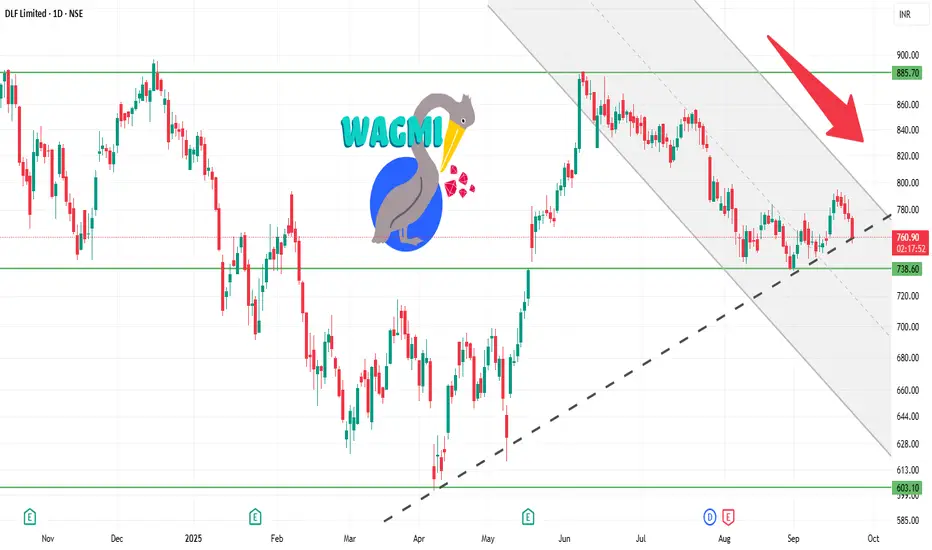
DLF 1D Time frame📍 Today’s Expected Range (Intraday Approximation)
Expected High: ₹767–₹775
Expected Low: ₹756–₹750
These are approximate intraday levels. Actual prices may fluctuate slightly due to market volatility.
🔍 Key Points
Current price: ₹760–₹761, trading near the middle of the day’s range.
If price breaks above ₹767–₹775 with strong volume → bullish momentum likely.
If price falls below ₹756–₹750 → short-term correction or pullback possible.
📊 Suggested Trading Strategy
Bullish Scenario
If DLF breaks ₹767–₹775, you can buy, targeting ₹780–₹785.
Stop-loss: ₹755
Bearish Scenario
If DLF drops below ₹756–₹750, you can sell/short, targeting ₹740–₹735.
Stop-loss: ₹760
Range-Bound / Sideways
If price trades between ₹756–₹767, it’s better to wait and avoid trading until a clear breakout occurs.
💡 Summary
Resistance Zone: ₹767–₹775
Support Zone: ₹750–₹756
Strategy: Trade in the direction of the breakout, and always use stop-loss to manage risk.
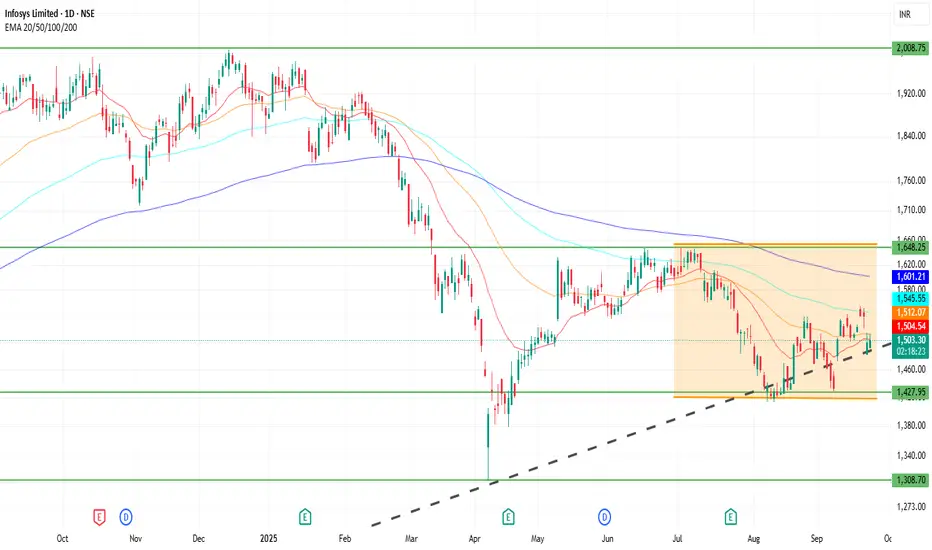
INFY 1D Time frame📍 Current Price & Range
Current Price: ₹1,503.00
Day’s High / Low: ₹1,540.20 / ₹1,499.50
52-week High / Low: ₹2,006.45 / ₹1,307.00
🔍 Key Levels
Immediate Resistance: ₹1,540–₹1,550
Next Resistance: ₹1,600
Immediate Support: ₹1,450–₹1,460
Strong Support: ₹1,400
📊 Indicators & Momentum
Short-term Trend: Neutral to slightly bearish; recent price action shows hesitation near resistance levels.
Volume: Higher-than-average trading volume observed, indicating increased investor interest.
Relative Strength Index (RSI): Approaching overbought territory; caution advised for potential pullbacks.
Moving Averages: Price trading below key moving averages; may act as resistance if price approaches them.
🔮 Possible Scenarios
Bullish Breakout: If INFY sustains above ₹1,550 with strong volume, it could target ₹1,600 and higher levels.
Sideways Consolidation: Price may trade between ₹1,450 and ₹1,550, awaiting a catalyst for direction.
Bearish Reversal: A drop below ₹1,450 could lead to a retest of the 52-week low around ₹1,307.
⚠️ Outlook
At the current level of ₹1,503.00, Infosys is at a critical juncture. A decisive move above ₹1,550 could open up upside potential, while a failure to hold above ₹1,450 may lead to further downside. Monitoring volume and RSI for confirmation is recommended.
KOTAKBANK 1D Time frame🔍 Current Price & Context
Current Price: ₹2,034.10
Day’s Range: ₹2,027.40 – ₹2,054.60
52-Week Range: ₹1,679.05 – ₹2,301.90
Previous Close: ₹2,031.00
Market Cap: ₹4,04,634 Cr
P/E Ratio: 21.10
Dividend Yield: 0.12%
Beta: 0.97
📊 Technical Indicators
Relative Strength Index (RSI): Approximately 49.64, indicating a neutral stance.
MACD: Positive, suggesting bullish momentum.
Moving Averages:
5-Day: ₹2,032.84
50-Day: ₹2,012.95
200-Day: ₹1,984.69
Pivot Points:
S1: ₹2,029.97
Pivot: ₹2,036.07
R1: ₹2,042.17
🧮 Strategy / Trade Ideas
Long Setup:
Entry: Consider entering near support levels (~₹2,020) if bullish reversal signals appear.
Stop Loss: Place below ₹1,980 to manage risk.
Target: First resistance around ₹2,042, then ₹2,070.
Short Setup:
Entry: If price fails to break above resistance (~₹2,042) and shows signs of reversal.
Stop Loss: Above ₹2,080.
Target: Downside toward ₹2,020, then ₹1,990.

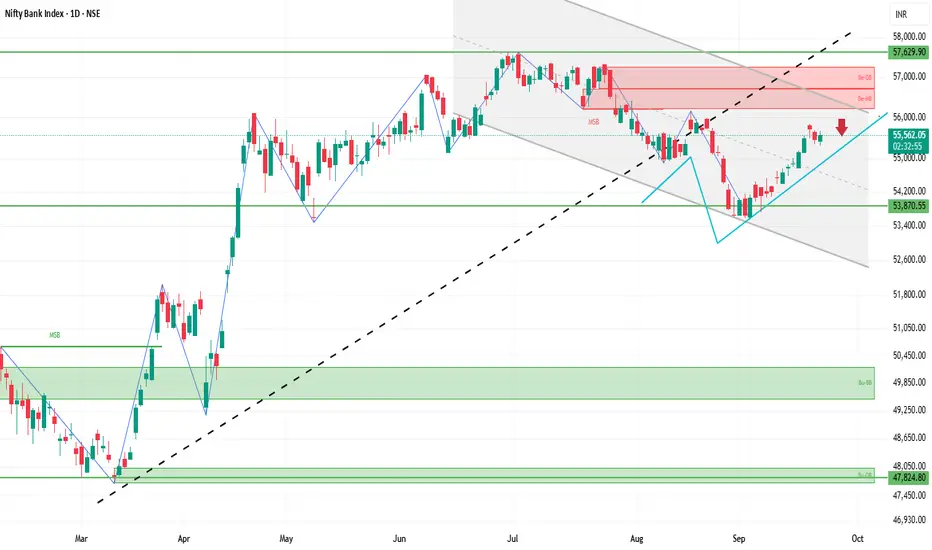
BANKNIFTY 1D Time frame🔍 Current Market Snapshot
Current Level: ₹55,541.30
Day’s Range: ₹55,315.55 – ₹55,666.35
52-Week Range: ₹47,702.90 – ₹57,628.40
Previous Close: ₹55,458.85
Market Sentiment: Neutral to mildly bearish
📊 Technical Indicators
Moving Averages: The BANKNIFTY index is trading slightly below its short-term moving averages, indicating potential resistance.
RSI (14): Approximately 50, suggesting a neutral stance with no clear overbought or oversold conditions.
MACD: Neutral, with the MACD line and signal line close together, indicating indecision in market momentum.
Stochastic Oscillator: Neutral, fluctuating around the midline, reflecting a lack of strong directional movement.
🧮 Strategy / Trade Ideas
Long Setup:
Entry: Consider entering near support levels (~₹55,300) if bullish reversal signals appear.
Stop Loss: Place below ₹54,800 to manage risk.
Target: First resistance around ₹55,800, then ₹56,200.
Short Setup:
Entry: If price fails to break above resistance (~₹55,800) and shows signs of reversal.
Stop Loss: Above ₹56,300.
Target: Downside toward ₹55,300, then ₹54,800.
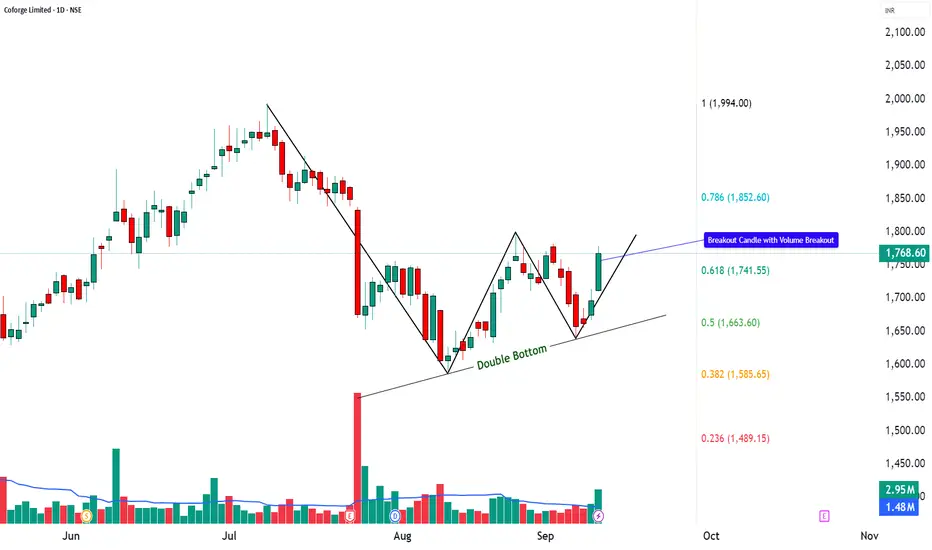
Coforge | Double Bottom Reversal with RSI + MACD Breakout📌 Coforge Ltd. – Closing Price: ₹1,768.60
📊 Technical Indicators Explained
Coforge is showing strong technical signals. A Double Bottom pattern 📉➡️📈 suggests a possible bullish reversal, while a strong bullish candle 🔥 confirms momentum. The RSI breakout ⚡, MACD crossover 📊, and volume surge 🚀 all indicate growing trader participation. With supports holding firm and resistances nearby, the stock is entering a decisive zone.
________________________________________
📈 Bullish Case – Why the stock could go up
Double Bottom signals potential trend reversal.
Strong bullish candle with volume validates buying interest.
RSI breakout + MACD crossover = bullish confirmation.
Fibonacci retracement levels open upside zones towards ₹1,852 – ₹1,994+.
📉 Bearish Case – Potential downside risks
If price fails to sustain above ₹1,726, weakness may return.
Broader market corrections could weigh on momentum.
A breakdown below ₹1,657 would weaken the bullish outlook.
⚡ Momentum Case – Short-term Trading Edge
Strong bullish candle + RSI breakout = near-term strength.
Sustaining above ₹1,780–₹1,800 could push towards higher Fibonacci levels.
Heavy volume indicates short-term traders are active.
📊 Support & Resistance Levels
Support Zones: ₹1,657 | ₹1,683.67 | ₹1,726.13
Resistance Zones: ₹1,794.93 | ₹1,821.27 | ₹1,863.73
📅 Short-term vs. Long-term Perspective
Short-term: Stock may test resistance levels between ₹1,795 – ₹1,860 if momentum sustains.
Long-term: Formation of a double bottom indicates potential for a structural trend reversal if higher levels hold.
✅ Conclusion: Coforge is showing a technical reversal pattern with strong momentum signals.
👉 The stock is at a key breakout zone — short-term traders may track resistances closely, while long-term investors can monitor the double bottom for confirmation of sustained trend change.
⚠️ Disclaimer – Please Read Carefully
The information shared here is meant purely for learning and awareness. It is not a buy or sell recommendation and should not be taken as investment advice. I am not a SEBI-registered investment advisor, and all views expressed are based on personal study, chart patterns, and publicly available market data.
Trading — whether in stocks or options — carries risk. Markets can move unexpectedly, and losses can sometimes exceed the money you have invested. Past performance or past setups do not guarantee future results.
If you are a beginner, treat this as a guide to understand how the market works — practice on paper trades before risking real money. If you are experienced, always assess your own risk, position sizing, and strategy suitability before entering trades.
Consult a SEBI-registered financial advisor before making any real trading decision. By engaging with this content, you acknowledge full responsibility for your trades and investments.
💬 Found this useful?
🔼 Give this post a Boost to help more traders discover clean, structured learning.
✍️ Drop your thoughts, questions, or setups in the comments — let’s grow together!
🔁 Share with fellow traders and beginners to spread awareness.
👉 “If you liked this breakdown, follow for more clean, structured setups with discipline at the core.”
🚀 Stay Calm. Stay Clean. Trade With Patience.
Trade Smart | Learn Zones | Be Self-Reliant 📊
COFORGE: Reversal Bet with 40% Upside POtential⚡️Price Analysis:
1️⃣ Price showing strength.
2️⃣ Price structure is bullish.
3️⃣ Good momentum is expected after ATH breakout
✨ Key Observations:
➡️ RRR favourable at CMP.
➡️ Price trading above EMAs.
⚠️ Disclaimer: This is NOT a buy/sell recommendation. This post is meant for learning purposes only. Views are personal. Please, do your due diligence before investing.⚠️
💬 Share your thoughts in the comments below! ✌️
🔥 Trade Safe! ✅ 🚀
CoforgeThe stock appears to be reversing from the Fibonacci retracement levels, in the aligning with the 200 EMA and 200 DMA on the weekly timeframe.

Coforge-A perfect watchlist stock!Coforge is an IT services company providing end-to-end software solutions and services and is among the top-20 Indian software exporters according to Screener data. Stock has give 20% compounded sales growth in last 5 years which is quite remarkable.
Hence, It can be a good stock to be kept in watchlist for medium to long term.
Stock had given breakout of cup and handle pattern in weekly time frame and is now retesting the same.
Stock has formed a kind of morning star pattern at the retest support zone. Need to watch if it sustains above this zone.
As you can see, retest zone also coincides with 50% fib retracement which makes it even stronger.
If we see good buying in this stock from here, we can see ATH levels soon and even bigger levels in coming years.
However, If stock goes below 61.8% retracement, it is not advisable to hold.

COFORGE cup and handleCoforge Ltd made cup and handle pattern breakout happening in weekly timeframe.
Trading in sharp upward channel
Breakout will take stock to 10000+ in long term timeframe
MACD is bullish.
Disclaimer : I am not SEBI registered. Its my personal view and analysis.

Coforge Intraday SetupCoforge looks bullish above previous day high for atleast 1% target with SL given in chart.
After 1% can be trailed using 13 ema as stop loss on 5 min time frame.
Disclaimer: Only for entertainment purposes, not an investment advice.

Breakout from triangle pattern in Monthly Chart: COFORGECOFORGE reached an ATH of 6135 in the month of Jan'22 and corrected by almost 52% to reach a low of 3210 in Sep'22. It has formed a triangle pattern on monthly chart and has been in an upward journey since Oct'22 generating almost 32% returns.
Last month i.e. in May'23 it has broken out of the triangle. This indicates significant upside potential of minimum 24%. The journey has just started so it is the best time for entry.
Stop Loss: 4350

Flag breakout in Co-ForgeIT Sector has been outperforming for a while now and co-forge after being a laggard has caught up well. It it now breaking out from a flag pattern which is another bullish sign. There is a good chance that the stock starts another leg of up move from here.

COFORGE & ECLERX: Two IT Underdogs on the Rise!COFORGE
The stock displayed an Inverted Head & Shoulders pattern, and following the breakout, the price saw a substantial rise, subsequently created another bullish formation called Pole & Flag.
Recently, the price has broken through and is expected to continue its upward trend.
ECLERX
This chart also reveals the presence of an Inverted Head & Shoulder pattern.
Following a recent breakout, the price is positioned for an upward movement.

Coforge Swing Idea Weekly timeframe is bullish
Daily timeframe is bullish and price has tapped into daily demand zone and reacted positively
4HR is also bullish
Also, Nifty and CNX IT is also bullish
Company is also 10% away from all time highs because of that the stock can rip high
Note : this is not Financial advise

COFORGE Long Opportunity If price come around 5000-5100 then we can go long till Target 1 & 2
I am NOT a SEBI registered advisor or a financial adviser. Any of my investment or trade ideas I share on my profile are only my view point.

COFORGE FOR 5%Coforge is one of the good IT stock is ready for break out.
In past weeks we do see a sharp downside movement in IT stocks and now IT stocks ready for rally.
Coforge CMP : 4724
SL : 4695
TARGET : 4900

COFORGE NSE:COFORGE is now available at a major support. Signs of reversal should lead investment opportunities into this stock. Majorly owned by DIIs and a professionals led management makes it a good stock at PE of 34.

COFORGE high potencialNSE:COFORGE
Good to keep on the radar
Always respect SL & position sizing
========================
Trade Secrets By Pratik
========================
Disclaimer
SEBI UNREGISTERED
This is our personal view and this analysis
is only for educational purposes
Please consult your advisor before
investing or trading
You are solely responsible for any decisions
you take on basis of our research.
