COFORGE - Bullish Breakout Swing Trade Setup💹 Coforge Ltd (NSE: COFORGE)
Sector: IT Services & Consulting | CMP: 1910.20 | View: Bullish Breakout Swing Trade Setup
The COFORGE price structure has begun to reveal a controlled, conviction-based transition from consolidation to momentum. The latest bullish candle wasn’t just a breakout attempt — it carried strength, intent, and participation. Price pushed cleanly through short-term supply while maintaining the higher-low rhythm that has been forming over the past few weeks, indicating a well-built base rather than a reactive spike. Momentum indicators aligned with the price story. RSI broke above its resistance zone, shifting from neutrality into strength — a classic early phase of trend expansion. The Bollinger Bands opened up as the BB Squeeze turned off, confirming that volatility has started releasing in the direction of the breakout. This is typically the moment where institutions begin showing their hand. Volume behaviour strengthened the narrative. The surge wasn’t erratic; it was measured, steady, and consistent with accumulation rather than exhaustion. Buyers absorbed supply efficiently, allowing price to move with stability instead of urgency. This is the type of volume signature that precedes a clean swing leg. Supporting metrics in the broader structure pointed toward balance with a bullish tilt. Market strength indicators showed improving buyer control, the candle body carried dominance, and the range behaviour leaned towards continuation rather than rejection. No distortions, no volatility shocks — just a disciplined transition into momentum.
Taken together, COFORGE presents a well-structured environment:
– Strong candle dominance
– Expanding volatility in the direction of strength
– RSI and BB signals aligning
– Controlled volume confirmation
– A swing-friendly setup with a developing trend backbone
Illustrative Swing Trade Example –
Entry Price: 1910.20
Stop Loss: 1880(On Daily Closing Basis)
View: Short-term swing trade based on bullish breakout
⚠️ Disclaimer
This document is strictly for educational and informational purposes. All examples, charts, levels, and option structures discussed are illustrative and are not intended as buy, sell, or hold recommendations. STWP does not provide investment advice, trading tips, signals, or personalized financial guidance of any kind, nor is it a SEBI-registered intermediary or research analyst.
The analyses, illustrations, and risk–reward structures included here are generic in nature and based on publicly available data and observed market behaviour, which may change without notice. Financial markets involve significant risk; derivatives in particular carry the potential for substantial losses. Option premiums, implied volatility, open interest, delta, and other market variables can fluctuate rapidly and unpredictably. Readers are solely responsible for their trading decisions, capital management, and risk assessment. Before making any investment or trading decision, please consult a SEBI-registered investment advisor. STWP, its representatives, and affiliates shall not be liable for any direct or indirect loss arising from the use of this material. Historical patterns or past market behaviour do not guarantee future outcomes. Nothing in this document should be interpreted as a promise of performance, accuracy, or returns.
Position Status: No active position in COFORGE at the time of analysis.
Data Source: TradingView & NSE India .
💬 Found this useful?
🔼 Boost this post to support structured learning
✍️ Drop your thoughts or questions in the comments
🔁 Share with traders who benefit from clean technical studies
👉 Follow for disciplined, structured, STWP-style analysis.
🚀 Stay Calm. Stay Clean. Trade With Patience.
Trade Smart | Learn Zones | Be Self-Reliant 📊
Coforgechartanalysis

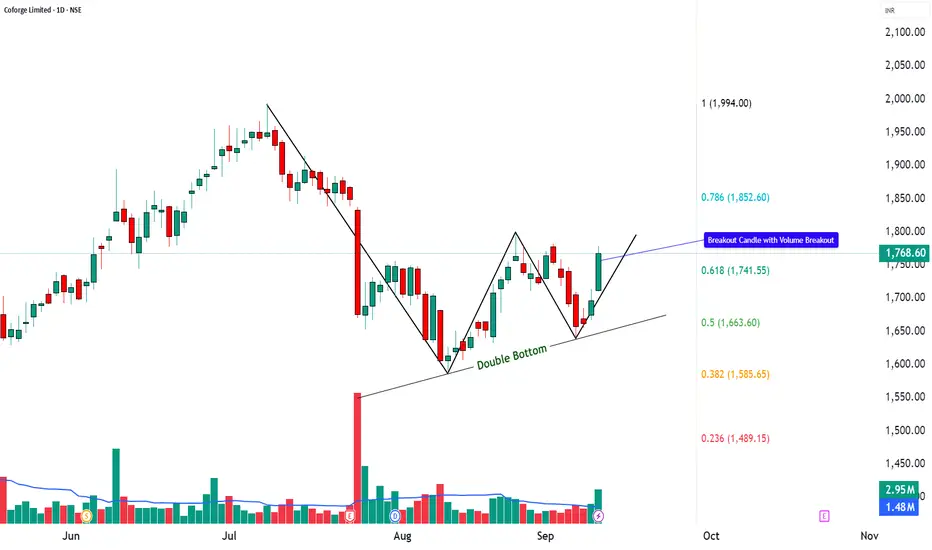
Coforge | Double Bottom Reversal with RSI + MACD Breakout📌 Coforge Ltd. – Closing Price: ₹1,768.60
📊 Technical Indicators Explained
Coforge is showing strong technical signals. A Double Bottom pattern 📉➡️📈 suggests a possible bullish reversal, while a strong bullish candle 🔥 confirms momentum. The RSI breakout ⚡, MACD crossover 📊, and volume surge 🚀 all indicate growing trader participation. With supports holding firm and resistances nearby, the stock is entering a decisive zone.
________________________________________
📈 Bullish Case – Why the stock could go up
Double Bottom signals potential trend reversal.
Strong bullish candle with volume validates buying interest.
RSI breakout + MACD crossover = bullish confirmation.
Fibonacci retracement levels open upside zones towards ₹1,852 – ₹1,994+.
📉 Bearish Case – Potential downside risks
If price fails to sustain above ₹1,726, weakness may return.
Broader market corrections could weigh on momentum.
A breakdown below ₹1,657 would weaken the bullish outlook.
⚡ Momentum Case – Short-term Trading Edge
Strong bullish candle + RSI breakout = near-term strength.
Sustaining above ₹1,780–₹1,800 could push towards higher Fibonacci levels.
Heavy volume indicates short-term traders are active.
📊 Support & Resistance Levels
Support Zones: ₹1,657 | ₹1,683.67 | ₹1,726.13
Resistance Zones: ₹1,794.93 | ₹1,821.27 | ₹1,863.73
📅 Short-term vs. Long-term Perspective
Short-term: Stock may test resistance levels between ₹1,795 – ₹1,860 if momentum sustains.
Long-term: Formation of a double bottom indicates potential for a structural trend reversal if higher levels hold.
✅ Conclusion: Coforge is showing a technical reversal pattern with strong momentum signals.
👉 The stock is at a key breakout zone — short-term traders may track resistances closely, while long-term investors can monitor the double bottom for confirmation of sustained trend change.
⚠️ Disclaimer – Please Read Carefully
The information shared here is meant purely for learning and awareness. It is not a buy or sell recommendation and should not be taken as investment advice. I am not a SEBI-registered investment advisor, and all views expressed are based on personal study, chart patterns, and publicly available market data.
Trading — whether in stocks or options — carries risk. Markets can move unexpectedly, and losses can sometimes exceed the money you have invested. Past performance or past setups do not guarantee future results.
If you are a beginner, treat this as a guide to understand how the market works — practice on paper trades before risking real money. If you are experienced, always assess your own risk, position sizing, and strategy suitability before entering trades.
Consult a SEBI-registered financial advisor before making any real trading decision. By engaging with this content, you acknowledge full responsibility for your trades and investments.
💬 Found this useful?
🔼 Give this post a Boost to help more traders discover clean, structured learning.
✍️ Drop your thoughts, questions, or setups in the comments — let’s grow together!
🔁 Share with fellow traders and beginners to spread awareness.
👉 “If you liked this breakdown, follow for more clean, structured setups with discipline at the core.”
🚀 Stay Calm. Stay Clean. Trade With Patience.
Trade Smart | Learn Zones | Be Self-Reliant 📊
CoforgeThe stock appears to be reversing from the Fibonacci retracement levels, in the aligning with the 200 EMA and 200 DMA on the weekly timeframe.

Unlocking Potential: Coforge's Bullish Breakout 🚀Coforge, the stock that everyone's talking about! Today, it shattered its all-time high, painting the charts with a robust bullish candle and trading at 6584 rs. Let's dive into the details:
Coforge Ltd., an Information Technology company in the IT - Software sector, demonstrates strong fundamentals.
📊 Key Observations:
Coforge broke its all-time high today, fueled by a strong bullish candle and significant volumes.
The daily chart reveals a consistent surge in volumes accompanying bullish candles over the past days, indicating substantial buying interest.
Fundamentals are robust, providing a solid foundation for the stock's upward trajectory.
📈 Technical Insights:
In the weekly chart, we witness a remarkable journey. The stock hit its previous all-time high in January 2022.
Examining the last four weeks, we note a breakout of the previous all-time high. Following the breakout, the price retraced to test this level, and today, it surged past the previous all-time high.
📊 Fundamental Insights:
In terms of financial performance, Coforge exhibits robust numbers, including a Price-Earning Ratio (PE) of 58.86 and a PEG Ratio of 2.58. The company has consistently delivered positive returns, with a 5.8% increase in a day, 40.5% in 6 months, and an impressive 1,653.3% in 10 years. The organization's financial health is evident through metrics such as high return on equity, return on capital employed, and increasing annual earnings per share.
Furthermore, Coforge maintains a strong balance sheet with low leverage, high interest coverage ratio, and a high current ratio. The company consistently pays dividends, boasting a positive dividend yield of 0.97%. The stock has seen increased institutional and mutual fund shareholding, while retail shareholding has decreased. Notably, there is zero pledge on the company's shares.
In Fundamental summary, Coforge Ltd. stands out as a fundamentally sound company with a strong track record, positive financial indicators, and a promising outlook in the Information Technology sector.
💡 Trading Strategy:
Considering the compelling setup, a buy trade can be planned at the current market price (CMP).
Set a stop loss below today's candle, ensuring at least a 1:2 risk-to-reward ratio.
For those aiming to ride the rally, trailing the stop loss is recommended for maximizing returns.
🚨 Remember, trading involves risk, and it's crucial to manage it wisely.
Lastly, 🌟 Thank you for your support, your likes & comments. Let's keep learning and growing together! 🚀📈💪
🔄 Trading Motivation: Embrace the opportunities, manage the risks, and ride the waves of success! 🌊 🚀
🚫 Note: This analysis is for educational purposes only and not intended as a trading or investment recommendation. I am not a SEBI registered analyst.

COFORGE CHART ANALYSISCOFORGE is stuck in Arc Chart Pattern at 1Hour Time Frame and Where it started a Arc resitance now end of the Arc again facing hurdle point or Resistance Point
Watching Volume Levels Big Players are Created there Position We Can See Such Big Move in Upcoming Session


Coforge Ltd - 27.05.2022Coforge Ltd - 27.05.2022
The stock is trading @ 3671 levels
There is a MACD Bullish Divergence in Weekly Chart
There is a Stochastic Bullish Divergence in Weekly Chart
Let the prices go above 3838 to initiate a buy position
Watch out for the price action.

CoForge Chart Analysis !!📈 CoForge 📉
My Findings :-
1. Breakdown of UpTrending Trendline Zone. See Below Chart.
2. Lower High and Lower Low Formation.
3. But IT Index at Support. To get more confirmation can be waited till IT Index Breaks down. Check IT Index Chart below for reference.
Bias- Short
Target- 3439, 2751 and 2390
SL- 4565
RR- 1: 3
IT Index Chart :-
All Important Supports and Resistances are drawn in chart. All levels are on closing basis.
Please have a look and revert back if you need some more study on it.
Disclaimer : Consult Your Financial Advisor Before Taking Any Decision On This Analysis.
