COLPAL RETEST DONE!NSE:COLPAL
On A 30 MIN Timeframe it has broken out from range sharply and then it is not doing a retest around this BO zone.
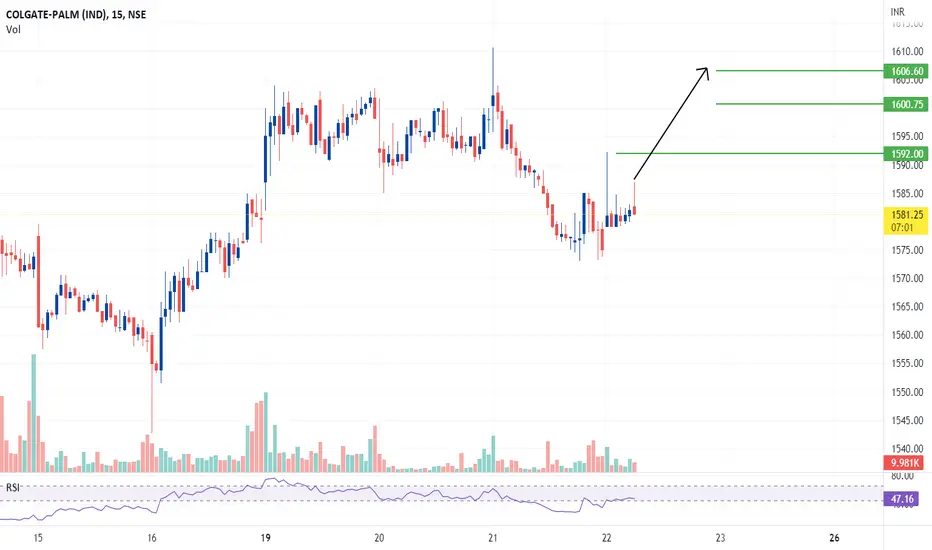
Fib Retracement level are also around 618
+
Trend line support.
levels marked on chart,trade with caution
Keep learning.
Happy Trading.
COLPAL

Breakout - Colpal > 1825Breakout - Colpal > 1825
COLPAL has already broke the 1825 level.
But from last 3 weeks , it is continuously moving.
I will wait for confirmation and if take little bit profit booking then it will be good opportunity to accumulate

Broadening Wedge Pattern Breakout in COLPAL📊 Script: COLPAL
Key highlights: 💡⚡
📈 On 30 Minutes Time Frame Stock Showing Breakout of Broadening wedge Pattern.
📈 Strong Bullish Engulfing Candlestick Form on this timeframe.
📈It can give movement upto breakout target of 1533+.
📈 Can Go Long in this stock by placing stop loss below 1500 for target of 1525 and 1533.

COLPAL Set to Outperform Index Nifty 50Attached: COLPAL/ NIFTY 50 Daily Chart as of 11th May 2023
The above Ratio Chart shows a Classic Bull Flag Setup within an Inverted Head & Shoulders Pattern. This is Bullish Evidence in favor of the Ratio Rallying Upwards
They say Buy Strength and Sell Weakness
Therefore this makes NSE:COLPAL a BUY given its Potential to Outperform!

Trendline and Range StockThis is simple Monthly Chart of COLGATE PALMOLIVE (COLPAL) and it is respecting the trendline and the resistance line, thus in a UPTREND CHANNEL since 2009.
Long term trend always prevails in the market, Even if someone is stuck in a stock at wrong time but if its longer trend is in uptrend there are high chances that it will recover some day.
High time frame analysis has its own benefits such as higher returns, less follow up , dividends and other benefits. It could be seen as an investment perspective as well.
This time there is a BULLISH HAMMER candle made in february 2023 at the support of the trendline. This is the one of the simple analysis which shows that investment and trading in the market is easy and doesn't require rocket science. This is a favorable RISK-REWARD opportunity with a very small Stop loss at the low of the last hammer Candle.
ENTRY can be made at the current market price of 1488
STOPLOSS can be on the closing basis on the last candle i.e. at 1430 (Logic behind closing basis is that it is currently in an Uptrend so if it wants to go in a downtrend it will require a strong downside closing confirmation for the same otherwise if the price goes below the low of the last candle, Buyers may come and can take the price up again)
REWARD - the first target would be the last swing/Resistance that is 1674 and then at its last high of 1800 and then next target would be the resistance which is likely to be 2000.
*this is a Monthly Analysis, so requires longer patience.
*keep position Sizing according to your Risk Appetite.
*Market is simple, don't make it complicated, Simple things works, It is just a probability Game.
One can take ReEntry if it gives another opportunity but be ready to give SL.

Few Harmonic Patterns Looking at the charts on various time frames - few stocks with Possible upside Harmonic patterns are shared for study purpose:
NSE:LAURUSLABS
NSE:HINDUNILVR
NSE:ASHOKLEY
NSE:COLPAL


COLPAL Trendline breakoutCOLPAL Trendline breakout. Potential up move to 1720 & then to 1800.. & there is a good volume today & yesterday
SL: 1560.
Note: I'm not a SEBI registered.Please Consider these for educational purpose.

COLPAL looking weakColpal on weekly charts is looking weak and has broken down important demand zone and also long term trendline support. Current weekly looks to be a pullback / retest of the breakdown and positionally it may slip down further. Further details are marked on charts, longs needs to be cautious here.

colgate india (colpal)should not break 1540 in continuation of this pattern in the upcoming down move of the broader market

COLPAL is at low risk levelI am not a SEBI registered adviser. All the information provided by me are for educational/informational purposes only.
COLPAL has 3 confirmations.
1. Bullish Divergence
2. Support taken
3. Market is bullish
Hope this helps you take your decision.

COLPALCOLPAL:- Rounding bottom pattern has formed, keep an eye on the stock
Hello traders,
As always, simple and neat charts so everyone can understand and not make it too complicated.
rest details mentioned in the chart.
will be posting more such ideas like this. Until that, like share and follow :)
check my other ideas to get to know about all the successful trades based on price action.
Thanks,
Ajay.
keep learning and keep earning.

ColgateCOLPAL is forming a bearing wedge pattern which is RISING WEDGE PATTERN
RISING WEDGE PATTERN is pattern where Seller wins the race in the end.
*Only for Education Purpose and not a trading IDEA*
** Open for Suggestion Please**

long tradestaying long for targets given in chart above
buy is based on ichimoku analysis
disclaimer - trade @ own risk
COLPAL NEAR SUPPORT ZONE | BOUNCE EXPECTEDColpal near it's support zone and expecting a bounce towards white marked targets on the chart.
To motivate us, Please like the idea If you agree with the analysis.
Happy Trading!
InvestPro India Team


Colpal looking good for upmove
*If today closing done above counter trendline, one should enter at end of the day.
*Target -1680
* SL - low of the green candle
* FMCG sector is shining .
* Nifty FMCG at vege of breakout of all time high

BULLISH on COLPALNSE:COLPAL
The prices have given breakout from the Triangle pattern. The prices are trading above the moving averages which shows bullishness. The MACD is also bullish. The RSI is above 50 which shows good momentum. There is also good volume during breakout. This view is for 1 to 6 months. The Targets and SL are given on the charts.
Disclaimer : This is my own view and analysis. This is for educational purposes. This is not a recommendation, call or a tip.

COLPAL Daily Chart analysis by 3 Parameter StrategyTrade Setup:
Enter at the opening price.
Avoid the stock if it opens with a gap-up of more than 2%.
Stoploss should be at the low of the signal candle. But the candle is big in size so we can place a stoploss below to sma20.
All 3 Parameters of the strategy are matched.
The bollinger bands are squeezed as compared to the previous structure.
The signal candle gives a breakout of the upper band of the signal candle.
Rsi is above 60.
Bullish crossover on Macd.
Conclusion:
Bullish

Symmetrical triangle breakout in ColgateChart -> Colgate Daily
Colgate has given a symmetrical triangle breakout with a good volume pop-up.
CMP: 1630
Targets: 1700, 1780
SL: Daily closing below 1550
Disclaimer: This is for educational purposes only, not any recommendations to buy or sell. As I am not SEBI registered, please consult your financial advisor before taking any action.

Breakout in colpalBeautiful breakout in colpal daily time frame (I know market bearish hai, per achchi candle ke saath breakout aaya hai to long ja sakte hain)

COLPALNSE:COLPAL
Note :
1.One Can Go long with a Strict SL below the Trendline or Swing Low of Daily Candle.
2. Close, should be good and Clean.
3. R:R ratio should be 1 :2 minimum
4. Plan as per your RISK appetite
Disclaimer : You are responsible for your Profits and loss, Shared for Educational purpose!

Stock Analysis for Swing tradersStock Analysis for Swing traders. This stock looks good for swing traders and positional traders with very small risk. Risk reward is favorable.
