NMDC: Short term & Mid term view- BullishTarget given by using patterns. Indicators are showing bullish signals on weekly chart and Daily MACD crossover may happen on upcoming days. Be ready for the next move on upside. Stoploss as per your risk. Apart from technical Iron and coal prices are multiyear high so can expect a good quarter on fundamental side.
Vijayaraghavan.K,
Kovilpatti,Tuticorin dist.
Commodity Channel Index (CCI)

SUNTV: Short term & Mid term view- BullishMonthly MACD crossover happened but the stock price not reacted and all my indicators are showing bullish on this stock. Daily MACD crossover also may happen on upcoming days. ADX trend is getting strong but price not moving much. It can shoot up on upcoming days. Price may move more than the target levels bcaz of the bullish signals in monthly chart.
Vijayaraghavan.K,
Kovilpatti,Tuticorin dist.

Superhouse: Short term & Mid term view- BullishIndicators are showing bullish signals on daily chart. Round bottom forming on weekly chart. Once stays above 209 levis on weekly closing basis, may expect further more upside.
Vijayaraghavan.K,
Kovilpatti,Tuticorin dist.

Exide: Short term view-BullishDaily and weekly MACD Crossover, Daily CCI indicating positive these may help to reach the target.
Vijayaraghavan.K,
Kovilpatti,Tuticorin

SONATA SOFTWARE | Regression Trend Analysis Rational - Regression Trend Analysis & RSI and CCO Divergence

CESC : MID term view- BullishIt breakout the channel and formed cup and handle pattern . All indicators are bullish Monthly MACD crossover may happen upcoming months. Share split also may approved on upcoming AGM. These parameters may help to reach the target levels.
Vijayaraghavan.K,
Kovilpatti, Tuticorin Dist.

PTL Enterprises Ltd: Short term & Mid term bullish viewAs per pattern Round bottom and double bottom also. MACD crossover may happen on weekly chart. Dividend also coming Rs.2.5. These parameters may help to reach the target.
Vijayaraghavan.K,
Kovilpatti, Tuticorin Dist.

Steel City Securities: Short term to mid term view BullishInverted head and shoulder pattern. Indicators are showing positive signals. Use every dips for the target. When looking fundamental, It can go more than that the above target level.
Vijayaraghavan.K,
Kovilpatti,Tuticorin dist.

Petronet : Short &mid term view bullishDaily MACD cut, Weekly MACD crossover, Ichimoku cloud top and above conversion line. These parameters may lead to reach the target levels.
Vijayaraghavan.K,
Kovilpatti.

Aries Agro:Short&Mid term view bullishPositive CCI,MACD and ADX also may turn bullish side on day chart. In ICHIMOKU conversion line crossed above base line. These will helps to move upwards.
Vijayaraghavan.K,
Kovilpatti.

BSE : Short & Mid term viewApart from patterns, It may turns bullish side on monthly chart. It is not participated much on market rally. Monthly MACD is positive and also other indicators also showing positive signals. Any time can shoot-up. At first, Daily MACD crossover helps to move upside from the current levels and it may reach the targets on upcoming weeks/Months.
CMP:586.55
Vijayaraghavan.K,
Kovilpatti.

TV18 Broadcast: Mid & Long term bullishRef chart. View given based on weekly and monthly indicators. Monthly MACD crossover and CCI above 0 level will helps to move further target levels.
Vijayaraghavan,
Kovilpatti
TLong

APLLTD: Short term viewIt slowly turns bearish to bullish side for short term. MACD Crossover may helps to reach the first target.
Vijayaraghavan.K,
Kovilpatti

HMVL:Short and mid term bullishIt loosing the grip from bearish side. Indicators are showing positive signals. It may go further upside on upcoming weeks/Months.
Vijayaraghavan.K,
Kovilpatti.

NB Venture: Short & Mid term BullishRef Chart. Indicators are bullish on Daily, Weekly and Monthly charts.
Vijayaraghavan.K,
Kovilpatti.
N

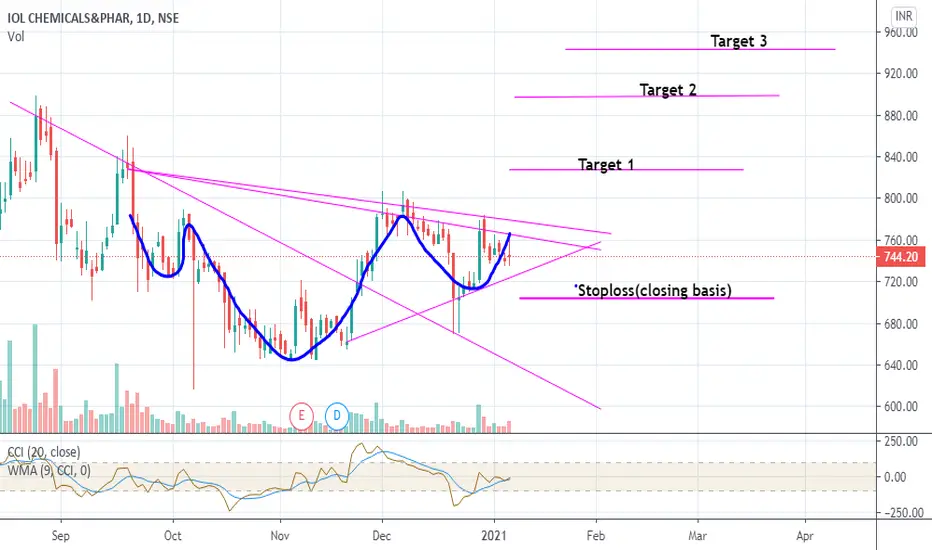
IOLCP: Short& Mid term view BullishRef chart. MACD crossover may happen on upcoming days in daily chart. This will trigger to price shoot-up. In daily chart Indicators are turning bullish from bearish . In monthly chart indicators are continuing the bullish momentum last few months. From this level it may move the further upside. Targets are given by using patterns.
****Note: If you noticed my earlier views, most of the views given before breakouts by using indicators. Risk takers no issues but Safe traders can take the trade after breakout.
Vijayaraghavn.K
Kovilpatti.
Dhanlakshmi Bank: Short term bullish viewDaily and weekly indicators showing bullish signals and monthly indicators also showing positive momentum. These will helps to reach the given target levels. Breakout also done.
Vijayaraghavan.K,
Kovilpatti

Just Dial: Short term & Mid term view BullishBreakout done and Indicators are showing bullish signals. If it sustain above the target level, It may move further upside upto 760. In Monthly chart MACD crossover may happen on upcoming months. So it may show the positive momentum on upcoming weeks.
Vijayaraghavan,
Kovilpatti.


GMDC: Short term BullishRefer the chart for target and stoploss. Indicators showing positive signals. In monthly chart, slowly turning from bearish to bullish. Possible to go above the target level on upcoming weeks.
Vijayaraghavan.K,
Kovilpatti.

BHEL: Long term bullishRefer chart.. As per weekly and monthly chart it is turning from bearish slowly. Weekly MACD cut will helps to reach Target 1.
Vijayaraghavan.K,
Kovilpatti.


Caplin Point: Short term bullishRef chart.. As per daily and weekly chart showing bullish signals. It may reach on upcoming days.
Vijayaraghavan.K,
Kovilpatti.
