USDCAD – Bearish Trade Setup (1H Timeframe)Trade Details
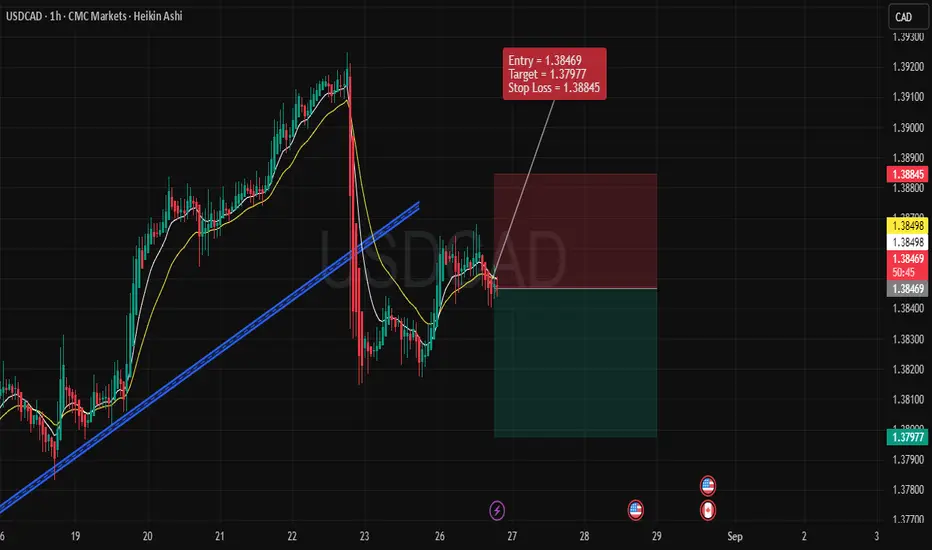
Entry: 1.38469
Stop Loss: 1.38845
Target: 1.37977
🔹 Technical Reasons for Bearish Bias
Trendline Breakdown
Price recently broke below the rising trendline, indicating that the bullish momentum has weakened.
The failed retest of the broken trendline confirms bearish pressure.
Moving Averages Confirmation
The short-term moving averages (yellow lines) have crossed to the downside, aligning with bearish sentiment.
Price is trading below these moving averages, signaling sellers are in control.
Lower High Formation
After the sharp drop, the latest pullback failed to make a new higher high.
This indicates a shift from bullish structure to a bearish lower-high pattern.
Weak Recovery Attempt
The rebound after the drop is shallow and lacks strong bullish candles.
This suggests the market is unable to regain bullish momentum.
🔹 Risk Management
The Stop Loss is placed above the recent swing high (1.38845), protecting against sudden spikes.
The Target is set at 1.37977, aligning with recent support levels and offering a favorable risk-to-reward ratio.
🔹 Trade Outlook
This setup anticipates continuation of the bearish trend after the trendline break. Unless price reclaims and sustains above 1.3885, sellers remain favored in the short term. A successful breakdown could open the way for deeper downside in USDCAD.
✅ Summary:
Bearish structure confirmed by trendline break, bearish moving average alignment, and weak recovery → Entered short at 1.38469, targeting 1.37977 with stop at 1.38845.
Community
2 Swing trading ideas for 5 July MarketsI daily make educational content videos for swing / positional trading

BPCL, Technical OutlookThe price is strongly rejected by the LTMA band.
Also the formation of an Inverted Hammer Candle in the negative zone indicates a down move.
The price could test the levels of 565 and if broken then 535.
Disclaimer : This is my pre market analysis and my trading journal. Not a suggestion to buy or sell.

ZEE ltd Analysis!As per trend its bullish facing big resistance at 289 & trend line breakage today at the end of day.
Good Buying oppurtunity for holding from 285 to 281
Support at 281
Resistance at target 289 to 290

2 Amazing pattern based swing trades for 9 Feb I daily make educatioanl content videos for financial markets on swing trading
