#SMSPHARMA - VCP BO in DTFScript: SMSPHARMA
Key highlights: 💡⚡
📈 VCP BO in DTF
📈 Volume spike seen during Breakout
📈 MACD Bounce
📈 RS Line making 52WH
If you have any doubts about the setup, drop a comment and I’ll reply.
✅ Boost and Follow to never miss a new idea!✅
✅Repost 🔁 Like <3 and Follow to never miss a new idea! ✅
⚠️ Important: Always Exit the trade before any Event.
⚠️ Important: Always maintain your Risk:Reward Ratio as 1:2, with this RR, you only need a 33% win rate to Breakeven.
⚠️Disclaimer: I’m not SEBI Registered RA. My posts are purely for training and educational purposes.
Eat🍜 Sleep😴 TradingView📈 Repeat 🔁
Consolidation-breakout

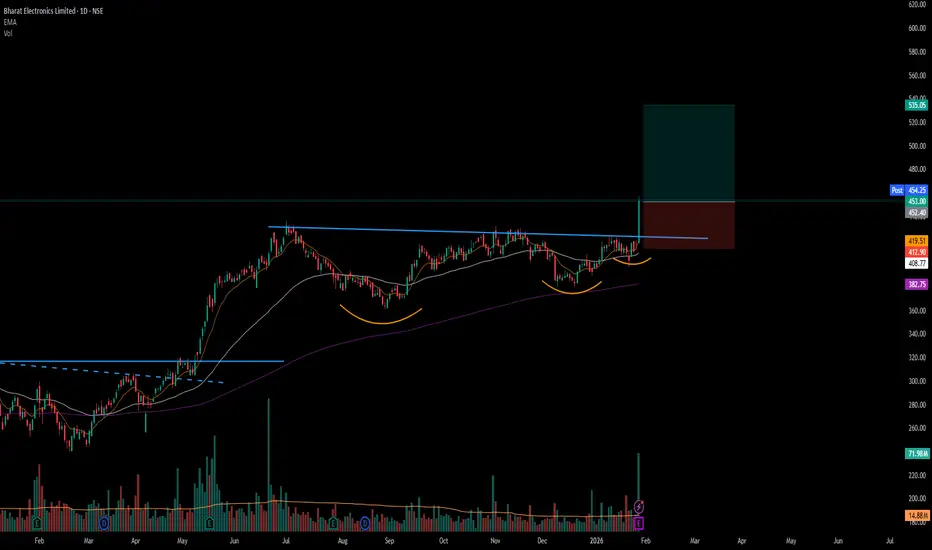
Imdus towers in a rectangle pattern Indus Towers
Setup: Range consolidation near resistance
Trigger: Breakout above ₹454
Confirmation needed: ≥ 1.5× average volume
RSI / OBV: RSI near 60, OBV improving
Stoploss: ₹318
Target: ₹594
Bias: Conditional — trade only on decisive expansion

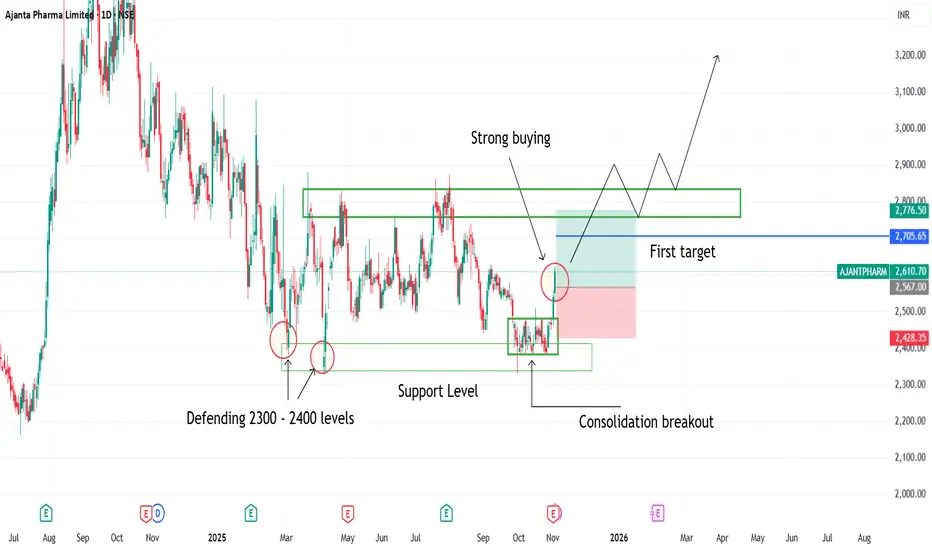
Consolidation breakout seen in ajanta pharma1. Consolidation breakout seen in ajanta pharma
2. Buyers defending 2300 2400 levels
3. Strong Bullish candles indicating strong buyers strength
4. Consolidation breakout has been happened on support levels
Ramco Cements Ltd . Daily Chart Horizontal Channel1.There is consolidation in the horizontal channel between the 980 support and 1,098 resistance (white lines). A breakout above 1,098 would confirm the bullish reversal.
2. EMA status:
EMA 21 (purple) is above EMA 55 (green), showing short‑term bullish momentum.
EMA 55 is above EMA 100 (blue) and EMA 200 (orange), indicating the medium‑term trend is up.
Price is currently above all EMAs, providing multi‑timeframe support.
3. Volume: Volume has risen on the recent upmove, signaling growing buyer interest. A breakout should be accompanied by a spike above average volume for confirmation.
4. The View : Breakout looks possible but support of volume is needed a long with momentum - RSI is well above 60. This suggest fresh momentum

#BEL - VCP BreakOut in Daily Time Frame Script: BEL
Key highlights: 💡⚡
📈 VCP BreakOut in Daily Time Frame
📈 Volume spike during Breakout
📈 Base BreakOut
📈 RS Line making 52WH
📈 MACD Crossover
⚠️ Important: Market conditions are BAD, Avoid entering any Trade. Protect Capital Always
⚠️ Important: Always Exit the trade before any Event.
⚠️ Important: Always maintain your Risk:Reward Ratio as 1:2, with this RR, you only need a 33% win rate to Breakeven.
✅ Boost and Follow to never miss a new idea!✅
Disclaimer: I am not SEBI Registered Advisor. My posts are purely for training and educational purposes. Not a BUY or SELL recommendation.
Eat🍜 Sleep😴 TradingView📈 Repeat 🔁
Happy learning with MMT. Cheers!🥂
Types of Breakout in the Markets ( Monthly Time Frame )In this video I will showcase different type of Breakouts you can see in the markets, mostly Horizontal types and Trendline Types but even inside them which ones are best to follow
I have used charts older than 3 months to showcase this information

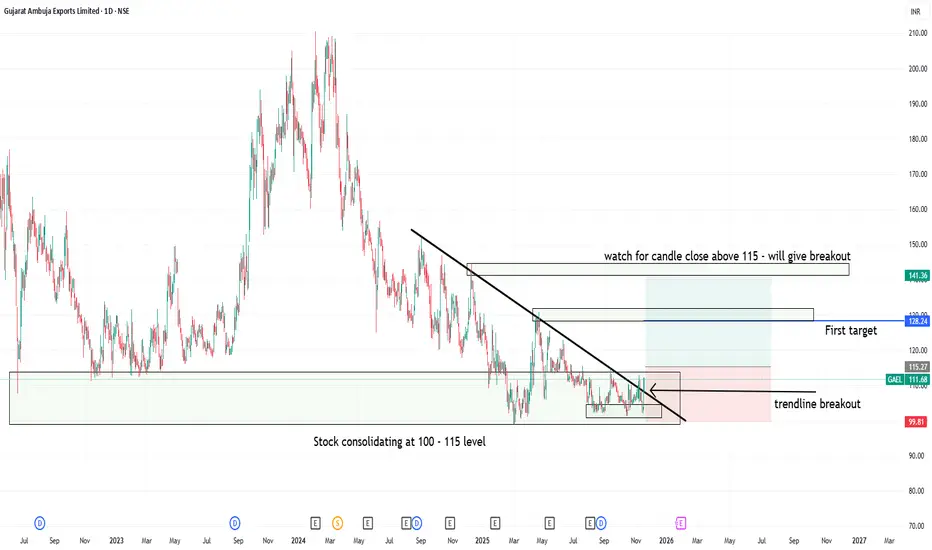
Trendline breakout at support level in GAEL1. Gujrat ambuja export lt- showing consolidation at 100 to 115 levels
2. Candle close above 115 can trigger consolidation breakout at strong support zone
3. Trendline breakout has already happend but above 115 close will be safe and logical
4. Good Risk:Reward one can watch for upside movement with strict sl level
#JKTYRE - Cup & Handle / IHNS BO in DTFScript: JKTYRE
Key highlights: 💡⚡
📈 Cup & Handle / IHNS BO in DTF
📈 Volume spike seen during Breakout
📈 MACD Bounce
📈 RS Line making 52WH
✅Boost and follow to never miss a new idea! ✅
⚠️ Important: Always Exit the trade before any Event.
⚠️ Important: Always maintain your Risk:Reward Ratio as 1:2, with this RR, you only need a 33% win rate to Breakeven.
⚠️Disclaimer: I am not SEBI Registered Advisor. My posts are purely for training and educational purposes.
Eat🍜 Sleep😴 TradingView📈 Repeat 🔁

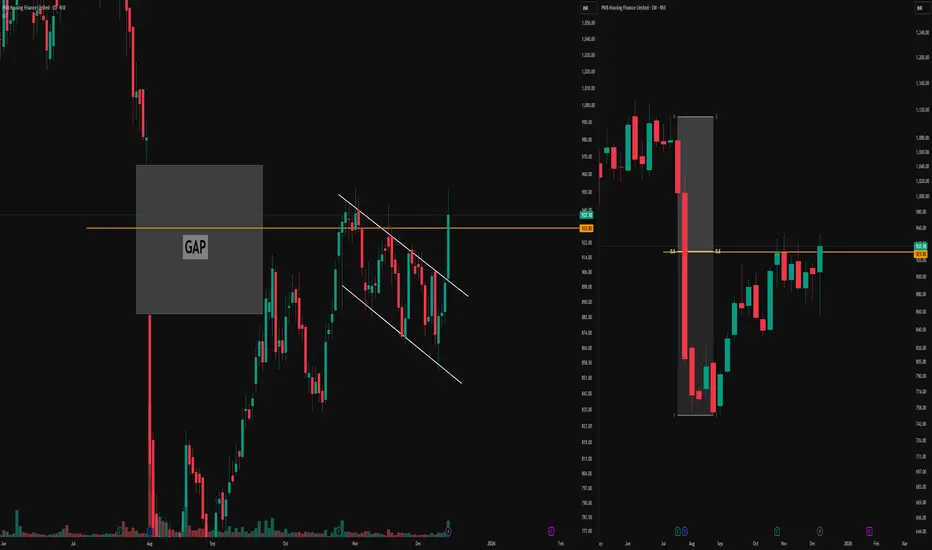
Parallel Channel, Stubborn Gap & 0.5 Equilibrium RejectionDaily Timeframe Details
The left chart on the daily timeframe displays a parallel channel structure forming after an initial one-sided move.
A significant gap emerged within this leg, which price has approached multiple times—first entering the gap area from below but rejecting sharply to form a higher low, then pushing toward a higher high without fully filling it.
This illustrates how gaps often resist easy fills from either direction, acting as persistent reference zones that demand confluence for interaction.
Weekly Timeframe Context
The right chart provides the weekly timeframe for the same instrument, highlighting repeated rejections at the 0.5 equilibrium level.
These weekly rejections align precisely with the daily gap interactions and channel boundaries, demonstrating how higher-timeframe equilibrium can underpin lower-timeframe price behavior without implying direction.
Such multi-timeframe alignment offers educational insight into structural references in market analysis.
This post serves purely educational and observational purposes and does not constitute buy, sell, or investment advice. Always conduct your own research.
#SAKAR - VCP BO in WTFScript: SAKAR
Key highlights: 💡⚡
📈 VCP BO in WTF
📈 Volume spike seen during Breakout
📈 MACD Bounce
📈 RS Line making 52WH
⚠️ Important: Always Exit the trade before any Event.
⚠️ Important: Always maintain your Risk:Reward Ratio as 1:2, with this RR, you only need a 33% win rate to Breakeven.
✅Boost and follow to never miss a new idea! ✅
Disclaimer: I am not SEBI Registered Advisor. My posts are purely for training and educational purposes.
Eat🍜 Sleep😴 TradingView📈 Repeat 🔁

Lets Create and Backtest a Simple Strategy from literally ZeroI make educational content videos for swing / positional trading .
In this video I will be using 3 months old chart along with one example of how to approach any trade or price action with literally zero lines and zones on screen .

Consolidation happening in BBTC (Bombay burmah trading)1. is having consolidation pattern between 1750 - 2100 levels
2. One can watch for breakout above 2100 with good Risk : Reward
3. stock has give strong results attracting buyers and accumulation seen at 1850 levels
with strong buyer coming taking stock to 2050 levels in single day
4. stock may test its all time high if breaches 2400 levels

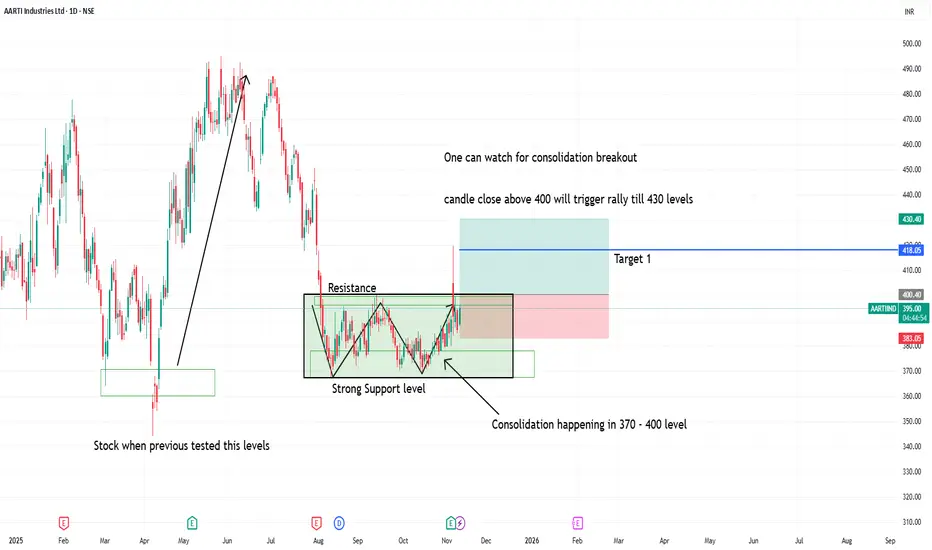
Watch for consolidation breakout in aarti industries1. Above 400 daily candle close will give strength to buyers to reach 430 level targets
2. Stock previously tested support levels gave big upside movement.
3. With good R:R one can watch for upside movement
4. normally the range of consolidation is target after breakout
if 30 points is consolidation range then target will 30 points after the consolidation breakout
Yatra Online (D): Strongly Bullish, Fundamentally-Driven BOThis is a high-conviction breakout, driven by explosive quarterly earnings. The stock has successfully broken its short-term consolidation but was temporarily rejected at its multi-year high. The underlying momentum is exceptionally strong.
🚀 1. The Fundamental Catalyst (The "Why")
The technicals are being driven by fundamentals. Today's +11.88% surge on massive 35.31 Million volume is a direct response to Yatra's record-breaking Q2 2026 earnings , which featured:
- Net Profit up 96% year-over-year.
- Revenue up 48% year-over-year.
- A raised full-year EBITDA guidance from the company.
📈 2. The Long-Term Context (The Setup)
- The Bottom & Reversal: After making its all-time low in March 2025 , the stock has been in a strong, sustained uptrend.
- The Consolidation: From August 2025, the stock entered a sideways trend, building a base for its next move. Volume was declining during this period—a classic sign of accumulation.
🎯 3. Today's Action (The "Two-Resistance Battle")
Today's price action was a textbook example of a breakout hitting two resistance levels:
- Resistance 1 (CLEARED): The short-term horizontal resistance from September 2025 (at ~₹172 ). The stock decisively broke and closed above this level.
- Resistance 2 (REJECTED): The long-term horizontal resistance from January 2024 (the previous multi-year high). The stock breached this level intraday to make a new ATH, but failed to close above it . This is a key sign of selling pressure or profit-taking at the old high.
📊 4. Key Technical Indicators
Indicator analysis confirms the bullish power across all timeframes:
- RSI: The Relative Strength Index is rising on the Daily, Weekly, and Monthly charts .
- EMAs: The short-term Exponential Moving Averages are in a "PCO" (Price Crossover) state on all three timeframes .
🧠 5. Future Scenarios & Key Levels to Watch
The path forward is now clearly defined by the two resistance levels identified.
🐂 The Bullish Case (Confirmation)
- Trigger: The stock must now get a decisive daily close above the long-term resistance (the Jan 2024 high it was rejected from today).
- Target: Once it clears that final hurdle, the path is open to price target of ₹205 .
🐻 The Pullback Case (Healthy Re-test)
- Trigger: If the stock is unable to continue the immediate momentum (due to the rejection) and pulls back.
- Target: The price will likely fall to re-test the resistance-turned-support at ₹172 . A "bounce" off this level would be a textbook, healthy confirmation of the breakout and a new buying opportunity.

Price Halts and Power of Confluence The price chart displays a noteworthy transformation as a previous supply zone evolves into an area of strong demand, illustrating a crucial market shift. The highlighted supply region, which had earlier capped price advances and attracted selling interest, has now transitioned into a price zone where buyers are stepping in, creating multiple reactions that signify growing demand as prices revisit this level.
- Supply to Demand Conversion: The red-shaded supply band acted as a ceiling for prices historically, but recent moves show price halting and consolidating above this region, marking a critical change in the market’s balance. This type of consolidation—where price compresses and pauses just after clearing a major supply area—is a visible sign of acceptance by market participants, as both buyers and sellers reassess value at this pivotal zone.
- Consolidation as Price Stability: Observing the price action post-supply area, there is clear evidence of tight, sideways movement—an area of price equilibrium or market indecision. This consolidation signals an important digestion phase, a hallmark of healthy price action
- Trendline Confluence: The thick green upward trendline adds a second layer of technical strength to this setup. Historically, prices have repeatedly taken support on this trendline during corrections, aligning perfectly with the newly converted demand area. This intersection of the time-based trendline with the horizontal supply/demand zone forms a strong confluence. Confluence zones like this are typically high-probability areas of interest, as the overlap of structural (trendline) and behavioral (supply/demand) features amplifies the significance of the region and attracts greater participation from market players.
-

Precision Wires (M): Strongly Bullish (ATH Breakout)The stock has decisively broken out of a 10-month consolidation range, creating a new All-Time High (ATH) on exceptional volume. This signals the potential start of a new, major uptrend.
📈 1. The Long-Term Context
- Sideways Trend: The stock was in a prolonged sideways consolidation phase starting from January 2024.
- Volume Contraction: During this sideways period, volume was "drying up," which is a classic bullish sign of seller exhaustion and accumulation.
- The "Lid": This consolidation formed a strong horizontal resistance level that capped all rally attempts throughout the year.
🚀 2. The Decisive Breakout (The October 2025 Event)
In October, the stock broke this pattern with explosive force:
- Massive Surge: The stock surged 23.11% in a single move.
- Exceptional Volume: This surge was backed by massive, high-conviction volume of 24.51 Million shares, confirming strong institutional interest.
- ATH Achieved: This move pushed the stock to a new All-Time High and, most importantly, closed firmly above the horizontal resistance that defined the 2024 & 2025 trading range.
📊 3. Key Technical Indicators
The underlying momentum supports this bullish breakout:
- EMAs: Short-term Exponential Moving Averages are in a "PCO" (Price Crossover) state, signaling a new, strong bullish trend.
- RSI: The Relative Strength Index (RSI) is rising, indicating that buying momentum is strong and accelerating.
🎯 4. Future Scenarios & Key Levels to Watch
⚠️ A Note of Caution
While the breakout is clear, we need to be cautious. After such a sharp vertical move, a "pause" or "pullback" is healthy. The primary risk to monitor is potential bearish divergence
🐂 The Bullish Case (Breakout Continuation)
- Confirmation: The old resistance must now act as new support. As long as the stock holds above this breakout level, the trend is intact.
- Target 1:₹320
- Target 2:₹410 (if momentum continues)
🐻 The Bearish Case (Breakout Failure)
- Trigger: If the breakout fails, the stock will fall back below the old horizontal resistance level (the one it just broke).
- Confirmation: A high-volume move back into the old range.
- Target: This would signal a "fakeout" and could lead to a sharp decline to the nearest support ₹170 .

BUY TODAY SELL TOMORROW for 5%DON’T HAVE TIME TO MANAGE YOUR TRADES?
- Take BTST trades at 3:25 pm every day
- Try to exit by taking 4-7% profit of each trade
- SL can also be maintained as closing below the low of the breakout candle
Now, why do I prefer BTST over swing trades? The primary reason is that I have observed that 90% of the stocks give most of the movement in just 1-2 days and the rest of the time they either consolidate or fall
Consolidation Breakout in KFINTECH
BUY TODAY SELL TOMORROW for 5%

Jayneco (W) - Breaks Out on Massive VolumeAfter an incredible 181%+ rally since April 2025, Jayaswal Neco Industries (JAYNECO) has been consolidating in a sideways trend for the past few weeks. This period of consolidation has now been decisively resolved to the upside.
This Week's Powerful Breakout
The past week's price action (ending Oct 24, 2025) was a significant win for the bulls:
- Strong Price Surge: The stock rallied by +15.95% for the week.
- Enormous Volume: This move was backed by a massive volume of 67.09 million shares , confirming strong buyer conviction.
- Key Resistance Breach: The surge shattered the consolidation's upper resistance trendline, and most importantly, closed the week above it .
Broad-Based Technical Strength
The breakout is underpinned by strong momentum across multiple timeframes. On both the Monthly and Weekly charts:
- The short-term Exponential Moving Averages (EMAs) are in a bullish Positive Crossover (PCO) state.
- The Relative Strength Index (RSI) is in a rising trend.
This alignment confirms that the primary momentum is strongly bullish and supports the case for a new leg up.
Outlook and Key Levels to Watch
With the resistance now cleared, the path of least resistance has shifted firmly upwards.
- Bullish Target: If this strong momentum is sustained, the next logical area of resistance and potential price target is the ₹84 level.
- Critical Support: The recently broken resistance, around the ₹75 level, now becomes the most critical new support zone.
As you noted, the price action next week will be crucial. Traders should watch for follow-through buying or a potential retest of the ₹75 breakout level, which would now be expected to act as strong support.

KOTAKBANK - Rectangle Consolidation Breakout Watch🚀 Kotak Mahindra Bank Ltd (NSE: KOTAKBANK) | Rectangle Consolidation Breakout Watch
📊 Current Market Snapshot
CMP: ₹2,063.30
Sector: Banking & Financial Services
Pattern Observed: 📦 Rectangle Consolidation (Range-Bound)
Candlestick Signal: Strong Bullish Candle + Bullish Engulfing
Strength Rating: ⭐⭐⭐⭐ (Bullish Breakout Watch)
________________________________________
📈 Price Action & Chart Pattern
The stock has been trading between support near ₹1,970 and resistance near ₹2,020, forming a sideways rectangle box. Today’s move shows a decisive bullish candle with high volume, suggesting a breakout attempt from this consolidation.
Support Range: ₹1,968 – ₹1,970
Resistance Range: ₹2,018 – ₹2,020
Breakout Zone: Above ₹2,020 with volume confirmation
Breakdown Zone: Below ₹1,970 may trigger renewed weakness
🔍 Why Important? Rectangle consolidations represent accumulation or distribution phases. A breakout above resistance often leads to strong directional moves.
________________________________________
🔎 Technical Indicators
RSI (14): 61.37 → Breaking out of consolidation zone.
EMA Support: Price reclaiming above EMA50, signaling trend strength.
Volume: Breakout attempt supported by 1.5x+ average volumes.
Kotak Bank — a strong bullish candle with Bullish Engulfing, RSI breakout, and Open = Low showing aggressive buying from the start. Price holding above VWAP signals institutional support, while the BB squeeze off suggests volatility expansion ahead. Together, these factors strengthen the case for a rectangle breakout continuation.
________________________________________
📍 Key Levels to Watch
Immediate Support: ₹1,968 – ₹1,970
Immediate Resistance: ₹2,018 – ₹2,020
Upside Possible (if breakout): ₹2,120 – ₹2,150
Downside Possible (if breakdown): ₹1,920 – ₹1,900
________________________________________
🔮 Bullish & Bearish Scenarios
✅ Bullish Case: Sustained close above ₹2,020 with strong volume may trigger a rally towards ₹2,120+.
⚠️ Bearish Case: Rejection near ₹2,020 and breakdown below ₹1,970 may drag the stock back to ₹1,920 or lower.
________________________________________
📝 STWP Trade Analysis
Entry: ₹2,063.30
Stop-loss: ₹1,968.60 (below rectangle support)
Risk: ~₹94.70 points
Strength: ⚡ Strong Bullish Momentum + High Volume + EMA Breakout
Demand Zone: ₹2,009 – ₹1,970 | SL: 1,968.60
📌 Note: Rectangle breakouts backed with volume tend to give quick moves. Traders should stay disciplined with SL.
________________________________________
🎯 Final Outlook
Kotak Mahindra Bank is attempting a bullish breakout from a rectangle consolidation zone. If the stock sustains above ₹2,020 with volumes, it could rally towards ₹2,120–₹2,150. However, failure to hold may drag it back inside the range.
________________________________________
💡 Learning Note: Rectangle patterns represent market indecision zones where buyers and sellers balance out. Breakouts with strong volume often indicate institutional participation, providing reliable trade setups.
________________________________________
⚠️ Disclosure & Disclaimer – Please Read Carefully
The information shared here is meant purely for learning and awareness. It is not a buy or sell recommendation and should not be taken as investment advice. I am not a SEBI-registered investment adviser, and all views expressed are based on personal study, chart patterns, and publicly available market data.
Trading—whether in stocks or options—carries risk. Markets can move unexpectedly, and losses can sometimes exceed the money you have invested. Past performance or past setups do not guarantee future results.
If you are a beginner, treat this as a guide to understand how the market works and practice on paper trades before risking real money. If you are experienced, always assess your own risk, position sizing, and strategy suitability before entering trades.
Consult a SEBI-registered financial adviser before making any real trading decision. By engaging with this content, you acknowledge full responsibility for your trades and investments.
💬 Found this useful?
🔼 Give this post a Boost to help more traders discover clean, structured learning.
✍️ Drop your thoughts, questions, or setups in the comments — let’s grow together!
🔁 Share with fellow traders and beginners to spread awareness.
👉 “If you liked this breakdown, follow for more clean, structured setups with discipline at the core.”
🚀 Stay Calm. Stay Clean. Trade With Patience.
Trade Smart | Learn Zones | Be Self-Reliant 📊
________________________________________

UJJIVANSFB - VCP Breakout in DTF Script: UJJIVANSFB
Key highlights: 💡⚡
📈 VCP Breakout in DTF
📈 Short consolidation below Resistance
📈 Volume spike seen during Breakout.
📈 MACD Bounce
📈 Can go for a swing trade
⚠️ Important: Always Exit the trade before any Event.
⚠️ Important: Always maintain your Risk:Reward Ratio as 1:2, with this RR, you only need a 33% win rate to Breakeven.
✅Like and follow to never miss a new idea!✅
Disclaimer: I am not SEBI Registered Advisor. My posts are purely for training and educational purposes.
Eat🍜 Sleep😴 TradingView📈 Repeat 🔁

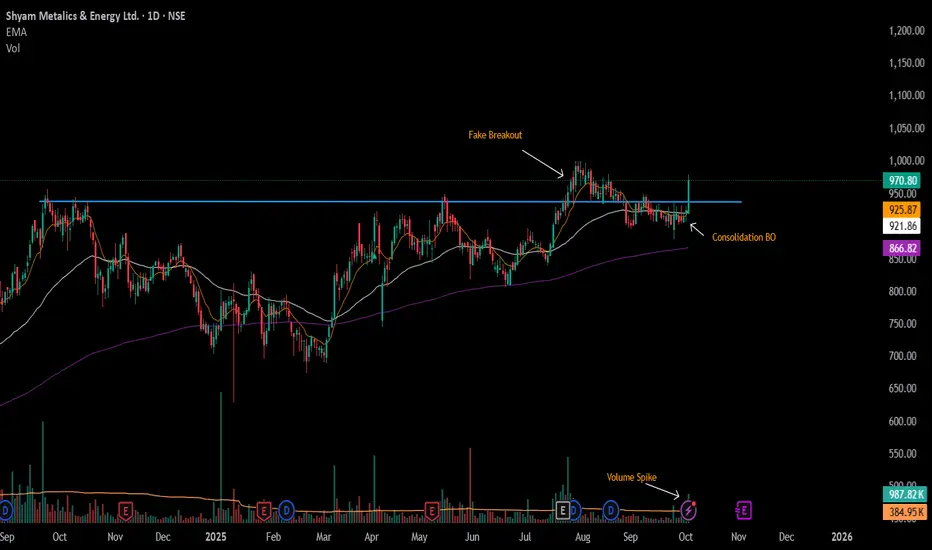
#SHYAMMETL - 2nd BreakOut in DTFScript: SHYAMMETL
Key highlights: 💡⚡
📈 VCP BreakOut in DTF which Failed
📈 2nd BreakOut in DTF after a short consolidation below Resistance
📈 Volume spike seen during Breakout.
📈 MACD Bounce
📈 Can go for a swing trade
⚠️ Important: Always Exit the trade before any Event.
⚠️ Important: Always maintain your Risk:Reward Ratio as 1:2, with this RR, you only need a 33% win rate to Breakeven.
✅Like and follow to never miss a new idea!✅
Disclaimer: I am not SEBI Registered Advisor. My posts are purely for training and educational purposes.
Eat🍜 Sleep😴 TradingView📈 Repeat 🔁
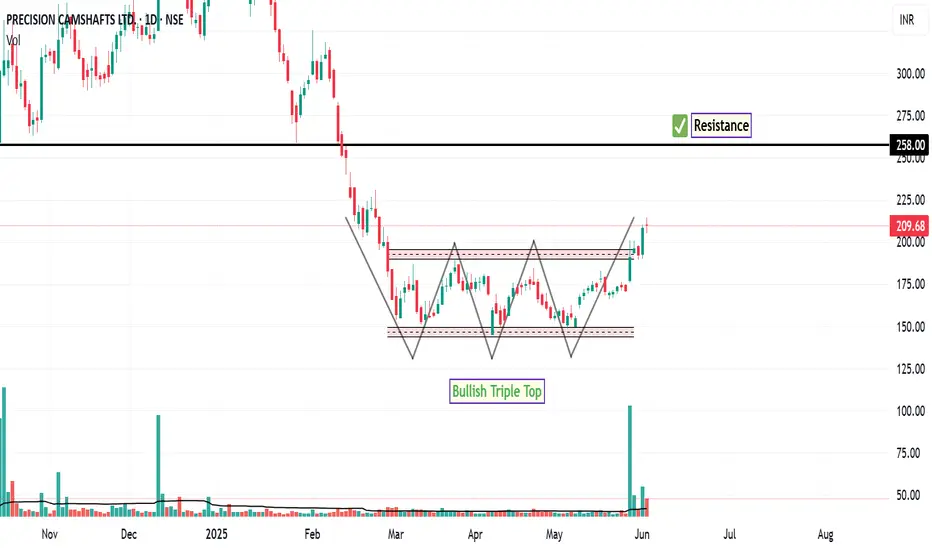
PRECAM: Next Level InsightThe daily chart of PRECAM is currently displaying a technically constructive setup. Notably, the price structure resembles a bullish triple top formation, which, in this context, appears to be acting as a continuation pattern rather than a reversal. This is further supported by a breakout above the recent consolidation range.
Importantly, this breakout has been accompanied by a noticeable increase in trading volume over the past five sessions, which may suggest growing market participation and interest in the stock at current levels.
Key technical indicators are aligned with this bullish momentum:
RSI is trading above the 70 mark , indicating strong upward momentum.
MACD is positioned above the zero line , with the signal line maintaining a positive crossover.
MACD Histogram remains in positive territory, reinforcing the prevailing bullish sentiment.
Based on this setup, the next potential area of price interest or resistance could emerge near the ₹258 level. On the downside, the immediate support lies just below the prior consolidation zone near ₹145 . A sustained move below this level could act as a technical invalidation point for short-term bullish setups and may prompt risk management actions.
Disclaimer:
This analysis is intended solely for informational and educational purposes. It does not constitute investment advice, a recommendation, or an offer to buy or sell any financial instrument. All investments carry risk, and past performance is not indicative of future results. Individuals should conduct their own due diligence or consult with a qualified financial advisor before making any investment decisions.
Silver Bullish Breakout on Monthly & Weekly CharPattern Formed: Symmetrical Triangle (Long-Term Consolidation)
Breakout Type: Bullish Breakout on Monthly & Weekly Chart
Volume Confirmation: Strength in breakout with price expansion
Measured Move Target: ~$44 (based on triangle height projection)
Immediate Resistance Zone: $44.11 (Historical supply zone)
Support Levels Post-Breakout:
Immediate Support: $34.78
Strong Support: $33.28
