Part 1 Support and Resistance Bear Put Spread – Low Cost Bearish Trade
Market View: Moderately bearish
How it Works:
Buy ATM/ITM put
Sell lower strike put
Cheap alternative to buying a naked put
Iron Condor – Sideways Market Strategy
Market View: Neutral/Range-bound
How it Works:
Sell OTM call spread
Sell OTM put spread
Collect premium from both sides
Profit in a non-trending market
Best For:
Market consolidation
Expiry day premium decay
Contains image

Option Trading Strategies Covered Call – Income Strategy
Market View: Moderately bullish
How it Works:
You hold shares of a stock.
You sell a call option on those shares.
You earn premium as profit.
Best For:
Generating fixed income in a sideways/bullish market.
Low-risk traders.
Risk: Stock may get “assigned” if it crosses strike price.

Part 2 Master Candlestick PatternBull Call Spread – Low Cost Bullish Trade
Market View: Moderately bullish
How it Works:
Buy ATM/ITM call
Sell higher strike call
Reduces cost + reduces risk
Best For:
Controlled bullish trades
Trending markets
Bear Put Spread – Low Cost Bearish Trade
Market View: Moderately bearish
How it Works:
Buy ATM/ITM put
Sell lower strike put
Cheap alternative to buying a naked put

Part 1 Master Candlestick PatternCash-Secured Put – Buying Stock at Discount
Market View: Moderately bearish
How it Works:
You sell a put option by keeping cash aside.
If stock falls, you buy it at lower (strike) price.
If stock stays above strike, you keep the premium.
Best For:
Investors wanting stock at a discount.
Very safe strategy.

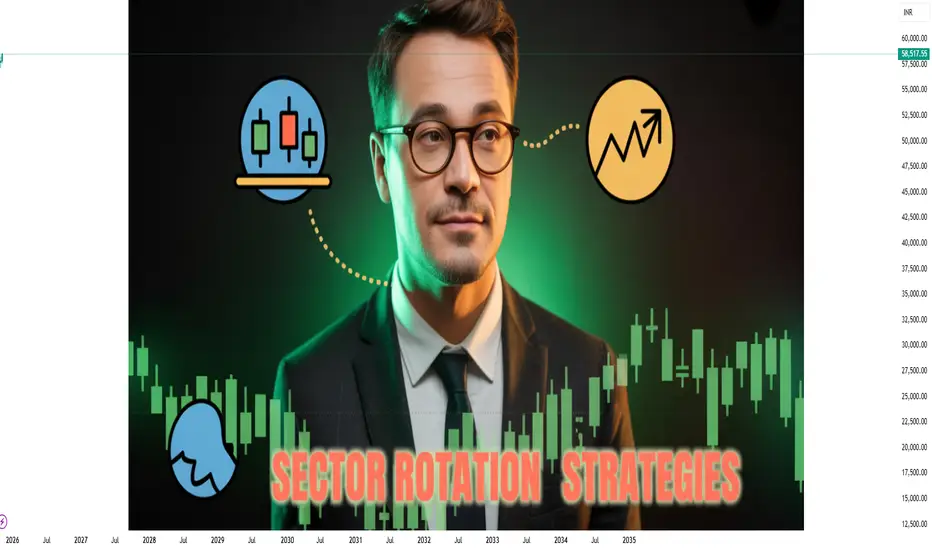
Sector Rotation StrategiesWhat Is Sector Rotation?
Sector rotation refers to the practice of shifting investments from one sector of the economy to another based on changing market conditions, economic cycles, and investor sentiment. Markets do not move uniformly—some areas outperform during economic expansion, others during contraction. For example:
When the economy is booming, cyclical sectors like automobiles, metals, real estate, and banks outperform.
When the economy slows, investors prefer defensive sectors like FMCG, healthcare, utilities, and IT services.
The core idea is: follow where the money is flowing, not where prices have already rallied.
Why Sector Rotation Works
Sector rotation is rooted in behavioral finance and macroeconomics. Institutional investors—mutual funds, FIIs, pension funds—allocate capital to sectors depending on their outlook for earnings growth, interest rates, inflation, and liquidity. As they rotate capital:
Strong sectors get stronger due to inflows.
Weak sectors remain weak or lag behind.
Retail traders often enter at the end of a rally, but sector rotation strategies allow you to anticipate moves earlier because sector performance leads stock performance.
The Business Cycle & Sector Rotation
To understand sector rotation, you must understand the economic cycle, which typically moves through five stages:
1. Early Recovery Phase
Interest rates remain low.
Liquidity is high.
Consumer and business spending picks up.
Outperforming sectors:
Automobiles
Banks & Financials
Real Estate
Capital Goods
Reason: These sectors are sensitive to credit, growth, and consumer spending.
2. Mid-Cycle Expansion
Economy grows at a stable pace.
Corporate earnings rise.
Market sentiment is positive.
Winning sectors:
Metals & Mining
Industrials
Technology
Infrastructure
Mid-cap and small-cap stocks
Reason: Companies expand operations and capex increases.
3. Late Cycle
Inflation increases.
Interest rates begin rising.
Market becomes volatile.
Strong performers:
Energy (Oil & Gas)
Commodities
Power
PSU sectors
Reason: Prices of energy and commodities improve due to inflation and supply constraints.
4. Recession / Slowdown
GDP weakens.
Spending slows.
Markets correct sharply.
Defensive sectors shine:
FMCG
Healthcare / Pharma
Utilities (Power, Gas Distribution)
Consumer Staples
Reason: Demand for essentials remains stable even in downturns.
5. Early Recovery Again
Cycle starts again as central banks cut rates and liquidity returns.
Indian Market Examples
Sector rotation plays out very visibly in India:
When RBI cuts rates → Banks, Realty, Autos rally first.
When inflation rises → FMCG, Pharma outperform.
When global commodity prices spike → Metals, Oil & Gas surge.
During IT outsourcing demand booms → Nifty IT becomes a leader.
When the government pushes capex → Infrastructure & PSU stocks take off.
For example:
In 2020-21, IT and Pharma led the rally after COVID.
In 2022, Metals and PSU banks outperformed due to global inflation.
In 2023-24, Railways and Defence were the strongest due to government spending.
In 2024-25, Financials and Energy gained leadership.
Sector rotation keeps happening because no sector leads forever.
Tools Used for Sector Rotation Analysis
1. Relative Strength (RS)
Compare performance of one sector vs Nifty 50.
If RS > 0 → sector outperforming
If RS < 0 → sector lagging
Traders often use:
Ratio charts (NIFTYSECTOR / NIFTY50)
RRG charts (Relative Rotation Graphs)
2. Price Action & Breakouts
Sectors forming:
Higher highs–higher lows
Breakouts on weekly charts
Often start outperforming for months.
3. Volume Profile
You track:
Institutional accumulation zones
High volume nodes
Breakout volumes
Sector rotation shows up as big volume shifts from one sector to another.
4. Market Breadth
Number of advancing stocks vs declining stocks in a sector helps identify internal strength before price rally starts.
Top Practical Sector Rotation Strategies
Strategy 1: Follow Market Cycles
Identify if India is in:
Expansion
Peak
Slowdown
Recovery
Then pick sectors accordingly.
This is the classic macro-driven approach.
Strategy 2: Follow Institutional Flows
Monitor:
FII sectoral holdings
Mutual fund monthly fact sheets
Volume increase in sectoral indices
If institutions are buying a sector for 3–4 months continuously, a long-term trend is beginning.
Strategy 3: Ratio Chart Method
Daily or weekly ratio charts give very clear guidance.
Example:
NIFTYBANK / NIFTY50 rising → banks leading
CNXIT / NIFTY50 rising → IT leadership pattern
If the ratio chart breaks out → shift capital to that sector.
Strategy 4: Top-Down Approach
A professional hedge-fund style method:
Analyze global macro trends
Identify strong Indian sectors
Select top stocks inside those sectors
Enter on pullbacks or breakouts
This avoids random stock picking and aligns you with the strongest flows.
Strategy 5: Rotation Within the Cycle
Within major rotations, micro rotations happen too.
Example:
Inside defensive rotation:
First FMCG moves
Then Pharma
Then Utilities
Inside growth rotation:
First Banks
Then Autos
Then Realty
Each mini-rotation gives trading opportunities.
Strategy 6: Quarterly Earnings Based Rotation
Before and after results, money flows into sectors expected to report strong earnings.
For example:
IT moves during Q1
Banks move during Q3
FMCG moves during Q4
Earnings cycles and sector cycles often overlap and strengthen each other.
Strategy 7: Event-Driven Rotation
Based on news, policy or global events:
Crude oil rising → Energy & refining sector improves
Govt budget focus on capex → Infra & PSU rally
Rupee weakening → IT & Pharma benefit
Fed rate cuts → Financials & Realty boom
Events accelerate sector rotation speed.
Common Mistakes in Sector Rotation Trading
1. Entering After the Rally Is Over
If a sector has already given:
20–30% weekly move
4–5 months leadership
It may soon rotate out.
2. Ignoring Macro Signals
Traders who only watch charts miss the bigger picture. Macro trends drive rotations.
3. Chasing Too Many Sectors
Focus on 2–3 sectors at a time. Too many sectors dilute capital and attention.
4. Confusing Short-Term Noise With Rotation
Rotation is visible on weekly time frames, not intraday.
Benefits of Sector Rotation
Helps avoid underperforming areas
Aligns with institutional money
Reduces risk as you stay with strong sectors
Improves probability of capturing long-swing trends
Eliminates guesswork in stock picking
Provides a structured approach
In short: sector rotation keeps you on the right side of the market.
Final Thoughts
Sector rotation is not a prediction strategy—it is an observation strategy. You observe where money is flowing and position yourself accordingly. In Indian markets, sector leadership changes every 3–12 months, creating repeated opportunities for informed traders. By combining macro analysis, volume profile, price action, and ratio charts, you can build a robust rotation-based trading framework that works across market cycles.
Hedging with GoldWhy Gold Works as a Hedge
Gold’s hedging power comes from a few fundamental characteristics that have not changed for hundreds of years:
Limited Supply – Gold cannot be printed like currency. Central banks cannot create gold, so its value is less influenced by inflationary policies.
Universal Acceptance – Every country accepts gold as real value. It works beyond borders, politics, and currency systems.
Safe-Haven Asset – When global markets face uncertainty—war, recession, market crashes—investors run towards gold.
Anti-Inflation Characteristics – When inflation rises, the purchasing power of money falls, but gold usually appreciates.
Low Correlation with Equity Markets – When equities fall, gold often stabilizes or rises, making it a natural hedge.
These traits make gold a protective shield in a diversified investment or trading portfolio.
Types of Risks You Can Hedge Using Gold
1. Hedging Against Inflation
Inflation erodes the value of currency over time. Historically, gold prices rise when inflation goes up because currencies weaken.
Example: If inflation in India rises due to rising oil prices or currency depreciation, gold prices often rise in INR.
Investors use gold to preserve their purchasing power.
2. Hedging Against Currency Risk
Gold is priced globally in USD. For countries like India, gold becomes expensive when:
USD strengthens
INR weakens
Thus, gold acts as a hedge against domestic currency depreciation.
3. Hedging Against Equity Market Volatility
When stock markets fall sharply, gold generally rises or stays stable. This negative correlation helps protect portfolios.
Example: During global shocks like lockdowns, wars, or economic crises, investors move from risky assets to gold.
4. Hedging Against Geopolitical Risk
Gold reacts instantly to geopolitical uncertainty such as:
War threats
Diplomatic tensions
Oil supply disruptions
Global sanctions
When these events surface, gold becomes a safe refuge.
5. Hedging Systemic and Financial Risks
Gold holds value even when:
Banks collapse
Bond yields spike
Cryptocurrencies crash
Interest rates change
Therefore, gold is used by central banks and hedge funds as an “insurance asset.”
How to Hedge with Gold – Practical Methods
1. Physical Gold
Traditional but effective.
Gold bars
Coins
Jewellery (not efficient due to making charges)
Pros:
Tangible, no counterparty risk
Cons:
Storage, purity, liquidity issues
Best for: Long-term hedging and wealth preservation.
2. Gold ETFs (Exchange Traded Funds)
Most popular hedging tool for stock market investors.
Why they’re effective:
Easily tradable on NSE/BSE
Backed by physical gold
No storage issues
Example: Buying Gold ETF when expecting market volatility or inflationary pressure.
3. Sovereign Gold Bonds (SGBs)
Issued by RBI, these are ideal for medium-long term hedging.
Benefits:
2.5% annual interest
No storage issue
Tax-free on redemption after maturity
SGBs hedge inflation and currency risks while earning returns.
4. Gold Futures (MCX)
For traders, MCX gold futures are the most flexible hedge.
Uses:
Hedge short-term trading volatility
Lock buying/selling prices
Protect equity positions
Example:
If you are long in equities and expect a global shock, you can hedge by buying gold futures.
5. Gold Options
Options on gold, available on MCX, allow hedging using limited risk.
Example:
Buy Call option on gold → hedge against rising inflation/geopolitical risk
Buy Put option on gold → hedge against falling gold prices
Portfolio Hedging Strategies Using Gold
1. 10–15% Allocation Strategy
Most global experts recommend allocating 10% to 15% of a portfolio to gold to hedge against macro-economic risks.
Stable long-term return
Smoothens volatility
Acts as insurance during market crashes
Example allocation:
70% equity + 20% debt + 10% gold
2. Hedge When VIX Spikes
When volatility index (India VIX) rises sharply:
Markets become unstable
Investors flee to safety
Gold absorbs fear-driven flows
Traders use gold futures/options during VIX spikes to protect equity positions.
3. Dollar-Cost Averaging (DCA) in Gold
Instead of buying gold at once, accumulate slowly.
Reduces timing risk
Works during inflation cycles
Smoothens price fluctuations
Ideal for ETFs or SGBs.
4. Gold as a Hedge During Rate Cycle Changes
When central banks cut interest rates:
Gold rises (because opportunity cost drops)
When central banks raise rates:
Gold slows down, but still holds for hedging
Understanding rate cycles helps time your hedge better.
When You MUST Hedge with Gold
1. Rising Inflation Trend
If CPI inflation moves up consistently, gold becomes essential.
2. Weakening Rupee
When INR falls beyond 83–85 levels, gold prices rise quickly in India.
3. Global Recession Fears
In recessionary conditions:
Equities fall
Bond yields drop
Investors shift to gold
4. When Oil Prices Spike
Historically, oil and gold move together during crises:
higher oil = higher inflation = higher gold
5. Major Geopolitical Tensions
Wars, sanctions, Middle-East disruptions, or supply chain risks push gold higher.
Advantages of Gold as a Hedge
✔ Consistent Performance across decades
✔ Liquidity – easily traded
✔ Crisis-proof asset
✔ Acts as insurance for portfolios
✔ Balances equity risk
✔ Low correlation with other asset classes
✔ Effective against inflation and currency depreciation
Limitations of Hedging with Gold
⚠ No dividends or corporate earnings
⚠ Gold can go sideways for long periods
⚠ Short-term volatility exists
⚠ Futures require margin and skill
Gold is best used as a hedge, not as the only investment.
Conclusion
Hedging with gold is one of the oldest and most reliable risk-management strategies in financial markets. Whether it’s inflation risk, market volatility, geopolitical uncertainty, or currency depreciation, gold acts as a protective layer around your portfolio. For traders, gold provides a negative correlation hedge during equity market turbulence. For investors, gold safeguards long-term wealth and future purchasing power. In modern markets where data, algorithms, and AI influence every price move, gold remains a timeless asset—quiet, powerful, and consistent as a hedge.
India’s Market Surge1. Strong Domestic Economic Growth
The backbone of India’s market rally is its robust and consistent economic growth. India remains the fastest-growing major economy, with GDP growth often staying in the 6–7.5% range, even when global economies struggle with recession fears.
Key factors boosting economic momentum include:
High domestic consumption (India is a consumption-driven economy)
Strong government capital expenditure, especially in infrastructure
Rising manufacturing activity, supported by PLI schemes
Improving rural demand and financial inclusion
This economy-market alignment builds investor confidence that the expansion is backed by real economic progress, not just speculative money flow.
2. Consistent FII and Strong DII Participation
In previous market cycles, India heavily depended on Foreign Institutional Investors (FIIs). But the recent surge shows the strength of domestic investors:
Domestic Institutional Investors (DIIs)
Mutual funds, SIPs, and pension funds are investing record amounts every month.
Monthly SIP inflows crossing new highs build a stable, continuous support for equities.
Foreign Institutional Investors (FIIs)
FIIs have returned strongly due to India’s improving macro stability.
Compared to China, many FIIs see India as a safer, higher-growth, long-term bet.
This dual inflow dynamic creates a powerful liquidity engine that keeps markets supported even during short-term corrections.
3. Corporate Profit Boom
One of the most underestimated drivers is India’s corporate profit cycle.
Corporate profits as a percentage of GDP have hit multi-year highs.
Banks and financials are reporting record profits due to low NPAs and higher credit growth.
Manufacturing, IT, auto, and capital goods sectors are showing both volume growth and margin improvement.
When earnings grow consistently, markets rise not just because of sentiment—but because fundamentals justify higher valuations.
4. Government’s Long-Term Policy Stability
Policy continuity has played a major role in boosting investor confidence.
Important policy drivers:
GST stabilizing over time
Digitization and UPI-driven fintech boom
PLI schemes encouraging manufacturing expansion
Infrastructure push: roads, railways, logistics corridors
Make-in-India & Atmanirbhar Bharat initiatives
Clear, predictable policy frameworks attract both domestic and global investors who prefer stable emerging markets.
5. India’s Rising Global Preference vs China
A major geopolitical shift is happening:
Global investors are rebalancing away from China and moving to India.
Reasons include:
Better political stability
Fewer regulatory uncertainties
High-quality corporate governance
Massive demographic advantage
A growing middle-class consumption engine
India is being viewed as the next global growth leader, not just an emerging market. This perception shift alone adds premium valuations to Indian equities.
6. Middle-Class Expansion and Financialization of Savings
India’s middle class is growing rapidly, and with it, the financialization trend:
More people opening Demat accounts
SIP participation rising steadily
Increasing awareness of equity markets
Young investors entering trading and investing
This broad-based participation provides long-term depth and resilience to the markets—even during global volatility.
7. Sectoral Supercycles Fueling the Rally
Several sectors are experiencing their own mini supercycles:
a) Banking & Financials
Strong credit growth
Lower NPAs
Improved capital adequacy
Better provisioning
b) Capital Goods & Infrastructure
High order books
Massive government capex
Private capex revival
c) Auto & EV-related industries
Strong sales across passenger/2-wheeler/commercial vehicles
EV ecosystem development
d) Defence & PSU Stocks
Higher orders
Strategic focus on self-reliance
Market sentiment turning positive towards PSUs
e) New-Age & Tech Companies
Improved profitability
Better cash flows
More mature valuations
This multi-sector momentum gives the market a broader base, making the rally durable.
8. Stability in Inflation and Interest Rates
India has managed to maintain relatively stable inflation compared to many countries hit by energy crises, geopolitical tensions, or currency volatility.
RBI’s strict monetary policy helped keep inflation in control.
Rupee stability protects India from imported inflation.
Lower commodity prices benefit India’s manufacturing base.
Stable inflation and controlled borrowing costs help companies expand without pressure on margins.
9. Strong Global Positioning and Favourable Demographics
India’s demographic advantages will drive its markets for decades:
Average age around 29 years
Growing skilled workforce
Urbanization increasing yearly
Digital adoption growing at the fastest pace worldwide
Investors see India as a long-term compounding story rather than a short-term trade.
10. The Sentiment Factor: Confidence is at a Multi-Year High
Market cycles are also influenced by emotions—fear, greed, confidence, uncertainty.
Right now, India is riding on:
High confidence in government
Strong consumer sentiment
Optimistic business outlook
Healthy global reputation
This sentiment acts as the fuel that keeps the rally alive even during global shocks.
Is the Surge Sustainable?
While short corrections will always come, the long-term structure of India’s market rally remains strong due to:
Strong macroeconomic foundation
Corporate earnings visibility
Global capital preference
Domestic investor strength
Multi-sector growth
However, investors should be aware of valuations, especially in midcaps and smallcaps, which may see periodic cooling-off phases.
Conclusion
India’s market surge is not a temporary excitement—it is the result of strong fundamentals, stable policies, global shifts, and rising domestic participation. As the country transitions into a global economic powerhouse, its stock markets are reflecting this journey through steady, multi-layered growth. The next decade is expected to be one of the most promising periods for Indian equities, supported by structural transformation, digitization, manufacturing expansion, and a confident investor base.

AI Trading Secrets and the Indian Psychology Trading Era1. The Rise of AI Trading: Invisible Machines Behind Every Move
AI trading refers to the use of machine learning models, predictive algorithms, neural networks, and automation to make trading decisions. These systems process data far beyond human capability — from price movements and volatility to sentiment and macro signals. The real secret of AI trading is that it doesn’t just “see data”; it learns from historical patterns and adapts to real-time conditions.
AI Trading Secret #1: Feature Engineering Is More Important Than Models
Most people think AI magic lies in fancy models. But in reality, the quality of input data (“features”) determines how good the prediction is. Smart AI traders know how to extract features like:
Volume clusters
Volatility squeeze signals
Order book buildup
High-frequency momentum micro-patterns
These allow AI systems to predict not the “future market”, but the probability of short-term moves.
AI Trading Secret #2: AI Does Not Predict — It Works on Probability Mapping
AI systems calculate probability zones. For example:
68% probability: NIFTY may stay within a certain band
55% probability: a breakout may occur
72% probability: volume expansion confirms momentum
This probabilistic thinking makes AI far more disciplined and emotion-free compared to human traders.
AI Trading Secret #3: Alternative Data Is the True Edge
Modern AI traders are not limited to charts. They read “unseen data,” including:
Social media sentiment
Google Trends
WhatsApp retail buzz
FII/DII trading micro-behaviour
Global ETF flow patterns
Options chain clustering
This alternative data gives AI a big advantage — early detection of shifts that humans take hours or days to notice.
AI Trading Secret #4: Automation Protects You From Human Weakness
AI never:
Overtrades
Gets greedy
Averages blindly
Seeks revenge trades
Breaks rules
This discipline alone gives AI traders a massive edge.
AI Trading Secret #5: AI’s Final Power — Backtesting + Optimization
AI systems test thousands of scenarios:
Different stop losses
Different entries/exits
Different indicators
Different position sizing rules
This creates strategies that are mathematically optimized rather than emotionally guessed.
2. Indian Psychology Trading Era: A New Mindset Born After 2020
India has seen a trading revolution after COVID. Nearly 10+ crore retail traders entered the market. But what makes Indian trading psychology unique?
2A. India’s Retail Trader Behaviour: Emotional Yet Evolving
Indian traders historically operated on:
Tips
WhatsApp calls
Penny stocks
Rumours
Overconfidence
But after 2020, a shift began — more awareness, YouTube learning, Algo tools, and community learning transformed the mindset.
Psychology Trend #1: Hope-Based Trading to Data-Based Trading
Earlier:
People traded based on “feeling Nifty will go up.”
Now:
People analyse:
OI data
PCR
Volume profile
Institutional flow
This marks the birth of the Indian Data-Driven Retail Era.
Psychology Trend #2: From Heroic Trading to Systematic Trading
Earlier:
“Bhai, full margin laga do, kal upper circuit jayega!”
Now:
Traders prefer:
Swing + risk-reward
Stop-loss
Algo automation
Hedged option strategies
The ego of “catching tops and bottoms” is slowly dying.
Psychology Trend #3: Options Mania Changed Behaviour
Indians love leverage. Options gave them:
Low capital
High ROI possibility
Fast trading cycles
This created both growth and chaos. But now traders are learning:
Sell-side edges
Premium decay
IV crush
Weekly expiry psychology
This learning curve is transforming the Indian retail community into a more sophisticated force.
3. Blending AI With Indian Psychology: The New Era of Smart Retail
This is where the magic happens. When AI meets Indian trading psychology, three powerful shifts occur:
Shift #1: AI Reduces Emotional Mistakes of Indian Traders
Indian traders struggle with:
Fear of missing out (FOMO)
Holding losers
Exiting winners early
Overtrading for “thrill”
AI solves these with:
Rule-based systems
Automatic execution
Pre-fixed risk management
Objective signals
Disciplined execution removes 80% emotional damage.
Shift #2: Indian Traders Bring Intuition AI Cannot See
AI understands data, but not “political sentiment,” budget buzz, or Indian-style retail behaviour. Indian traders understand:
Election season moves
Dubbed “operator activity”
Midcap burst cycles
Sectoral rotations
Market mood swings
This intuition plus AI’s objectivity creates the perfect trading duo.
Shift #3: The Rise of Hybrid Systems in India
This is the future:
A blend of human analysis + AI execution.
Example workflow:
Trader analyses volume profile + market structure
AI system generates probability zones
Human selects scenario
AI trades automatically
This hybrid edge will dominate the Indian markets in coming years.
4. Biggest Psychological Barriers Indian Traders Must Break
To fully enter the AI + psychology era, Indian traders must overcome:
Barrier 1: Overconfidence Bias
Thinking “I know the market” instead of “market can do anything.”
Barrier 2: Tip Addiction
Relying on outside voices instead of system-based confidence.
Barrier 3: Quick-Rich Fantasy
Expecting to make 50,000/day with 10,000 capital.
Barrier 4: Revenge Trading
Trying to “win back” lost money emotionally.
Barrier 5: Impulse Trading
Taking a trade because the candle “looked good.”
AI erases most of these — if traders let the system work.
5. What the Future Looks Like
India is entering a very powerful trading era:
AI will handle execution
Humans will handle market structure
Psychology will be increasingly coded into systems
More retail traders will use algos
Market will become more competitive
Only disciplined + data-driven traders will survive
The ones who stay in the game the longest will be those who embrace AI discipline + Indian intuition.

The Herd Mentality – Why Everyone Buys When It’s Too Late?Hello Traders!
You’ve seen it a hundred times, the market rallies, social media explodes, and suddenly everyone starts buying.
Then, just when retail traders feel “safe” entering, the price crashes.
It’s not bad luck, it’s herd mentality .
And unless you understand how it works, you’ll keep following the crowd straight into losses.
1. What is Herd Mentality in Trading?
Herd mentality is the instinct to do what everyone else is doing, buying when others buy, selling when others sell.
It’s rooted in human psychology, our brains feel safer when we’re part of a group.
In trading, this instinct is deadly because the crowd always reacts late.
When you feel comfortable entering a trade, it’s usually because the market has already moved.
2. The Cycle of Fear and Greed
Every bull run begins with a few smart traders who buy quietly when no one’s interested.
As prices rise, social media hype builds, the crowd starts joining in.
Then, when “everyone” is talking about the coin, smart money exits, leaving the herd trapped at the top.
The same happens in bear markets, panic selling at bottoms while professionals buy patiently.
It’s not about intelligence, it’s about emotion.
3. How the Market Exploits the Crowd
Institutions and big traders understand herd behavior better than anyone.
They create liquidity by pushing prices to levels where retail traders feel emotionally forced to act.
The market uses human nature, fear and greed, as its fuel.
The crowd provides the liquidity, and professionals use that liquidity to enter or exit quietly.
4. How to Avoid Becoming Part of the Herd
Develop your own plan, if your entry depends on others’ excitement, it’s not your setup.
Buy when the market feels uncomfortable; sell when everyone feels confident.
Learn to think independently. The best trades usually feel the hardest to take.
Patience and conviction are your weapons against the herd.
5. The Truth Most Traders Don’t Want to Hear
If you wait for social proof to feel confident, you’ll always be late.
By the time the crowd “believes,” the move is already priced in.
You don’t get rich by following others, you get rich by understanding why others behave the way they do.
Rahul’s Tip:
The market doesn’t punish retail traders because they lack knowledge, it punishes them because they act emotionally together.
Train your mind to do what’s uncomfortable, not what’s popular. That’s where the profit hides.
Conclusion:
The herd mentality is the silent killer of most portfolios.
The more people talk about an asset, the less opportunity it holds.
Smart traders buy silence and sell noise.
Once you learn to think independently, you’ll stop being the liquidity, and start trading like the ones who create it.
If this post opened your eyes to herd psychology, like it, share your view in comments, and follow for more deep market insights!
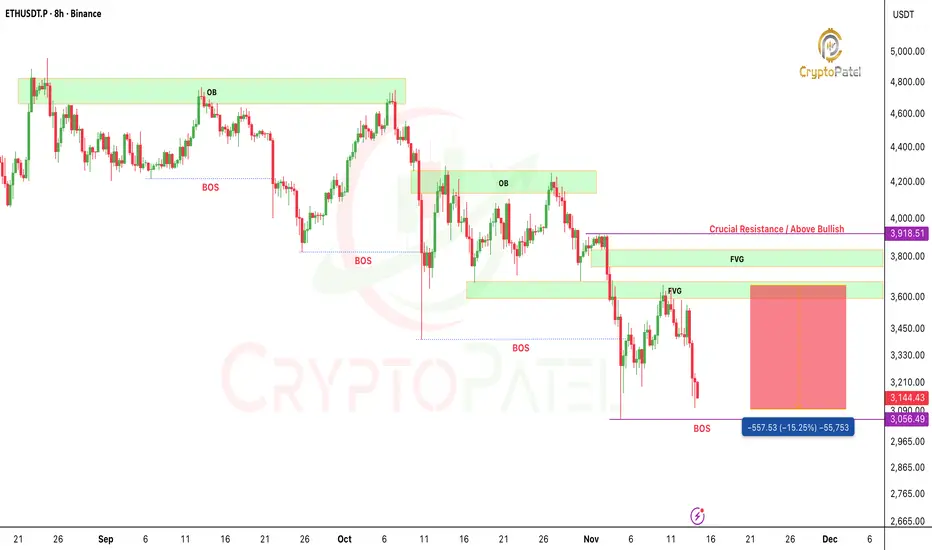
ETHEREUM Bearish Target achieved CRYPTOCAP:ETH has tapped the $3150–$3110 zone, a clean 15% move from our premium setup.
Perfect FVG fill + redistribution structure.
Huge profits for those who executed. Liquidity continues to lead.
NFA & DYOR
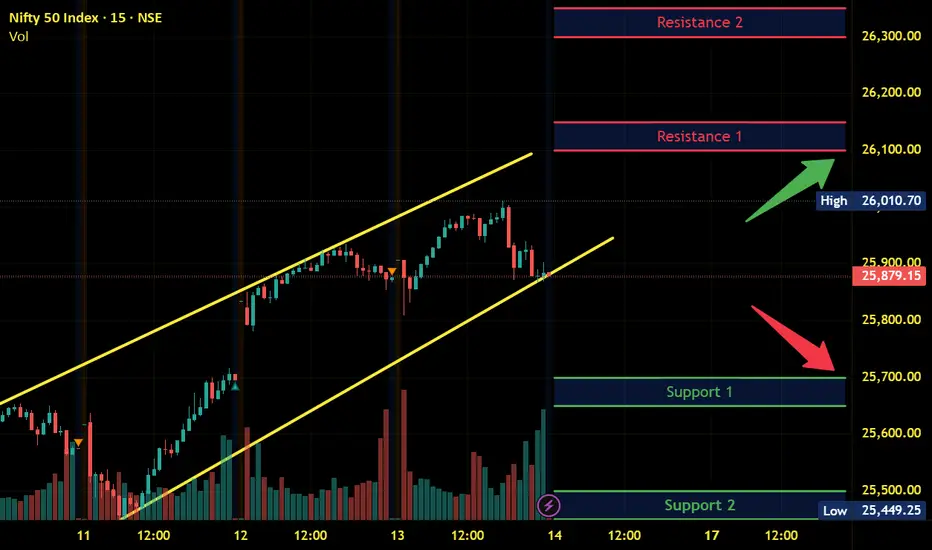
Nifty Intraday Analysis for 14th November 2025NSE:NIFTY
Index has resistance near 26100 – 26150 range and if index crosses and sustains above this level then may reach near 26300 – 26350 range.
Nifty has immediate support near 25700 – 25650 range and if this support is broken then index may tank near 25500 – 25550 range.
Divergence Secrets What Are Options?
An option is a financial contract that gives the buyer the right, but not the obligation, to buy or sell an underlying asset at a fixed price (called the strike price) on or before a certain date (called expiry). There are two types of options:
Call Option – gives the right to buy.
Put Option – gives the right to sell.
The person who buys an option pays a fee known as the premium. The seller (also called the option writer) receives this premium and has the obligation to carry out the contract if the buyer chooses to exercise it.

Part 2 Intraday Trading Master ClassWhy Option Trading Is Growing Rapidly in India
In recent years, India has seen an explosive rise in options trading due to:
Weekly expiries (more opportunity)
Low entry capital
High liquidity in BankNifty and Nifty options
Rise of online brokerages
Wide availability of market data and tools
Social media awareness
Because of the leverage and excitement options offer, many new traders are drawn to them—though disciplined ones survive longer.

Part 1 Intraday Trading Master ClassWho Wins More—Option Buyers or Sellers?
Option buyers have limited risk and unlimited reward, but their probability of success is lower because:
Time decay works against them.
They need strong directional movement within a short time.
Option sellers (writers) have limited profit but higher probability of winning because:
Time decay works in their favor.
Markets stay range-bound more often than they trend strongly.
Thus, professional traders often prefer option selling strategies like:
Iron condor
Straddle
Strangle
Credit spreads
Covered calls
Retail traders, on the other hand, prefer buying options due to lower capital requirements.

Learn Candle PatternsCandlestick patterns are one of the most important tools in technical analysis, used by traders around the world to understand market psychology, predict price movement, and identify buying or selling opportunities. Each candle on the chart tells a story—who is in control (bulls or bears), the strength of the price move, and the potential reversal or continuation of the trend. When combined into patterns, candlesticks offer powerful signals that help traders make better decisions.
A single candlestick is made of four data points: open, high, low, and close. The body represents the open-to-close range, while wicks (shadows) show the highs and lows. Bullish candles generally close above the open, and bearish candles close below the open. Understanding this basic structure is essential before analyzing patterns.
Candlestick patterns are broadly categorized into reversal patterns and continuation patterns. Reversal patterns indicate a potential change in trend, while continuation patterns suggest the existing trend is likely to continue. These patterns can be single-candle, double-candle, or multi-candle formations.

Premium Chart Patterns Chart patterns are one of the most powerful tools in technical analysis. They visually represent how price behaves over time and help traders understand market psychology, identify trend direction, and predict future price movements. Whether a trader is dealing with equities, commodities, currencies, or indices like NIFTY or BANKNIFTY, chart patterns offer high-probability setups for both intraday and positional trading.
At their core, chart patterns indicate market sentiment—fear, greed, indecision, accumulation, distribution, breakouts, or reversals. When repeated price behaviour forms recognizable shapes on a chart, traders can use them to anticipate the next move. These shapes emerge from support, resistance, trendlines, and consolidation zones.
Broadly, chart patterns are classified into three categories:
Reversal Patterns – Signal a trend reversal
Continuation Patterns – Indicate the trend will resume
Bilateral Patterns – Suggest breakout in either direction

Part 12 Trading Master Class With ExpertsRisk in Option Trading
Although options can be powerful, they carry risks:
1. For Option Buyers
Premium can become zero if market doesn’t move as expected.
Time decay works against buyers.
2. For Option Sellers
Potentially unlimited loss in selling naked calls or puts.
Require higher capital and margin.
3. Volatility Risk
Sudden drop in volatility can reduce premium even if direction is correct.
4. Liquidity Risk
Some strike prices have low liquidity, making entry/exit difficult.

Part 11 Trading Master Class With Experts Who Should Trade Options?
Options are suitable for:
Traders with directional view
Investors needing hedging
Income seekers using option selling
Advanced traders who understand Greeks
Beginners should start small, learn concepts deeply, and practice on charts before investing heavy capital.

Part 10 Trade Like Institutions Option Trading in the Real Market
In India, most retail traders use options for:
Intraday trading
Weekly expiry trades (especially Nifty & Bank Nifty)
Hedging equity positions
Short-term directional bets
The NSE options market is one of the world’s largest due to high liquidity.

Who Controls the Trade Market?1. Governments and National Policies
Governments are among the most significant influencers of global trade. They do not directly “control” the entire trade market but shape it through:
a. Trade Policies
Countries impose:
Tariffs
Import/export taxes
Quotas
Subsidies
Sanctions
These tools can encourage or restrict trade. For example, a country may impose tariffs on imported steel to protect its local steel industry, affecting global steel prices and trade flows.
b. Trade Agreements
Nations sign bilateral and multilateral agreements such as:
WTO Agreements
Regional trade blocs (EU, ASEAN, NAFTA/USMCA, MERCOSUR)
Free trade agreements (India–UAE CEPA, EU–Japan EPA)
Such agreements define tariff structures, market access, rules of origin, and dispute mechanisms. They create predictable trade environments that shape global flows.
c. Currency and Monetary Policy
Governments influence their currency through central banks, affecting:
Export competitiveness
Import costs
Balance of payments
For example, a weaker currency makes a country’s exports cheaper globally, increasing trade activity.
2. Central Banks and Interest Rate Policies
Central banks indirectly influence the trade market by controlling:
Interest rates
Foreign exchange reserves
Money supply
Inflation
These factors alter import/export demand, capital flows, and trade financing costs. The U.S. Federal Reserve, ECB, Bank of Japan, and People's Bank of China have an outsized influence because their currencies drive global trade settlements.
3. The World Trade Organization (WTO)
The WTO does not “control” trade but regulates and oversees the global trading system. It:
Sets rules for fair trade
Resolves trade disputes
Ensures nondiscriminatory trade practices
Manages global tariff schedules
When trade conflicts arise—such as U.S.–China tariff disputes—WTO rulings influence the direction of global commerce.
4. Global Corporations and Multinational Companies
Large corporations have enormous power over global trade because they operate massive supply chains that span continents. This includes:
Tech giants like Apple, Samsung, and TSMC
Automotive leaders like Toyota, Volkswagen, and Tesla
Energy majors like ExxonMobil, Saudi Aramco, BP
Retail giants like Amazon, Walmart
These companies determine:
Where factories are located
What resources are needed
How goods move across borders
Because of their sheer scale, multinational companies influence labor markets, commodity demand, transportation networks, and global logistics.
5. Commodity Exchanges and Financial Markets
International exchanges play a key role in price discovery. Examples include:
Chicago Mercantile Exchange (CME) – agriculture, energy, metals
London Metal Exchange (LME) – base metals
New York Stock Exchange (NYSE) – equities
ICE – energy, sugar, cotton
These exchanges:
Set global benchmark prices
Facilitate futures and options trading
Provide hedging tools for buyers and sellers
Thus, financial traders and institutions heavily influence short-term market movements, especially in oil, gold, crops, and currencies.
6. Banks and Financial Institutions
Trade requires financing. Large banks such as:
JPMorgan
HSBC
Citi
Deutsche Bank
Standard Chartered
provide:
Letters of credit
Trade loans
Forex settlement
Risk management tools
Without these institutions, global trade would slow dramatically, especially for developing economies.
7. Geopolitical Powers and Global Politics
Political decisions deeply affect trade. The world’s major power centers—the U.S., China, EU, India, Japan, Russia—shape trade through:
Economic alliances
Trade warfare (tariffs, sanctions)
Military presence near trade routes
Resource control
Investment in foreign infrastructure
Geopolitical tensions such as the Russia–Ukraine war, South China Sea disputes, or Middle Eastern conflicts often disrupt supply chains, shipping lanes, and commodity prices.
8. Cartels and Organized Commodity Groups
Some commodities are influenced by producer groups or cartels. The most powerful example is:
OPEC
The Organization of the Petroleum Exporting Countries coordinates oil production to influence global oil prices.
Although they do not fully control the oil market, their decisions strongly impact:
Crude supply
Energy prices
Inflation globally
Other organized groups exist in diamonds, copper, and certain agricultural sectors, but none are as influential as OPEC.
9. Supply Chain and Logistics Networks
Trade physically moves through:
Shipping companies
Port authorities
Airlines
Freight forwarders
Rail networks
Global shipping giants like Maersk, MSC, and COSCO operate vast fleets and control a significant portion of global container movement. Congestion at a major port can affect trade worldwide.
10. Digital Platforms, E-Commerce, and Technology
In the 21st century, platforms such as Alibaba, Amazon, and Shopify influence global trade patterns by enabling cross-border commerce at scale.
Additionally, digital tools like:
AI forecasting
Blockchain-based trade finance
Real-time logistics tracking
Mobile payments
have increased trade efficiency and reduced barriers.
11. Consumers and Market Demand
Ultimately, consumer behavior controls the direction of trade. Their preferences shape:
What goods are produced
Where they are sourced
How companies market products
For example:
Rising demand for electric vehicles increases global trade in lithium, cobalt, and battery components.
Demand for fast fashion drives textile imports and exports.
Consumers collectively act as a “silent controller” of trade.
12. Conclusion — A System, Not a Single Controller
The trade market is not controlled by any one entity. Instead, it operates as a dynamic ecosystem shaped by:
Governments
Corporations
Financial markets
Regulators
Central banks
Geopolitical forces
Supply chain networks
Consumers
F&O (Futures and Options) Trading1. What Are Derivatives?
Futures and Options are derivative instruments, meaning their value is derived from an underlying asset. This underlying can be:
Stocks
Indices (NIFTY, BANKNIFTY)
Commodities
Currencies
The underlying’s price movement directly influences the F&O contract.
2. What Are Futures Contracts?
A Futures contract is an agreement to buy or sell an asset at a predetermined price on a specific future date. Both parties are obligated to fulfill the contract.
Key Features of Futures
Obligation: Buyer must buy, seller must sell.
Standardized: Lot size, expiry date, and price movement rules are fixed by the exchange.
Margin Required: Traders don’t pay full contract value; they pay a margin (~10–20%), which offers leverage.
Daily MTM: Profits or losses are settled daily through Mark-to-Market.
Example
If you buy NIFTY Futures at 22,000 and NIFTY rises to 22,200, you gain 200 points × lot size.
If NIFTY falls, you face losses.
Where Futures Are Used
Speculation: To profit from price movements
Hedging: To protect portfolios from adverse market moves
Arbitrage: To profit from price differences between spot and futures markets
Futures are powerful but risky due to high leverage.
3. What Are Options?
An Option is a contract that gives the buyer the right, but not the obligation*, to buy or sell an underlying asset at a specific price before (or on) expiry.
Two Types of Options
Call Option (CE) – Right to buy
Put Option (PE) – Right to sell
Two Sides of Options
Buyer (Holder): Pays premium, risk limited
Seller (Writer): Receives premium, risk can be unlimited
Strike Price
The price at which you may buy or sell the underlying.
Premium
The price paid by option buyers.
4. How Option Buyers Make Money
Call Buyer
Profits when underlying price goes above strike price + premium.
Put Buyer
Profits when underlying price goes below strike price – premium.
Buyers have limited loss (premium) and unlimited profit potential.
5. How Option Sellers Make Money
Sellers receive the premium upfront.
They profit when:
Price does not move beyond breakeven
Option expires worthless
Time decay eats option value
But sellers face unlimited loss risk, especially in naked selling.
That’s why option selling must be done with proper hedging and risk management.
6. Expiry and Settlement
F&O contracts expire on:
Weekly expiry: Every Thursday (Index options)
Monthly expiry: Last Thursday of every month
After expiry, contracts settle based on closing prices of the underlying.
7. Margin and Leverage
Futures require margin to control large positions.
Example:
NIFTY lot size: 50
NIFTY at 22,000 → Contract Value = 11,00,000
Margin required ≈ ₹1,40,000
This leverage amplifies gains and losses.
Options buyers pay only the premium, no margin.
Options sellers must pay heavy margins because of high risk.
8. Why Traders Use F&O?
A. Hedging
Investors use F&O to protect their portfolios.
Example:
If you own Reliance shares, you can buy a Put Option to hedge downside risk.
B. Speculation
Traders try to profit from price movements using leverage.
Example:
Buy BANKNIFTY 500-point movement with small capital by using options.
C. Arbitrage
Exploiting price differences between:
Spot and Futures
Option prices (mispricing)
Arbitrage is low-risk and often executed by institutions.
9. Option Pricing Factors
Option premiums are affected by:
1. Intrinsic Value
Value if exercised today.
2. Time Value
More time → higher premium.
3. Volatility
Higher volatility → higher premium.
4. Interest Rates
Small effect, but important for indices.
5. Demand/Supply
Market sentiment impacts prices.
The most important factors in India’s F&O market are volatility and time decay.
10. Greeks: The Heart of Options Trading
1. Delta
Measures price sensitivity.
Call Delta: 0 to 1
Put Delta: 0 to –1
2. Gamma
Rate of change of Delta.
3. Theta
Time decay.
Option buyers hate Theta; sellers love it.
4. Vega
Effect of volatility on premium.
5. Rho
Effect of interest rates (least used).
Understanding Greeks is essential for advanced F&O trading.
11. Popular F&O Strategies
Directional Strategies
Long Call
Long Put
Short Futures
Long Futures
Non-Directional Strategies
Straddle
Strangle
Iron Condor
Butterfly
Hedging Strategies
Protective Put
Covered Call
Collar Strategy
Traders use these based on market conditions and risk appetite.
12. Risks in F&O Trading
1. Leverage Risk
Small price movements can cause huge losses.
2. Unlimited Loss in Option Selling
Selling naked options is extremely risky.
3. Margin Shortfall
If losses exceed margin, broker issues margin calls.
4. Time Decay
Options buyers lose value every day.
5. Volatility Crush
After major events (budget, result days), volatility drops, premiums fall rapidly.
13. Benefits of F&O Trading
1. High Liquidity
Especially in NIFTY and BANKNIFTY.
2. Hedging Power
Protects portfolio from adverse moves.
3. Leverage
Makes it possible to trade large positions with moderate capital.
4. Strategy Flexibility
Works in bull, bear, and sideways markets.
5. Potential for High Returns
When used correctly.
14. F&O in Indian Markets
India is one of the world’s largest F&O markets due to:
High retail participation
Weekly indexes options
Attractive margins
High volatility in indices
Index Options (NIFTY & BANKNIFTY) dominate over stock options.
15. How to Trade F&O Safely
Use stop-loss always
Avoid naked option selling
Stay aware of global markets
Track volatility (India VIX)
Use hedged strategies
Do not overleverage
Maintain discipline
Book profits regularly
Conclusion
F&O trading is a powerful tool for traders and investors, offering leverage, hedging benefits, and the ability to profit from different market conditions. However, F&O trading carries significant risk, especially due to leverage, time decay, and volatility. With proper risk management, strategy, and knowledge of options Greeks, traders can use F&O to enhance returns and protect their portfolios. For beginners, understanding the basics and practicing with small positions is crucial before jumping into advanced strategies or large trades.
Event-Driven and Earnings Trading1. What Is Event-Driven Trading?
Event-driven trading is a strategy built around identifiable catalysts that cause sudden price movements. Traders analyze upcoming events, estimate the market reaction, and position themselves before or after the event.
Typical Events That Move Markets
Earnings announcements
Macroeconomic data releases – GDP, CPI, PMI, payrolls
Central bank decisions – rate hikes, policy statements
Corporate announcements – mergers, acquisitions, buybacks
Regulatory changes
Product launches & strategic updates
Geopolitical events – elections, wars, sanctions
Commodity inventory reports – crude oil, natural gas, metals
Event traders must understand how these triggers affect sentiment, volatility, and liquidity.
2. Why Event-Driven Trading Works
Events catch the market unprepared. Most traders react emotionally. Institutions reposition portfolios. Algorithms trigger stop-loss cascades.
This creates:
Temporary price inefficiencies
Gaps between expectation and reality
Large moves driven by volume spikes
High volatility that offers fast profits
Event trading is attractive because you know when the event will occur, unlike general price prediction where timing is uncertain.
3. Core Approaches in Event-Driven Trading
There are three main ways to trade events:
(A) Pre-Event Trading (Positioning Before the Event)
You take a position based on expectations.
Example:
If a company historically beats earnings, traders may buy before the results.
Advantages
Reduced risk because price elasticity is known
Follows historical patterns
You set clear risk parameters
Disadvantages
If expectations fail, price can gap sharply
Requires strong data analysis
(B) Intraday Event Trading (Trading During the Event)
This involves trading the reaction as the event unfolds.
For example:
Fed meeting volatility
GDP release
Corporate earnings call
Key benefit:
You trade the actual response, not the prediction.
(C) Post-Event Reaction Trading
The safest and most reliable approach.
You let the dust settle, wait for direction clarity, and then trade.
Why it works:
Market overreacts initially. Then a more realistic price trend develops.
4. Understanding Earnings Trading
Earnings trading is the most popular event-driven strategy worldwide. Every quarter, listed companies declare their financial results, providing enormous trading opportunities.
Key Earnings Metrics
EPS (Earnings Per Share)
Revenue growth
Margins
Guidance (future outlook)
Debt & cash flow
Sector performance
But profits in earnings trading come not from what the company reports—but from how the market reacts.
5. Pre-Earnings Trading Strategies
(A) Expectation vs Reality Play
Stocks move based on expectations priced in before earnings.
If expectations are too high, even good earnings cause a drop.
(B) Historical Pattern Analysis
Some stocks behave consistently around earnings:
Apple and Amazon often see extreme volatility
Banks trade strongly on NIM expectations
IT companies react primarily to guidance
(C) Options Trading Before Earnings
Popular strategies:
Straddle (volatility play)
Strangle
Iron condor
Covered call
These strategies profit from volatility crush or price spikes.
6. Trading the Earnings Reaction
(A) Gap Up / Gap Down Breakouts
If a stock gaps up with strong volume after positive earnings, it typically continues higher.
Rules for confirmation:
Volume 2–3× average
Breakout above resistance
No immediate sell-off
Gap-downs behave similarly in the opposite direction.
(B) Trend Continuation Setup
After earnings, if a stock establishes a clear direction for 30–60 minutes, the trend usually continues for the day or week.
(C) Fade the Overreaction
Markets sometimes overreact.
Example:
Stock drops 10% on earnings but fundamentals remain solid.
Institutions start buying the dip.
Fading the panic move becomes profitable.
7. Key Skills Required for Event-Driven & Earnings Trading
To trade events successfully, you need:
1. Fundamental Understanding
Know:
Why the event matters
What outcome is priced in
How the result compares to forecasts
2. Technical Analysis
Focus on:
Support & resistance
Volume profile
Breakout levels
Trend confirmation
Opening range
3. Volatility Management
Events bring volatility.
You must:
Use tight stop losses
Reduce position size
Avoid emotional entries
4. Risk Management
The most important element.
Successful event-driven traders always:
Risk 1–2% per trade
Avoid overleveraging
Accept gaps and slippages
8. Tools Used by Event-Driven Traders
Professional traders rely on:
Economic calendars (for macro events)
Earnings calendars
Volatility indicators
Options implied volatility (IV)
Volume and order flow analysis
Live news feeds
Pre-market scanners
These tools help identify catalysts early and plan trades.
9. "Trade for Success" Framework for Event & Earnings Trading
To consistently profit, follow this structured approach:
Step 1: Identify the Event
Look for high-impact events with predictable timelines.
Step 2: Study Past Behavior
Analyze the stock’s or asset’s previous reactions to similar events.
Step 3: Analyze Market Expectations
What the market expects determines the reaction more than the event itself.
Step 4: Plan Scenarios
Prepare three possible outcomes:
Positive surprise
In-line results
Negative surprise
And plan trades for each.
Step 5: Use Controlled Position Sizes
Never go all-in on events.
Step 6: Attack Only High-Quality Setups
Trade only when:
Momentum is clear
Volume confirms
Trend sustains
Market sentiment supports
Step 7: Execute With Discipline
Event trading is fast-paced—no hesitation.
Step 8: Exit Strategically
Lock profits early. Avoid greed.
10. Common Mistakes to Avoid
Overtrading during events
Ignoring the guidance in earnings
Trading purely based on news headlines
Entering without confirmation
No stop-loss planning
Letting emotions dictate actions
Avoid these to achieve consistent success.
Conclusion
Event-driven and earnings trading is one of the most powerful ways to profit from the stock market. Events create volatility, volatility creates opportunity, and opportunity creates profit—if traded with discipline.
Success lies not in predicting the event, but in understanding market expectations, managing risk, and trading the reaction with precision. With the right preparation, structured planning, and emotion-free execution, event-driven trading can become a reliable, repeatable, and highly profitable approach.
Indian Derivative Secrets1. The First Secret: India is a Market Dominated by Options, Not Futures
One of the biggest secrets that new traders miss is that India’s derivatives segment is overwhelmingly options-driven. More than 95% of the total derivatives turnover comes from options.
This creates unique behavior:
Market often moves to kill option premiums → popularly called premium eating market.
Expiry days show violent moves, as both buyers and sellers fight for option decay or reward.
Weekly expiries for Nifty, Bank Nifty, and FinNifty create short-term trend cycles.
The real secret:
Options sellers (institutions, prop desks) control the market more than options buyers (retail).
Because sellers have deep pockets and margin power, they dictate pricing through:
Heavy shorting on OTM strikes
Creating artificial range-bound movements
Sudden IV crushes after major events
Pinning the market to certain levels on expiry
2. The Second Secret: Open Interest (OI) is a Map of Smart Money
Retail traders look at price; professional traders look at Open Interest.
Key principles:
1. Rising OI + Rising Price → Long Build-up
Indicates accumulation; institutions betting on upward trend.
2. Falling OI + Rising Price → Short Covering
Often triggers sharp intraday rallies.
3. Rising OI + Falling Price → Short Build-up
A strong bearish signal.
4. Falling OI + Falling Price → Long Unwinding
Leads to slow downward drift.
But the deeper secret is this:
Option OI is used to trap retail traders.
Example:
If 20 lakh OI sits at Nifty 22500 CE, it creates a wall of resistance.
If suddenly the OI reduces, it means sellers are scared → breakout incoming.
If OI spikes massively, sellers are confident → reversal incoming.
Professionals track:
Change in OI in last 5 minutes
OI shifting to higher or lower strikes
OI unwinding during big candles
These help predict short-term market moves before they show on charts.
3. The Third Secret: India’s Market is Driven by Event Volatility
Unlike global markets, Indian derivatives see unique event-driven volatility cycles:
1. RBI Policy Days
Bank Nifty’s biggest moves occur here.
IV spikes → option prices increase.
2. Budget Day
High volatility, large swings, unpredictable behavior.
3. Election Results
Massive IV spikes that crush instantly post-event.
4. US Fed Days
Indian markets react sharply the next morning.
The secret?
Option sellers thrive before the event; option buyers thrive after.
The trick is to identify IV patterns:
Before events → IV increases → selling straddles/strangles becomes risky.
After events → IV crashes → buyers lose premium but directional traders profit.
4. The Fourth Secret: FIIs Don’t Control the Market Daily — The Myth
Many retail traders assume FIIs (Foreign Institutional Investors) drive daily trends. This is not true anymore.
The secret:
Proprietary trading firms (prop desks) influence intraday to medium-term moves more than FIIs.
FIIs provide long-term liquidity, but prop firms dominate:
Day trading
Spread strategies
Gamma scalping
Weekly expiry management
Arbitrage between indices
The “intraday direction” is mostly shaped by:
Prop firms (Indian)
High-frequency trading algorithms (HFT)
Market-making firms
5. The Fifth Secret: Option Pain Theory (Max Pain) Actually Works in India
“Max Pain” is the level where the maximum number of option buyers lose money.
In India’s weekly expiry system, this theory becomes extremely powerful.
Institutions try to move the price toward max pain.
Example:
If Nifty’s max pain is at 22400
And current price is 22580
Expect slow grinding downward movement on expiry.
Why?
Because sellers want to make maximum profit from premium decay.
Max pain is not 100% accurate, but works exceptionally well:
In range-bound markets
On expiry days
When OI build-up is clean
6. The Sixth Secret: Market Makers Control Intraday Volatility
A little-known fact:
India’s intraday volatility is heavily influenced by market makers who adjust hedges every second.
They use:
Delta hedging
Gamma scalping
Vega exposure reduction
Arbitrage between futures and options
Calendar spreads
This creates sudden:
Wicks
Fake breakouts
Violent reversals
Stop-loss hunting
Retail often blames “operators”, but the real cause is market-making algorithms.
7. The Seventh Secret: Expiry Day Moves Follow a Predictable Pattern
Every Thursday (and Tuesday/Friday for other indices), the market behaves differently.
9:15–11:30 AM
Range bound → sellers dominate.
11:30–1:30 PM
Small directional move, often fake.
1:30–3:00 PM
True move begins after OI shift.
3:00–3:20 PM
Massive expiry manipulation.
Expiry tricks:
Add huge OI at far OTM strikes → trap buyers
Shift support/resistance rapidly
Trigger SLs of retailers who go long or short
The secret strategy that institutions use:
Selling ATM straddles and hedging using futures or deep OTM options.
8. The Eighth Secret: Price Moves After Retail Stops Getting Trapped
Retail trader behavior is extremely predictable:
They buy options after big candles
They short after breakdowns
They panic during retracements
They buy tops and sell bottoms
Institutions use this to create traps:
Bull Trap
Breakout → triggers retail longs → market reverses.
Bear Trap
Breakdown → triggers retail shorts → market reverses.
The secret is to analyze:
Long/short buildup data
OI spikes near key levels
Market structure on 5-minute charts
9. The Ninth Secret: Volume Profile + OI = Institutional Footprint
The biggest secret weapon in derivatives trading is combining volume with OI.
1. High Volume + High OI → Strong Institutional Position
Expect a trend continuation.
2. High Volume + OI Unwinding → Trend Reversal
Institutions are exiting.
3. Low Volume + High OI → Trap Zone
Retail buyers are trapped; avoid entries.
Conclusion
Indian derivatives trading is not random — it follows the logic, psychology, and positioning of big players, OI structure, volatility cycles, and institutional strategies. The key secrets revolve around understanding who controls the market, how OI shapes price, how algorithms influence intraday volatility, and how weekly expiries create predictable traps and opportunities.
If you master these hidden mechanisms, derivatives trading transforms from gambling into a strategic and probability-driven game.
