Implied Volatility and Open Interest Analysis1. Understanding Implied Volatility (IV)
Implied Volatility is a metric derived from the market price of options that reflects the market’s expectations of future volatility in the price of the underlying asset. Unlike historical volatility, which measures past price fluctuations, IV is forward-looking—it tells us how much the market expects the asset to move in the future.
Key Characteristics of IV:
Expressed in percentage terms, showing the expected annualized movement in the underlying asset.
Does not predict direction—only the magnitude of expected price swings.
Higher IV means the market expects larger price movements (high uncertainty or fear).
Lower IV means smaller expected price movements (stability or complacency).
Factors Influencing Implied Volatility:
Market sentiment: During uncertainty or events like elections, budgets, or economic announcements, IV tends to rise.
Supply and demand for options: Heavy buying of options increases IV, while heavy selling reduces it.
Time to expiration: Longer-duration options usually have higher IV due to greater uncertainty over time.
Earnings or corporate events: Stocks often show rising IV ahead of quarterly earnings announcements.
2. Interpreting Implied Volatility
High IV Environment:
When IV is high, option premiums are expensive. This generally indicates:
Traders expect significant movement (up or down).
Fear or uncertainty is present in the market.
Volatility sellers (option writers) might see an opportunity to sell overpriced options.
For example, before major events like the Union Budget or RBI policy meeting, IV in Nifty options typically spikes due to the anticipated market reaction.
Low IV Environment:
When IV is low, option premiums are cheaper. This usually means:
The market expects calm or limited movement.
Traders may be complacent.
Volatility buyers might see an opportunity to buy options cheaply before an expected rise in volatility.
Implied Volatility Rank (IVR) and IV Percentile:
IV Rank compares current IV to its range over the past year.
Example: An IV Rank of 80 means current IV is higher than 80% of the past year’s readings.
IV Percentile shows the percentage of time IV has been below current levels.
Both help traders decide if options are cheap or expensive relative to history.
3. Understanding Open Interest (OI)
Open Interest represents the total number of outstanding option or futures contracts that are currently open (not yet closed, exercised, or expired). It indicates the total participation or liquidity in a particular strike or contract.
For example, if a trader buys 1 Nifty 22000 Call and another trader sells it, OI increases by one contract. If later that position is closed, OI decreases by one.
Key Aspects of OI:
Rising OI with rising prices = new money entering the market (bullish).
Rising OI with falling prices = fresh short positions (bearish).
Falling OI with rising or falling prices = unwinding of positions (profit booking or exit).
Stable OI = sideways or consolidating market.
4. How to Read Open Interest Data
OI and Price Relationship:
Price Trend OI Trend Market Interpretation
↑ Price ↑ OI Long build-up (bullish)
↓ Price ↑ OI Short build-up (bearish)
↑ Price ↓ OI Short covering (bullish)
↓ Price ↓ OI Long unwinding (bearish)
For example, if Nifty futures rise by 150 points and OI increases, traders are opening new long positions, suggesting bullishness. But if prices rise while OI falls, short positions are being covered.
5. Using OI in Option Chain Analysis
In options trading, OI is especially useful for identifying support and resistance zones.
High Call OI indicates a potential resistance level because sellers expect the price to stay below that strike.
High Put OI indicates a potential support level because sellers expect the price to stay above that strike.
For instance:
If Nifty has maximum Call OI at 22500 and maximum Put OI at 22000, traders consider this as a range of consolidation (22000–22500).
A breakout above 22500 or breakdown below 22000 with sharp OI changes can signal a shift in trend.
6. Combining IV and OI for Better Insights
Using IV and OI together gives a more complete picture of the market’s mindset.
Scenario 1: Rising IV + Rising OI
Indicates strong speculative activity.
Traders expect big moves, either due to events or upcoming volatility.
Suitable for straddle or strangle buyers.
Scenario 2: Falling IV + Rising OI
Implies calm market conditions with new positions being built.
Traders expect limited movement.
Suitable for option writing strategies (like Iron Condor, Short Straddle).
Scenario 3: Rising IV + Falling OI
Suggests short covering or unwinding due to fear.
Market participants are closing existing positions amid uncertainty.
Scenario 4: Falling IV + Falling OI
Indicates profit booking after a volatile phase.
Usually happens in post-event consolidation.
7. Practical Example: Nifty Option Chain Analysis
Suppose the Nifty 50 index is trading around 22,300.
Strike Call OI Put OI IV (Call) IV (Put)
22,000 4.8 L 6.2 L 15% 16%
22,300 5.5 L 5.1 L 17% 18%
22,500 7.8 L 3.9 L 20% 17%
Here:
Maximum Call OI at 22,500 → Resistance zone.
Maximum Put OI at 22,000 → Support zone.
IV is rising across strikes → traders expect upcoming volatility.
If price moves above 22,500 and Call writers exit (OI drops), while new Put OI builds, it signals a bullish breakout.
8. Role of IV and OI in Strategy Selection
High IV Strategies (Volatile Market):
Buy Straddle or Strangle (expecting large movement)
Calendar Spread
Long Vega strategies
Low IV Strategies (Stable Market):
Iron Condor
Short Straddle
Covered Call
Credit Spreads
OI data helps traders identify which strikes to select for these strategies and where the market might reverse or consolidate.
9. Limitations of IV and OI Analysis
While powerful, both metrics have limitations:
IV can be misleading before major events; it reflects expectations, not certainty.
OI data is end-of-day in many cases, so intraday traders might miss rapid shifts.
Sharp OI changes might also result from rollovers or hedging adjustments, not directional bias.
Hence, traders must use IV and OI along with price action, volume, and trend indicators for confirmation.
10. Conclusion
Implied Volatility and Open Interest form the foundation of options market sentiment analysis.
IV tells us what the market expects to happen in terms of movement magnitude.
OI tells us how much participation or commitment traders have in the current trend.
Together, they reveal a deeper layer of market psychology—identifying whether traders are fearful, greedy, hedging, or speculating.
For successful trading, combining price action + IV + OI enables traders to forecast volatility cycles, confirm trends, and time their entries or exits effectively.
In essence, mastering IV and OI analysis empowers traders to read the invisible hand of market sentiment—a crucial skill for anyone in the derivatives market.
Contains image
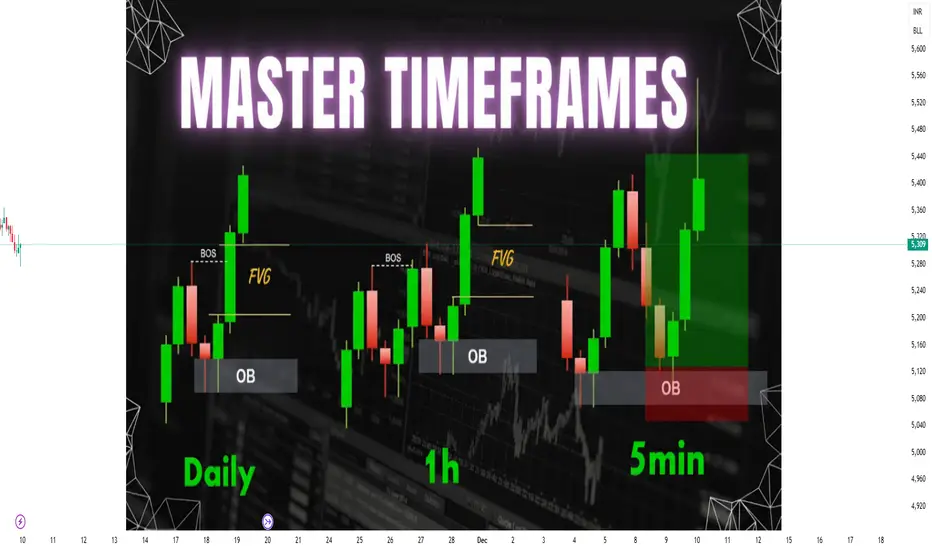
Multi-Timeframe Analysis (Intraday, Swing, Positional)1. Understanding Multi-Timeframe Analysis
Multi-Timeframe Analysis refers to the process of observing the same security across different timeframes to identify trend alignment, potential reversal zones, and optimal trading opportunities. Every timeframe provides unique insights:
Higher Timeframe: Defines the major trend and key support/resistance zones.
Intermediate Timeframe: Helps identify swing trends within the larger move.
Lower Timeframe: Provides precise entry and exit signals.
For example, a trader analyzing Nifty 50 might observe:
Daily Chart (Positional) for the overall trend direction.
Hourly Chart (Swing) for intermediate momentum.
15-Minute Chart (Intraday) for entry confirmation.
This top-down approach ensures that trades are placed in harmony with the broader market movement rather than against it.
2. The Logic Behind Multi-Timeframe Analysis
Financial markets are fractal in nature, meaning patterns repeat on various time scales. A breakout on a 5-minute chart might just be a retracement on a 1-hour chart, while a downtrend on a daily chart could appear as a bullish trend on a 15-minute chart.
MTA helps traders:
Identify dominant trends (macro view).
Spot short-term countertrends (micro adjustments).
Time entries with high probability setups.
Essentially, it synchronizes multiple layers of information to produce well-informed trading decisions.
3. Types of Traders and Timeframes
Each trader category operates within different time horizons:
A. Intraday Traders
Objective: Capture small price moves within a single trading day.
Timeframes Used: 1-minute, 5-minute, 15-minute, and 1-hour charts.
Holding Period: A few minutes to several hours.
Example: A trader identifies a bullish breakout on the 15-minute chart, confirms strength on the 5-minute chart, and exits before the market close.
B. Swing Traders
Objective: Ride short to medium-term trends lasting several days or weeks.
Timeframes Used: 1-hour, 4-hour, and daily charts.
Holding Period: 2 to 15 days typically.
Example: A bullish pattern on the daily chart confirmed by a 4-hour breakout helps the trader capture a multi-day price rally.
C. Positional Traders
Objective: Trade major trends that can last from weeks to months.
Timeframes Used: Daily, weekly, and monthly charts.
Holding Period: Several weeks to many months.
Example: A trader identifies a long-term uptrend on the weekly chart and holds positions through short-term fluctuations.
Each trader uses MTA to align smaller trends within the context of larger ones.
4. The Top-Down Approach
The Top-Down Approach is a systematic method of conducting multi-timeframe analysis. It involves starting with the highest relevant timeframe and drilling down to lower timeframes for precision.
Step 1: Identify the Major Trend (Higher Timeframe)
Use weekly or daily charts to determine the broader market direction.
Apply moving averages, trendlines, or price structure (higher highs and higher lows).
Example: On the weekly chart, Nifty 50 is in an uptrend.
Step 2: Confirm Momentum (Intermediate Timeframe)
Switch to a 4-hour or 1-hour chart to check if the momentum supports the higher timeframe trend.
Look for consolidation, breakouts, or pullbacks.
Step 3: Refine Entry and Exit (Lower Timeframe)
Use 15-minute or 5-minute charts to time entries and exits.
Identify short-term support, resistance, and candlestick patterns for precision.
This method ensures alignment between long-term direction and short-term trade execution, minimizing false signals and improving accuracy.
5. Example of Multi-Timeframe Analysis in Action
Let’s illustrate with an example:
Weekly Chart (Positional View): Shows a strong uptrend with price above 50-day moving average.
Daily Chart (Swing View): Reveals a bullish flag pattern forming after a rally.
Hourly Chart (Intraday View): Displays a breakout above the flag resistance with volume confirmation.
A positional trader may initiate a long position based on weekly strength, while a swing trader enters after the daily flag breakout. An intraday trader could use the hourly chart to time the exact breakout candle entry.
All three traders align their strategies to the same trend but operate on different time horizons.
6. Tools and Indicators Used in Multi-Timeframe Analysis
Several tools enhance the effectiveness of MTA:
Moving Averages (MA): Identify trend direction and alignment across timeframes (e.g., 20 EMA, 50 SMA).
Relative Strength Index (RSI): Helps confirm momentum consistency.
MACD: Detects shifts in momentum and crossovers aligning with major trends.
Support and Resistance Levels: Define crucial zones visible across charts.
Trendlines and Channels: Show structure of price swings.
Candlestick Patterns: Confirm entry signals on smaller timeframes.
Combining these tools across multiple frames builds confluence—an essential component of successful trading.
7. Advantages of Multi-Timeframe Analysis
Trend Confirmation:
Confirms whether short-term movements align with the long-term trend, improving accuracy.
Reduced False Signals:
Helps filter noise from smaller charts that may mislead traders.
Enhanced Entry Timing:
Allows traders to enter trades at precise moments when all timeframes agree.
Better Risk Management:
By aligning with larger trends, traders can define stop-loss and target levels more logically.
Adaptability Across Strategies:
Suitable for scalping, swing trading, or long-term investing.
8. Challenges in Multi-Timeframe Analysis
While MTA is powerful, it also presents certain difficulties:
Information Overload: Analyzing multiple charts can cause confusion or analysis paralysis.
Conflicting Signals: Short-term and long-term charts may show opposite trends, requiring trader judgment.
Execution Complexity: Managing entries and exits across multiple timeframes demands discipline and experience.
Emotional Bias: Traders may get biased by one timeframe and ignore contradictory evidence.
Therefore, consistency in analysis and clear trading rules are vital to prevent confusion.
9. Tips for Effective Multi-Timeframe Trading
Always start with higher timeframes before moving down.
Use a ratio of 1:4 or 1:6 between timeframes (e.g., daily → 4-hour → 1-hour).
Focus on key support/resistance levels visible across multiple frames.
Avoid overcomplicating; two or three timeframes are usually enough.
Maintain a trading journal to note observations from each timeframe.
Use alerts or automated tools to monitor price behavior when multiple charts are involved.
10. Conclusion
Multi-Timeframe Analysis is not just a technique but a strategic framework that enhances decision-making across trading styles—whether intraday, swing, or positional. By combining insights from different timeframes, traders gain a holistic view of the market, identify high-probability setups, and reduce the risk of false entries.
For intraday traders, MTA refines timing; for swing traders, it offers trend confirmation; and for positional traders, it ensures long-term alignment. When executed with discipline, proper analysis, and risk control, Multi-Timeframe Analysis becomes one of the most reliable methods to trade profitably in volatile markets like India’s NSE and BSE.
Algorithmic and High-Frequency Trading (HFT) in India1. Understanding Algorithmic Trading
Algorithmic trading refers to the use of computer programs and mathematical models to automate the process of trading financial instruments such as equities, derivatives, currencies, and commodities. Instead of manual execution by human traders, algorithms follow predefined instructions based on time, price, quantity, and other market parameters.
In India, algorithmic trading gained momentum after the Securities and Exchange Board of India (SEBI) permitted it in 2008 for institutional investors. Since then, it has grown exponentially with the adoption of advanced technologies such as Artificial Intelligence (AI), Machine Learning (ML), and Big Data analytics.
Algorithmic trading strategies are typically designed to:
Reduce transaction costs
Minimize human emotions in trading
Execute large orders without disrupting market prices
Capitalize on small, short-lived price inefficiencies
Common strategies include trend-following, statistical arbitrage, mean reversion, market making, and pairs trading.
2. High-Frequency Trading (HFT) Explained
High-Frequency Trading (HFT) is a specialized subset of algorithmic trading characterized by extremely high-speed trade execution, large volumes of orders, and very short holding periods. HFT firms rely on:
Ultra-low latency networks
Co-location facilities (where trading servers are placed near exchange servers)
Advanced algorithms capable of executing thousands of trades per second
The goal of HFT is to profit from microsecond-level market inefficiencies—such as differences in bid-ask spreads, arbitrage opportunities between exchanges, or momentary price dislocations.
In India, HFT is primarily used by institutional investors, proprietary trading firms, and hedge funds that have access to advanced infrastructure and regulatory approvals.
3. Evolution of Algo and HFT in India
India’s journey toward algorithmic and HFT trading began in the late 2000s. The National Stock Exchange (NSE) was among the first to offer Direct Market Access (DMA) and co-location services, enabling institutional participants to connect directly to the exchange infrastructure with minimal latency.
2008: SEBI allowed institutional investors to use algorithmic trading.
2010-2012: Exchanges introduced co-location services and low-latency networks.
2013 onwards: Rapid growth in automated order flow; by some estimates, over 40% of equity and derivatives trades were algorithmically driven.
2020s: Integration of AI, ML, and predictive analytics in trading algorithms.
With rising competition among institutional players, Indian exchanges have continuously upgraded their technology to handle high message traffic, ensuring fairness and stability in automated markets.
4. Key Participants in Indian Algo and HFT Ecosystem
Institutional Investors: Mutual funds, pension funds, and insurance companies use algorithmic systems to execute large orders efficiently.
Proprietary Trading Firms: They rely heavily on HFT and statistical arbitrage strategies to exploit microsecond-level opportunities.
Foreign Institutional Investors (FIIs): Many global firms deploy HFT strategies in Indian markets through subsidiaries or partnerships.
Retail Traders: Although limited, retail participation is increasing through brokers offering API-based trading platforms and algorithmic bots.
Exchanges and Brokers: NSE and BSE provide the technological backbone with co-location and data feed services, while brokers offer execution APIs and backtesting tools.
5. Technological Infrastructure Supporting HFT
The success of algorithmic and HFT trading depends on speed, precision, and data quality. Indian exchanges have developed world-class infrastructure that supports high-frequency trading through:
Co-location facilities for ultra-low latency trading
High-speed fiber-optic and microwave communication networks
Real-time market data feeds with millisecond granularity
Application Programming Interfaces (APIs) for automated order routing
Advanced risk management systems to monitor orders and prevent errors
Additionally, the rise of cloud computing and AI-driven analytics allows traders to process vast volumes of tick-level data and develop predictive models for future price movements.
6. Popular Algorithmic Trading Strategies in India
Several algorithmic strategies are widely employed in Indian markets, including:
Arbitrage Strategies: Exploiting price differences between cash and futures, or across exchanges (NSE vs. BSE).
Market Making: Providing liquidity by continuously quoting buy and sell prices.
Momentum and Trend Following: Identifying and riding price trends using moving averages or momentum indicators.
Statistical Arbitrage: Using quantitative models to exploit temporary price inefficiencies between correlated assets.
News-Based Trading: Using natural language processing (NLP) to react instantly to news or corporate announcements.
7. Regulatory Framework by SEBI
Given the complexity and speed of algorithmic and HFT activity, SEBI plays a critical role in ensuring market integrity and fairness. The regulator has introduced several guidelines, including:
Pre-trade risk checks: To prevent erroneous or large orders that could disrupt markets.
Order-to-trade ratio limits: To control excessive order cancellations by HFT firms.
Unique Algo IDs: Each algorithm must be registered and tested before deployment.
Latency equalization measures: SEBI proposed “random speed bumps” to reduce unfair advantages from co-location.
Surveillance systems: Exchanges continuously monitor unusual order patterns or spoofing activities.
These measures ensure that algorithmic and HFT activities enhance liquidity without introducing instability or manipulation.
8. Benefits of Algorithmic and HFT in Indian Markets
Algorithmic and high-frequency trading have brought several benefits to the Indian financial ecosystem:
Increased Market Liquidity: Continuous order flow ensures tighter bid-ask spreads and efficient execution.
Improved Price Discovery: Algorithms react quickly to new information, making prices more reflective of true value.
Reduced Transaction Costs: Automated execution minimizes human errors and slippage.
Enhanced Market Efficiency: Rapid arbitrage eliminates temporary price discrepancies.
Accessibility for Retail Traders: With new APIs and algo platforms, small traders can deploy systematic strategies.
9. Challenges and Criticisms
Despite its advantages, algo and HFT trading come with significant challenges:
Market Fairness: HFT firms with superior technology can gain an unfair advantage over smaller participants.
Flash Crashes: Erroneous algorithms or feedback loops can cause sudden market volatility.
Systemic Risks: High interconnectivity among automated systems may amplify shocks.
Regulatory Complexity: Constant innovation in trading algorithms challenges regulators to keep up.
Infrastructure Costs: Access to co-location and high-speed data remains expensive, creating barriers for smaller firms.
10. Future Outlook of Algo and HFT Trading in India
The future of algorithmic and HFT trading in India is poised for robust growth, driven by advancements in AI, machine learning, and big data analytics.
Key emerging trends include:
AI-driven Predictive Models: Algorithms capable of learning from historical and real-time data to make adaptive trading decisions.
Blockchain Integration: Transparent and secure transaction systems reducing latency and settlement risk.
API Democratization: Greater access for retail traders through open APIs and low-cost algo platforms.
Smart Regulation: SEBI’s proactive stance on monitoring algorithmic activity while encouraging innovation.
Cross-Asset Automation: Expansion of algorithms to currencies, commodities, and fixed-income markets.
With India’s rapidly digitalizing financial ecosystem and growing participation from domestic and global investors, algorithmic and HFT trading will continue to play a pivotal role in shaping the country’s capital markets.
Conclusion
Algorithmic and High-Frequency Trading represent the cutting edge of financial market evolution in India. They have transformed the landscape of stock trading from human-driven judgment to machine-driven precision and speed. While challenges related to fairness, systemic risk, and infrastructure persist, regulatory oversight by SEBI and technological innovation continue to balance growth with stability.
As India’s markets mature, algorithmic and HFT trading will not only enhance liquidity and efficiency but also position the country as a leading global hub for financial technology innovation—marking a new era of smart, data-driven, and automated trading.
AI and Machine Learning in Stock Market Forecasting1. Introduction to AI and Machine Learning in Finance
Artificial Intelligence refers to the simulation of human intelligence in machines that can learn, reason, and make decisions. Machine Learning, a subset of AI, involves algorithms that improve automatically through experience. In finance, AI and ML are used to analyze market data, forecast trends, and automate trading strategies.
Unlike traditional statistical models that rely on fixed mathematical relationships, ML models adapt dynamically to changing market conditions. This adaptability makes them particularly useful in forecasting stock prices, where patterns are non-linear, complex, and influenced by multiple interacting variables.
2. Traditional Methods vs. AI-Based Forecasting
Traditional stock market forecasting techniques — such as fundamental analysis, technical analysis, and econometric models — depend heavily on historical data and human interpretation. These models often assume linear relationships and static patterns, which may not hold true in volatile markets.
In contrast, AI and ML models can process:
Large volumes of structured and unstructured data
Non-linear dependencies
Real-time information updates
For example, a traditional regression model may struggle to account for sudden market shocks, whereas an ML algorithm can learn from data anomalies and adapt to new market behaviors through continuous learning.
3. Machine Learning Techniques in Stock Market Forecasting
AI-driven forecasting utilizes various ML algorithms, each suited for different kinds of financial predictions:
a. Supervised Learning
Supervised learning algorithms are trained using labeled historical data — for example, past stock prices and associated indicators — to predict future values. Common models include:
Linear and Logistic Regression
Support Vector Machines (SVM)
Random Forests
Gradient Boosting Machines (XGBoost, LightGBM)
These algorithms can forecast future price movements, classify stocks as “buy,” “hold,” or “sell,” and identify potential risks.
b. Unsupervised Learning
In unsupervised learning, algorithms detect hidden patterns in data without labeled outcomes. Techniques like K-Means Clustering and Principal Component Analysis (PCA) are used to:
Identify stock groupings with similar behavior
Detect anomalies or unusual trading activities
Segment markets based on volatility or performance trends
c. Deep Learning
Deep Learning models, particularly Recurrent Neural Networks (RNNs) and Long Short-Term Memory (LSTM) networks, are highly effective in time-series forecasting.
These models capture temporal dependencies — such as how past price movements influence future prices — and are capable of handling sequential data efficiently.
For instance, an LSTM model can analyze years of price history, trading volume, and sentiment data to forecast the next day’s closing price.
d. Reinforcement Learning
Reinforcement Learning (RL) is a powerful AI approach where algorithms learn optimal trading strategies through trial and error. The system receives rewards for profitable trades and penalties for losses, gradually learning to maximize returns.
RL is increasingly used in algorithmic trading systems that make autonomous buy/sell decisions based on real-time market data.
4. Data Sources for AI-Based Forecasting
AI and ML models rely on diverse data sources to generate accurate predictions:
Historical Market Data: Price, volume, volatility, and returns over time.
Fundamental Data: Earnings, balance sheets, and macroeconomic indicators.
Alternative Data: News sentiment, social media trends, Google searches, and even satellite imagery.
Technical Indicators: Moving averages, RSI, MACD, and Bollinger Bands.
By integrating structured (numerical) and unstructured (text, images) data, AI models can capture market sentiment and detect emerging trends that traditional models may overlook.
5. Applications of AI and ML in Stock Forecasting
a. Price Prediction
Machine learning models are used to forecast short-term and long-term price movements. Algorithms such as LSTMs and Random Forests analyze time-series data to predict next-day or next-week stock prices.
b. Sentiment Analysis
Natural Language Processing (NLP), a branch of AI, interprets financial news, analyst reports, and social media content to gauge market sentiment.
For example, a surge in negative news sentiment about a company may signal an upcoming drop in its stock price.
c. Portfolio Optimization
AI systems analyze correlations among different assets and optimize portfolios to maximize returns while minimizing risk. Tools like Markowitz’s modern portfolio theory can be enhanced by machine learning models that adapt dynamically to market volatility.
d. High-Frequency Trading (HFT)
In high-frequency trading, AI algorithms execute thousands of trades per second based on micro-movements in prices. ML models process real-time market data streams and make ultra-fast trading decisions with minimal human intervention.
e. Risk Management and Anomaly Detection
AI systems monitor trading patterns to identify abnormal behavior, potential fraud, or risk exposure. These models help financial institutions comply with regulations and safeguard investor assets.
6. Benefits of AI and ML in Forecasting
Accuracy and Efficiency: AI models can analyze vast datasets quickly and produce precise forecasts.
Adaptability: They adjust to evolving market dynamics without manual recalibration.
Automation: Reduces human error and enables algorithmic trading.
Sentiment Integration: Incorporates behavioral and psychological aspects of markets.
Continuous Learning: Models improve over time as they process more data.
AI thus empowers traders, analysts, and institutions to make data-driven decisions and respond rapidly to market changes.
7. Challenges and Limitations
Despite their promise, AI and ML in stock forecasting face certain limitations:
Data Quality Issues: Inaccurate or biased data can mislead models.
Overfitting: ML models may perform well on training data but fail in real-world scenarios.
Black-Box Nature: Many AI models lack transparency in how they generate predictions, posing trust issues.
Market Unpredictability: Events like political crises, pandemics, or natural disasters can disrupt models trained on historical data.
Ethical and Regulatory Concerns: Use of AI-driven trading can lead to market manipulation or flash crashes if not monitored.
Hence, human oversight remains essential even in AI-based systems.
8. Future of AI and ML in Financial Forecasting
The future of AI in finance lies in hybrid models — combining human expertise with machine intelligence. Emerging technologies such as Quantum Computing, Explainable AI (XAI), and Federated Learning will further enhance forecasting capabilities.
Moreover, integration of blockchain data, real-time global sentiment, and predictive analytics will make AI-driven models more robust and transparent.
In the coming years, AI systems are expected to play a central role not just in forecasting but also in risk management, compliance automation, and personalized investment advice through robo-advisors.
9. Conclusion
AI and Machine Learning have transformed the way investors, institutions, and analysts approach the stock market. From pattern recognition and sentiment analysis to autonomous trading and portfolio optimization, these technologies offer powerful tools for understanding and predicting market behavior.
While challenges such as data quality, overfitting, and transparency remain, continuous advancements in AI research promise more reliable and interpretable forecasting systems. Ultimately, the combination of human insight and AI-driven analytics represents the future of intelligent investing — where data, algorithms, and human judgment work hand in hand to navigate the ever-changing financial markets.

The Psychology Behind Winning TradesThe Psychology Behind Winning Trades 🧠💹✨
Introduction – Hook:
📊 “Why do some traders consistently win 💰 while others struggle 💔?”
It’s rarely the strategy—it’s the mindset behind the trade! 🧠🌟
Your emotions, thoughts, and biases control your decisions, even with perfect technical skills. 🎯
1️⃣ What is Trading Psychology?
Trading psychology is the study of how emotions and mental habits affect trading decisions. 🌈🧘♂️
It’s about understanding:
How fear 😨, greed 😍, or impatience ⏳ impacts your trades
Why you sometimes ignore your rules 📝
How discipline 💪 can make the difference between profit 🏆 and loss 💸
💡 Tip: Even the best strategies fail if your mind isn’t in control. 🧠✨
2️⃣ Common Psychological Traps & How They Appear in Trades
Trap Emoji Effect Example in Trading
Fear 😨 Exiting too early Closing a winning trade because you’re scared of losing profits 💔
Greed 😍 Holding losing trades Waiting for a loss to “come back” and losing more money 💸
FOMO 🏃♂️💨 Jumping impulsively Entering trades last minute because everyone else is trading 🚀
Revenge Trading 😤🔥 Emotional loss-chasing Trying to recover losses by taking bigger, risky trades 💣
💡 Insight: Recognizing these emotions is the first step to controlling them. 🌟
3️⃣ How to Master Your Trading Mind
1️⃣ Pre-Trade Preparation 🧘♀️✅
Check your emotional state before trading 🕊️
Confirm your trade plan is clear 📋✨
2️⃣ During the Trade ✋🎯
Stick to your rules, don’t let emotions take over 💪🔥
Avoid impulsive exits or entries ⏱️❌
3️⃣ Post-Trade Reflection 📖🖊️
Keep a Trading Journal: note emotions, mistakes & wins ✨📓
Review trades to improve your mindset over time 📈🌟
4️⃣ Pro Tips for Winning Psychology
🔥 Mindset Checklist:
Am I trading calmly? 😌💭
Am I following my plan? 📋✅
Am I chasing losses or profits emotionally? ⚖️💡
💡 Daily Mindset Practice: Meditation 🧘♂️, journaling ✍️, or reviewing trades 📊 can help you stay disciplined under pressure 💎🌟
5️⃣ Why It Matters
Trading without psychology = strategy leaks money 💸💨
Emotional control = consistency, higher win rates, confidence 🏆💪
Professionals don’t just trade charts—they trade themselves 🧠✨
6️⃣ Engagement Section
👇 Question for your audience:
“What’s the biggest psychological trap YOU’ve faced in trading? Share your story below! 💬💭💖”

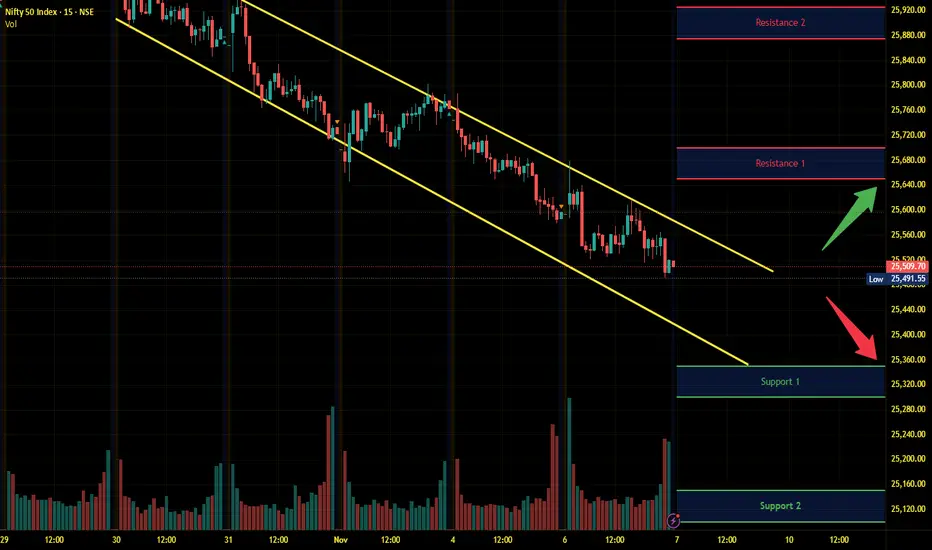
Nifty Intraday Analysis for 07th November 2025NSE:NIFTY
Index has resistance near 25650 – 25700 range and if index crosses and sustains above this level then may reach near 25875 – 25925 range.
Nifty has immediate support near 25350 – 25300 range and if this support is broken then index may tank near 25150 – 25100 range.
Overall sentiment of the market is sideways to negative and selling is expected if the market reaches near resistance level.
Banknifty Premium ChartWhat is Option Premium?
It’s the cost of an option contract.
When you buy an option, you pay the premium upfront.
Example: If you buy a Call Option of Reliance ₹2800 at ₹50 premium — you pay ₹50 × lot size.
Who Receives It?
The option seller (writer) receives the premium income immediately when they sell (write) the option.

Explain: Candle PatternWhat is a Candlestick Pattern?
A candlestick pattern represents the price movement of an asset (like a stock) during a specific time frame. It shows open, high, low, and close prices in one candle.
Structure of a Candle
Each candle has:
Body: The range between open and close price.
Wick (or shadow): The lines above and below the body showing high and low prices.
Color: Green (bullish – price up) or Red (bearish – price down).

Part 4 Learn Institutional TradingAdvantages of Option Trading
Leverage:
Options allow control over large quantities of an asset with a small investment (premium). This magnifies potential profits.
Limited Risk for Buyers:
When buying options, the maximum loss is limited to the premium paid.
Hedging Capability:
Options can offset potential losses in the underlying portfolio.
Flexibility:
Options can be combined in various strategies to suit market outlooks—bullish, bearish, or neutral.
Multiple Strategies:
Options offer numerous strategies like straddles, strangles, spreads, collars, and iron condors, giving traders the ability to profit in different market conditions.

Part 3 Learn Institutional Trading Purpose of Option Trading
Option trading serves three main purposes:
Hedging (Risk Management):
Investors use options to protect their portfolios against adverse price movements. For instance, if you hold a stock, buying a put option acts as insurance—allowing you to sell the stock at a predetermined price even if the market crashes.
Speculation:
Traders use options to bet on future market direction. Options allow traders to gain exposure with limited capital, as the premium is usually a fraction of the asset’s full price.
Income Generation:
Investors can sell (write) options to earn premiums. For example, selling covered calls against owned stocks generates additional income, even if the stock price remains stable.

Part 2 Ride The Big Moves How Option Prices Are Determined
Option prices are influenced by several factors. The most common model used to calculate the theoretical value of an option is the Black-Scholes Model. The key factors that affect option prices include:
Underlying Asset Price: The higher the price of the asset, the higher the value of a call option and the lower the value of a put option.
Strike Price: The difference between the strike and current market price affects the intrinsic value of the option.
Time to Expiration: The more time left until expiration, the higher the premium (because there’s more time for the option to become profitable).
Volatility: Higher volatility increases option premiums since the chance of large price movement rises.
Interest Rates and Dividends: These can slightly influence option values, especially for longer-term options.

Part 1 Ride The Big Moves How Option Trading Works
Option trading involves four basic positions:
Buy Call (Long Call): The trader expects the underlying asset’s price to rise.
Sell Call (Short Call): The trader expects the price to stay the same or fall.
Buy Put (Long Put): The trader expects the underlying asset’s price to fall.
Sell Put (Short Put): The trader expects the price to stay the same or rise.
For example, if a trader buys a call option on a stock with a strike price of ₹100 and pays a premium of ₹5, they have the right to buy the stock at ₹100 even if it rises to ₹120. In this case, their profit per share would be ₹15 (₹120 - ₹100 - ₹5). However, if the stock remains below ₹100, they would not exercise the option and would lose only the premium of ₹5.

Part 2 Support and Reistance Key Terminology in Option Trading
Before diving deeper, it’s important to understand the essential terms used in option trading:
Strike Price: The fixed price at which the holder can buy (call) or sell (put) the underlying asset.
Premium: The price paid by the option buyer to the seller for the contract.
Expiration Date: The date on which the option contract expires. After this date, the option becomes worthless if not exercised.
In-the-Money (ITM): A call option is ITM when the underlying price is above the strike price; a put option is ITM when the underlying price is below the strike price.
Out-of-the-Money (OTM): A call option is OTM when the underlying price is below the strike price; a put option is OTM when the underlying price is above the strike price.
At-the-Money (ATM): When the underlying asset price equals the strike price.
Underlying Asset: The financial instrument (stock, index, currency, or commodity) on which the option is based.

Part 1 Support and Resistance What Are Options?
An option is a financial contract between two parties: the buyer (also called the holder) and the seller (also called the writer). The buyer pays a premium to the seller in exchange for the right to buy or sell the underlying asset at a specified strike price before or on a specified expiration date.
There are two main types of options:
Call Option – gives the buyer the right to buy the underlying asset at the strike price.
Put Option – gives the buyer the right to sell the underlying asset at the strike price.

The Future of High-Frequency Trading (HFT)Speed, Strategy, and the Next Market Revolution
High-Frequency Trading (HFT) has revolutionized global financial markets over the past two decades. What began as an innovation in trading efficiency has evolved into a highly sophisticated ecosystem where algorithms compete for nanosecond advantages. As technology continues to advance and regulations adapt, the future of HFT stands at the crossroads of artificial intelligence, quantum computing, and evolving market structures. This article explores the future of HFT—its direction, challenges, and the forces shaping its next phase.
1. The Evolution of HFT: From Speed to Intelligence
In its early days, HFT was primarily about speed—executing orders faster than anyone else. Firms invested heavily in low-latency networks, co-location services, and custom hardware to shave off microseconds. Those who executed trades even a fraction of a second faster could exploit small price inefficiencies for massive cumulative profits.
However, as markets became saturated with HFT players and infrastructure speeds reached physical limits (the speed of light), the competitive edge began shifting from raw speed to strategic intelligence. Now, success in HFT increasingly depends on smarter algorithms, superior data analysis, and predictive modeling rather than just faster cables.
The next era of HFT will thus be defined not by who is faster, but by who is smarter.
2. The Role of Artificial Intelligence and Machine Learning
Artificial Intelligence (AI) and Machine Learning (ML) are transforming the way HFT strategies are designed and executed. Traditional HFT algorithms rely on rule-based systems—predefined triggers for buying or selling. But AI-driven systems can analyze complex market data, detect evolving patterns, and make autonomous trading decisions in real time.
AI enables “adaptive trading”—algorithms that learn from past trades, market conditions, and competitor behavior to continuously optimize performance. For instance:
Reinforcement learning models can test millions of trading strategies in simulated markets and refine them dynamically.
Neural networks can detect hidden correlations between assets or anticipate volatility spikes.
Natural Language Processing (NLP) can analyze news headlines, social media, and even central bank statements for sentiment signals.
The future of HFT will likely integrate AI into every layer—from signal generation to order execution—creating a new class of self-evolving trading machines.
3. Quantum Computing: The Next Speed Frontier
While AI adds intelligence to HFT, quantum computing may reintroduce a new frontier of speed. Quantum computers have the potential to process vast datasets and run complex probabilistic models exponentially faster than classical computers.
For HFT, this means:
Faster optimization of multi-variable trading strategies.
Instant analysis of correlations across thousands of assets.
Enhanced encryption-breaking capabilities—posing new security challenges for exchanges.
Although quantum technology is still in early stages, firms like IBM, Google, and major hedge funds are already exploring quantum algorithms for portfolio optimization and risk modeling. Within the next decade, early adopters could gain an edge similar to what early HFT pioneers had in the 2000s.
4. Regulation and Ethical Challenges
The rise of HFT has sparked concerns about market fairness and systemic risk. Critics argue that HFT firms gain unfair advantages, manipulate prices, and contribute to flash crashes—sudden market collapses triggered by algorithmic errors or feedback loops.
In response, regulators worldwide are tightening oversight:
Europe’s MiFID II imposes stricter reporting and transparency rules for algorithmic trading.
The U.S. SEC has increased surveillance on market manipulation techniques like “spoofing” and “quote stuffing.”
India’s SEBI has introduced frameworks for algorithmic trading access, ensuring level playing fields.
Going forward, regulation will likely focus on algorithmic accountability—requiring firms to demonstrate that their trading systems are safe, transparent, and auditable. Ethical AI design will become a competitive necessity, as firms must balance profit with stability and fairness.
5. The Expansion of Alternative Markets
Another major trend shaping HFT’s future is the rise of alternative trading systems (ATS) and dark pools. These off-exchange venues allow large institutions to trade with less visibility, reducing market impact. HFT firms are increasingly participating in these environments, providing liquidity and executing arbitrage between public and private markets.
Additionally, the growing ecosystem of cryptocurrency and digital assets has opened a new frontier for high-frequency traders. Crypto exchanges operate 24/7, offering higher volatility and fewer regulatory constraints—ideal conditions for algorithmic strategies. Firms now deploy HFT systems in Bitcoin, Ethereum, and DeFi markets using similar latency-sensitive techniques as in equities or forex.
As tokenized assets and blockchain-based exchanges mature, HFT will play a central role in ensuring liquidity and price efficiency across decentralized markets.
6. Data is the New Edge
In modern HFT, access to superior data often determines success. The future of trading will revolve around alternative data—non-traditional sources such as satellite imagery, shipping data, social media sentiment, and even IoT sensors.
For example:
Monitoring car counts in retail parking lots to estimate sales.
Tracking weather patterns to predict commodity price movements.
Using real-time shipping data to forecast global supply trends.
Combining alternative data with AI allows traders to predict market movements before they appear on traditional indicators. In the coming years, the firms that master data fusion—the integration of structured and unstructured data—will dominate the HFT landscape.
7. Infrastructure Innovation: From Edge Computing to 5G
As markets globalize, latency reduction extends beyond fiber optics. Future HFT infrastructures will likely leverage edge computing, 5G connectivity, and satellite-based communication systems to push execution times closer to real-time.
Edge computing allows algorithms to run geographically closer to data sources—whether stock exchanges or crypto nodes—minimizing transmission delays. Similarly, 5G networks offer sub-millisecond latency and high reliability, unlocking new opportunities for algorithmic trading in mobile and IoT-enabled environments.
Such infrastructure advancements will also democratize HFT, allowing smaller firms to compete without massive investments in traditional data centers.
8. Human Traders in an Algorithmic World
As algorithms dominate, what happens to human traders? While automation has replaced much of manual execution, humans remain critical in designing, supervising, and ethically guiding trading systems.
In the future, human expertise will shift from execution to oversight and creativity:
Developing novel trading logic and hybrid strategies.
Overseeing risk management systems.
Ensuring compliance with regulatory and ethical standards.
The most successful firms will be those that combine human intuition with machine precision—a symbiosis rather than competition.
9. Challenges Ahead: Risk, Saturation, and Market Fragmentation
Despite its advantages, the HFT ecosystem faces significant challenges:
Market Saturation: With thousands of algorithms competing, profit margins per trade are shrinking.
Systemic Risk: Complex inter-algorithm interactions can amplify volatility, as seen during flash crashes.
Cybersecurity Threats: As trading systems become more connected, they also become more vulnerable to hacking and data breaches.
Future resilience will depend on developing robust, self-correcting systems capable of detecting and neutralizing unintended market feedback loops in real time.
10. The Road Ahead: A Smarter, Faster, Fairer Market
The future of HFT lies not in unrestrained speed but in intelligent automation, ethical oversight, and technological balance. As AI and quantum computing push the boundaries of possibility, the financial ecosystem must ensure that innovation does not compromise stability.
Regulators, exchanges, and traders will need to collaborate to create a framework where automation enhances efficiency while maintaining transparency and fairness.
In short, the next generation of high-frequency trading will be:
Smarter — driven by AI and predictive analytics.
Faster — with quantum and edge technologies.
Safer — through regulation, ethics, and human oversight.
The story of HFT is far from over—it’s merely entering its next, most intelligent chapter.

Understanding How Options Work: Calls and Puts Simplified1. What Are Options?
An option is a type of financial contract that gives the buyer the right, but not the obligation, to buy or sell an underlying asset (like a stock, index, or commodity) at a predetermined price (called the strike price) before or on a specific date (called the expiration date).
Think of options as insurance contracts — they allow you to protect, speculate, or leverage your positions in the market.
The buyer of the option pays a premium (price of the option).
The seller (also called the writer) receives this premium and is obligated to fulfill the contract if the buyer decides to exercise it.
There are two types of options:
Call Option – the right to buy an asset.
Put Option – the right to sell an asset.
2. Call Options Explained (The Right to Buy)
A call option gives the buyer the right to buy an underlying asset at the strike price within a certain period.
Let’s take an example:
Suppose Stock A is trading at ₹100. You buy a call option with a strike price of ₹105 for a premium of ₹3, expiring in one month.
This means:
You pay ₹3 per share for the right to buy Stock A at ₹105 any time before expiry.
If the stock price rises above ₹105, your option gains value because you can buy at ₹105 while the market price is higher.
Scenario 1: Stock goes up to ₹115 before expiry.
You can buy at ₹105 and immediately sell at ₹115 — making a profit of ₹10.
Your net profit = ₹10 (gain) - ₹3 (premium) = ₹7 per share.
Scenario 2: Stock stays below ₹105.
Your option is out of the money (no advantage in exercising it).
You lose only the premium paid (₹3).
So, a call option benefits from rising prices.
3. Put Options Explained (The Right to Sell)
A put option gives the buyer the right to sell an underlying asset at the strike price within a certain period.
Example:
Stock B is trading at ₹100. You buy a put option with a strike price of ₹95 for a premium of ₹2.
This means you have the right to sell Stock B at ₹95 even if the price falls.
Scenario 1: Stock falls to ₹85 before expiry.
You can sell at ₹95 while the market price is ₹85 — gaining ₹10.
Your net profit = ₹10 (gain) - ₹2 (premium) = ₹8 per share.
Scenario 2: Stock stays above ₹95.
You wouldn’t exercise your right to sell at ₹95 when the market offers ₹100.
You lose only the premium (₹2).
So, a put option benefits from falling prices.
4. Understanding Option Premiums
The premium is the price of the option, and it consists of two parts:
Intrinsic Value:
The amount by which an option is in the money.
For a call: Intrinsic Value = Current Price - Strike Price
For a put: Intrinsic Value = Strike Price - Current Price
Time Value:
Extra value because there’s still time left before expiration.
The longer the time to expiry, the higher the premium.
Example: If a call option on Stock A (price ₹110) has a strike of ₹100, it’s already ₹10 in the money. If the premium is ₹12, then ₹10 is intrinsic value and ₹2 is time value.
5. How Option Sellers Make Money
While buyers pay the premium and hope the market moves in their favor, option sellers profit if the market doesn’t move much.
Call Seller (Writer): Hopes the price stays below the strike price.
Put Seller (Writer): Hopes the price stays above the strike price.
If the option expires worthless, the seller keeps the entire premium. However, sellers face unlimited potential losses if the market moves sharply against them — which is why writing options requires higher margin and risk management.
6. Why Traders Use Options
Options are powerful because they offer multiple strategic uses:
a. Hedging (Protection)
Investors use options to protect existing positions.
Example: If you own a stock at ₹100 and fear a short-term decline, you can buy a put option at ₹95. If the stock falls, your put gains, offsetting the loss.
b. Speculation
Traders buy calls if they expect prices to rise or puts if they expect prices to fall. Because options cost less than the actual stock, they allow for higher leverage — magnifying potential returns.
c. Income Generation
Experienced traders sell (write) options to earn premiums, especially in sideways markets. Covered call writing and cash-secured puts are popular income strategies.
7. Option Moneyness: In, At, and Out of the Money
Understanding an option’s moneyness helps evaluate its worth.
In the Money (ITM): Already profitable if exercised.
Call: Market Price > Strike Price
Put: Market Price < Strike Price
At the Money (ATM): Market Price = Strike Price
Out of the Money (OTM): Not profitable if exercised.
Call: Market Price < Strike Price
Put: Market Price > Strike Price
For example, if a stock trades at ₹100:
₹90 call = ITM
₹100 call = ATM
₹110 call = OTM
8. Expiration and Time Decay (Theta Effect)
Every option has an expiration date — after which it becomes worthless.
As time passes, the time value portion of the premium decreases — this is known as time decay or theta.
Time decay accelerates as the option nears expiry. That’s why buyers usually prefer longer durations (more time value), while sellers prefer shorter ones (faster decay).
9. Risk and Reward Profile
Here’s how the payoff works for each type:
Call Buyer: Unlimited profit (as price rises), limited loss (premium).
Call Seller: Limited profit (premium), unlimited loss (if price soars).
Put Buyer: High profit (as price falls), limited loss (premium).
Put Seller: Limited profit (premium), high loss (if price crashes).
This asymmetry is what makes options both powerful and risky.
10. Real-World Example: A Simplified Scenario
Let’s take a complete example:
You believe Reliance Industries (trading at ₹2500) will rise. You buy a call option with a strike of ₹2550, paying ₹40 premium.
If Reliance rises to ₹2650 → Gain = ₹100 - ₹40 = ₹60 profit.
If Reliance stays below ₹2550 → Option expires worthless → Loss = ₹40.
Alternatively, if you think it will fall, you buy a put option with a strike of ₹2450 for ₹35.
If Reliance drops to ₹2350 → Gain = ₹100 - ₹35 = ₹65 profit.
If it stays above ₹2450 → Option expires worthless → Loss = ₹35.
11. Why Understanding Calls and Puts Matters
Options aren’t just tools for speculation — they’re also essential for managing market exposure and improving portfolio efficiency. Once you understand the behavior of calls and puts, you can combine them into advanced strategies like spreads, straddles, or iron condors — each designed for specific market outlooks.
12. Conclusion: Simplifying the Power of Options
At their core, call and put options are about flexibility. They allow you to control an asset without necessarily owning it, limit your downside while amplifying your upside, and customize your market exposure.
Call = Right to Buy (Bullish tool)
Put = Right to Sell (Bearish tool)
By mastering these basics, you lay the foundation for smarter trading decisions — whether your goal is profit, protection, or passive income. In the world of finance, knowledge of options doesn’t just open doors; it gives you the power to design your own opportunities.
Why Market Rotations Matter for Every Trader and Investor1. What Is Market Rotation?
Market rotation refers to the flow of money between different sectors, asset classes, or investment themes over time. It happens as investors shift their capital based on changing economic conditions, interest rates, inflation expectations, or risk appetite.
For example, during periods of economic recovery, investors often move money into cyclical sectors like banking, manufacturing, and real estate. In contrast, when the economy slows, funds often rotate into defensive sectors like healthcare, consumer staples, or utilities that provide stable earnings regardless of the cycle.
At its core, market rotation is like a dance — money never leaves the market entirely; it simply moves to where it expects the best performance next.
2. The Economic Cycle and Its Impact
Market rotations are deeply connected to the economic cycle, which includes four major phases: expansion, peak, contraction, and recovery.
Expansion: When growth is strong and confidence is high, investors prefer cyclical stocks like autos, financials, and industrials.
Peak: As the economy overheats, inflation rises, and interest rates climb, investors start trimming exposure to growth-heavy stocks.
Contraction: During slowdowns or recessions, investors seek safety in defensive sectors such as utilities, FMCG, and healthcare.
Recovery: When conditions improve again, capital flows back into riskier assets, including technology and small caps.
Recognizing where we are in the economic cycle helps traders and investors anticipate which sectors will lead and which will lag, improving portfolio allocation and timing.
3. Sector Rotation – The Heart of Market Dynamics
Sector rotation is one of the most visible forms of market rotation. It reflects how investors reallocate funds among various industries to capture relative strength.
For example:
When interest rates rise, banks and financials tend to benefit from higher lending margins.
When commodity prices surge, energy and metal stocks often outperform.
When technology innovation dominates, IT and digital sectors lead the charge.
Smart investors track sector rotation through indicators like the Relative Strength Index (RSI), moving averages, or relative performance charts to identify which areas of the market are gaining momentum.
Understanding sector rotation allows traders to be “in the right place at the right time,” maximizing returns while minimizing exposure to lagging industries.
4. Style Rotation – Growth vs. Value
Market rotations don’t only happen between sectors; they also occur between investment styles — primarily growth and value.
Growth stocks (like tech companies) thrive when the economy is expanding and interest rates are low.
Value stocks (like traditional industrials or financials) perform better when inflation and interest rates rise.
During the 2010s, growth stocks led global markets as central banks kept interest rates near zero. However, as inflation spiked post-2020, value sectors like energy and banking began to outperform.
Recognizing when the market is shifting from growth to value (or vice versa) helps traders realign portfolios early and avoid being caught on the wrong side of market trends.
5. Asset Rotation – Beyond Stocks
Market rotation also extends across asset classes. Investors move funds between equities, bonds, commodities, and even cash depending on macroeconomic trends.
For example:
When inflation rises, money often flows out of bonds (which lose value as yields rise) and into commodities like gold or oil.
During uncertainty, capital moves out of equities and into safe-haven assets like the U.S. dollar or government bonds.
When global liquidity improves, funds rotate back into risk assets like emerging markets and small caps.
For traders, tracking these inter-asset flows provides early signals of broader market shifts and risk sentiment changes.
6. How Traders Can Profit from Market Rotations
For traders, identifying early signs of sector or asset rotation can open up opportunities for high-probability trades.
Use volume and price action to detect institutional money flow. Rising volume in a sector ETF or leading stock often indicates the start of a rotation.
Track leadership changes: If defensive sectors start outperforming, it may signal risk aversion and potential correction.
Combine technical and fundamental signals: For example, use breakout patterns along with macro cues like inflation data or rate hikes.
Rotations often begin before the broader market realizes it, so being early gives traders a decisive advantage.
7. Long-Term Investors: Why It Matters Even More
Long-term investors benefit immensely from recognizing market rotations. Allocating capital to leading sectors during each stage of the economic cycle can dramatically enhance portfolio returns and stability.
For instance:
During recoveries, investors can overweight cyclicals and small caps.
As the economy matures, shift to growth and technology.
During downturns, emphasize defensives and high-dividend stocks.
This proactive rebalancing approach not only boosts returns but also reduces drawdowns during turbulent markets. In short, understanding rotations leads to smarter asset allocation and compounding performance.
8. Tools and Indicators to Track Rotations
A few popular tools and indicators can help identify market rotations early:
Relative Rotation Graphs (RRG): Visually map sector momentum and relative strength.
ETF Flows: Track where institutional money is moving through sector ETFs.
Breadth Indicators: Monitor how many stocks are participating in rallies or declines.
Volume Profile & Market Structure: Analyze how institutional volume shifts across price levels and sectors.
By combining these tools with macro awareness, investors can stay aligned with the flow of capital — the real engine of market performance.
9. Common Mistakes Traders Make During Rotations
Many traders and investors fail to recognize market rotations until it’s too late. Here are common pitfalls:
Chasing past winners: Buying tech at the top while money rotates to energy or value stocks.
Ignoring macro trends: Overlooking interest rate changes or inflation data that trigger sector shifts.
Emotional bias: Staying loyal to a sector even when it loses relative strength.
Avoiding these mistakes requires discipline, regular analysis, and the flexibility to adapt your strategy when the market narrative changes.
10. The Bottom Line – Follow the Flow, Not the Noise
Market rotations aren’t just another trading concept — they are the heartbeat of market behavior. They reveal where big money is moving and why. Whether you’re managing a short-term portfolio or building long-term wealth, understanding rotations helps you:
Anticipate market trends
Position in leading sectors early
Manage risk more effectively
Capture outsized returns through strategic allocation
In the end, successful trading and investing come down to aligning with where capital is flowing next — not where it has been. By mastering market rotations, you move from reacting to trends to predicting and profiting from them.
Why “Smart Choices” Matter in Mutual Fund Investing1. The Power of Informed Decision-Making
When you invest in a mutual fund, you’re essentially trusting a professional fund manager to invest your money across different assets like equities, bonds, or money market instruments. However, not all mutual funds are created equal. Each fund has its own investment strategy, risk profile, and objectives. A smart investor understands this and makes choices that align with their personal goals — such as capital appreciation, income generation, or wealth preservation.
For instance, someone saving for retirement in 20 years should not choose a short-term debt fund. Instead, an equity mutual fund with strong long-term growth potential would make more sense. Similarly, if an investor’s goal is to park funds for six months, equity mutual funds would be too volatile — a liquid or ultra-short-term fund would be more appropriate.
Smart investing starts with matching the fund’s characteristics with your financial goals. It’s not about chasing high returns; it’s about making the right choices for your situation.
2. Avoiding Emotional Traps and Market Noise
One of the biggest enemies of wealth creation is emotional decision-making. Many investors panic during market downturns or get carried away by bullish euphoria, switching funds or redeeming investments at the wrong time.
Making smart choices in mutual fund investing means staying disciplined. It means understanding that markets move in cycles and that volatility is part of the game. Smart investors don’t react to short-term fluctuations; they focus on long-term fundamentals.
For example, during a market correction, an impulsive investor might redeem their equity mutual fund holdings to “cut losses,” while a smart investor might see it as a chance to invest more at lower valuations — positioning themselves for stronger future gains.
Smart choices are guided by rational thinking and patience, not fear or greed.
3. Importance of Fund Selection
Fund selection is where the real “smart” in smart investing shows up. With thousands of mutual fund schemes available, it’s easy to get lost. But not all funds are good fits for every investor.
A smart investor looks beyond the marketing hype and flashy past returns. They analyze factors such as:
Fund performance consistency over different market cycles
Expense ratio (how much you pay in fees annually)
Fund manager’s experience and track record
Portfolio composition (which sectors and stocks the fund invests in)
Risk-adjusted returns — not just how much the fund earns, but how efficiently it earns it
For instance, two funds may both show 12% annual returns, but one might have taken significantly higher risk to achieve that. Smart investors prefer funds that deliver steady performance with controlled volatility.
4. Risk Management: The Core of Smart Investing
Every investment carries some level of risk — whether it’s market risk, credit risk, or interest rate risk. Smart choices help investors manage and balance these risks.
A common mistake is assuming that higher returns automatically mean better investments. In reality, higher returns often come with higher risks. Smart investors diversify across asset classes (equity, debt, gold, etc.) and fund categories (large-cap, mid-cap, hybrid, etc.) to reduce the impact of any one sector or asset’s underperformance.
Moreover, they regularly review their portfolios to ensure the asset allocation still matches their risk tolerance and life goals. For example, a 30-year-old might have 80% equity exposure, but by age 50, they might gradually shift to a more balanced or debt-heavy portfolio.
Smart risk management isn’t about avoiding risk — it’s about understanding and controlling it.
5. The Compounding Effect: Reward for Smart Patience
Mutual fund investing rewards those who make smart, consistent, and patient choices. The real power of mutual funds lies in compounding — the ability of your returns to generate more returns over time.
For instance, investing ₹10,000 per month for 20 years at a 12% annual return grows to over ₹98 lakh. But stopping after just 10 years would result in only ₹23 lakh — a huge difference driven purely by time and discipline.
Smart investors understand that time in the market is more important than timing the market. They stick with their investment plans, stay invested through ups and downs, and allow compounding to do its magic.
6. Reviewing and Rebalancing: Staying Smart Over Time
Making smart choices isn’t a one-time activity — it’s an ongoing process. Markets evolve, economic conditions change, and personal financial goals shift over time.
Smart investors regularly review their portfolios — at least once or twice a year — to ensure that their funds are performing as expected and are still aligned with their objectives. If a particular fund consistently underperforms or no longer fits the investor’s strategy, a smart reallocation may be needed.
This process, known as portfolio rebalancing, ensures that investors don’t become overexposed to certain sectors or asset classes unintentionally. For instance, if equity markets rally and equity holdings grow disproportionately, the investor may shift some funds back to debt instruments to maintain balance.
7. Tax Efficiency: A Key Part of Smart Choices
Smart investors also consider tax implications when choosing mutual funds. Different types of funds are taxed differently:
Equity mutual funds attract 10% long-term capital gains tax if held for more than one year (above ₹1 lakh).
Debt funds, on the other hand, are taxed at the investor’s slab rate for gains after three years.
Investors can also take advantage of tax-saving mutual funds (ELSS) under Section 80C, which provide both wealth creation and tax benefits.
Being tax-smart enhances net returns and ensures that more of your earnings stay in your pocket rather than going to the tax department.
8. The Role of SIPs in Making Smart Choices
Systematic Investment Plans (SIPs) are one of the smartest tools available in mutual fund investing. They allow investors to invest small amounts regularly, removing the burden of timing the market. SIPs help average out the cost of investment through rupee-cost averaging and instill financial discipline.
By investing monthly instead of making lump-sum contributions, investors can navigate market volatility more effectively. SIPs also make it easier to stay consistent — a hallmark of smart investing.
9. Learning from Mistakes and Evolving
Even the smartest investors make mistakes. What separates successful investors from the rest is their ability to learn and adapt. Smart choices involve not just knowledge, but also self-awareness — understanding one’s biases, emotions, and limitations.
Over time, smart investors refine their strategies, stay updated with market trends, and make better decisions based on experience and data.
10. Conclusion: Smart Choices Build Wealth, Not Luck
Mutual fund investing is one of the most effective ways to grow wealth over time — but it demands smart decision-making at every step. Choosing the right fund, staying disciplined, managing risk, reviewing performance, and maintaining long-term patience all contribute to financial success.
Smart choices are not about predicting the market or chasing short-term gains. They’re about aligning investments with goals, managing emotions, and staying consistent.
In the end, the real difference between an average investor and a successful one isn’t luck — it’s the ability to make smart, informed, and disciplined choices in mutual fund investing.

The Hidden Potential of the Stock Market1. Beyond the Ticker: The Real Purpose of the Stock Market
At its core, the stock market was never just a gambling table for quick money. It was designed as a mechanism to raise capital for businesses and distribute ownership among the public. Every share you buy represents a slice of a real company—an entity that creates products, provides services, employs people, and drives the economy forward.
This means that by investing in the stock market, you are indirectly participating in the growth of industries—whether it’s technology shaping the digital world, renewable energy driving sustainability, or pharmaceuticals improving global health. The hidden potential here is not just in the price appreciation of a stock, but in the participation in the broader evolution of the global economy.
2. The Power of Compounding: Turning Time into Wealth
One of the greatest secrets of the stock market is the magic of compounding returns. This principle, often called the “eighth wonder of the world,” allows money to grow exponentially over time. When your investments generate earnings, and those earnings in turn generate more earnings, the effect multiplies.
For example, an investor who puts ₹1 lakh into a quality stock portfolio that grows at 12% per year could see that investment become over ₹10 lakh in 20 years—without adding another rupee. This growth doesn’t come from speculation but from patience, discipline, and the market’s natural tendency to reward long-term holders.
The hidden potential of compounding teaches investors that the real power lies not in predicting tomorrow’s market move, but in staying invested through the market’s cycles and letting time do the heavy lifting.
3. The Innovation Engine: How the Market Fuels Progress
Every major technological leap—from smartphones to electric cars—has been powered by capital raised in stock markets. When companies go public through IPOs, they unlock vast sums of money from millions of investors. This funding allows businesses to innovate, expand, and create breakthroughs that reshape industries.
Think of companies like Infosys, TCS, or Reliance Industries in India. Their access to public capital markets has enabled them to scale globally, employ hundreds of thousands, and transform entire sectors. As an investor, owning shares in such companies means being part of that transformative journey.
The hidden potential here lies in innovation ownership—you’re not just buying stock; you’re buying into the future of human progress.
4. Market Volatility: A Masked Opportunity
To many, volatility is the enemy of investing. But to those who understand the market’s hidden potential, volatility is a friend in disguise. Price swings often cause fear, leading many to sell at lows or hesitate during uncertain times. Yet, for disciplined investors, these moments create opportunities to buy strong businesses at discounted prices.
Legendary investor Warren Buffett’s wisdom applies here: “Be fearful when others are greedy, and greedy when others are fearful.” The stock market’s temporary declines are often preludes to long-term gains. Historically, every major crash—from 2008’s financial crisis to 2020’s pandemic slump—was followed by record recoveries.
Thus, the hidden potential of volatility lies in its ability to create entry points for those with patience, courage, and conviction.
5. The Role of Knowledge and Psychology
While financial education is essential, understanding human psychology is equally critical in unlocking the stock market’s hidden potential. Most investors fail not because they lack information, but because they lack emotional control. Fear, greed, and herd mentality can destroy even the most well-researched portfolios.
The best investors know how to separate noise from knowledge. They focus on company fundamentals—earnings, management quality, and long-term prospects—rather than short-term price fluctuations. By mastering emotional discipline, an investor turns the market from a psychological battlefield into a tool for building generational wealth.
In short, the hidden potential of the market can only be revealed when the investor conquers their own impulses.
6. Diversification: The Silent Protector
Another layer of hidden potential lies in the principle of diversification. The stock market offers access to a vast universe of industries, geographies, and asset classes. A well-diversified portfolio not only reduces risk but also enhances returns over time.
By spreading investments across sectors—like banking, FMCG, infrastructure, and IT—investors can protect themselves from downturns in any one industry. Similarly, investing across large-cap, mid-cap, and small-cap stocks balances stability with growth potential.
Diversification transforms the unpredictable nature of markets into a more predictable, manageable wealth-building system.
7. The Rise of Retail Investors and Digital Empowerment
Technology has democratized access to the stock market like never before. Online trading platforms, mobile apps, and educational content have made investing easy and affordable for everyone. The new generation of investors no longer needs to rely solely on brokers or institutions—they can analyze, trade, and invest independently.
This digital revolution is unlocking the hidden potential of millions of small investors. Even with modest sums, retail participants can now build strong portfolios, invest in IPOs, and benefit from real-time market data.
India’s rapid increase in Demat accounts—crossing 150 million by 2025—is proof that the hidden potential of the stock market is reaching the masses. The power once concentrated among the few is now in the hands of everyday people.
8. The Economic Ripple Effect
The hidden potential of the stock market extends beyond personal gains—it has a ripple effect on the entire economy. When markets thrive, companies expand, employment rises, and government revenues grow. Consumer confidence strengthens, creating a positive feedback loop of growth.
Moreover, stock investments help channel domestic savings into productive assets rather than idle deposits. This efficient allocation of capital is what fuels sustainable economic development. Thus, a vibrant stock market is not just a reflection of economic growth—it’s a driver of it.
9. The Future Ahead: Sustainable and AI-Driven Markets
The future of the stock market lies in sustainability, innovation, and technology integration. With AI-driven analysis, data-backed investing, and ESG (Environmental, Social, and Governance) principles gaining traction, markets are becoming smarter and more responsible.
Investors who adapt to these trends can unlock new layers of hidden potential. Green energy companies, tech disruptors, and AI-driven platforms are likely to dominate the next decade. Recognizing these shifts early can be the difference between ordinary returns and extraordinary wealth.
Conclusion: Seeing Beyond the Obvious
The stock market’s hidden potential lies not in daily price swings but in its long-term ability to build wealth, fuel innovation, and shape economies. It rewards those who understand patience over prediction, discipline over emotion, and conviction over fear.
In every market correction lies an opportunity. In every innovation lies a seed of exponential growth. And in every share lies a story—of human ambition, resilience, and progress.
For those who look beyond the numbers and see the narrative, the stock market isn’t just an investment platform—it’s a gateway to limitless potential.
Introduction: India’s Infrastructure Revolution and Market Impac1. The Infrastructure Revolution: A Historical Turning Point
Infrastructure has always been the backbone of economic growth. However, India’s earlier attempts at large-scale infrastructure expansion often suffered from policy bottlenecks, inadequate funding, and execution delays. The recent decade marks a fundamental shift — from fragmented planning to integrated development.
Under initiatives like the National Infrastructure Pipeline (NIP), PM Gati Shakti, and Smart Cities Mission, India is modernizing its roads, railways, ports, and energy networks with unprecedented scale and coordination. The NIP alone envisions an investment of over ₹111 lakh crore across sectors such as energy, transport, water, and social infrastructure by 2025.
This surge is not limited to government spending. Public-Private Partnerships (PPPs), sovereign wealth funds, and global investors are increasingly financing infrastructure projects, drawn by India’s growth potential and improving regulatory frameworks.
2. Policy Push: The Catalyst for Change
The infrastructure revolution owes much to strategic policy direction. The government has implemented structural reforms aimed at accelerating project execution, reducing red tape, and ensuring transparency in tendering and funding.
Some of the most influential initiatives include:
PM Gati Shakti National Master Plan (2021): A digital platform that integrates 16 ministries to ensure coordinated planning and implementation of infrastructure projects.
Bharatmala and Sagarmala Projects: Focused on improving road and port connectivity to enhance logistics efficiency.
Dedicated Freight Corridors (DFCs): Designed to ease congestion on railway lines and boost freight movement.
Smart Cities and AMRUT: Targeted towards urban transformation through improved utilities, mobility, and housing.
National Monetization Pipeline (NMP): Monetizing existing assets to fund new projects, reducing fiscal burden while attracting private capital.
Together, these programs mark a shift from infrastructure “creation” to infrastructure “optimization,” ensuring long-term economic dividends.
3. Economic Impact: A Multiplier for Growth
The infrastructure push has a ripple effect across the economy. Each rupee invested in infrastructure generates a multiplier impact of approximately 2.5 to 3 times on GDP.
Here’s how:
Employment Generation: Large-scale projects create millions of direct and indirect jobs, particularly in construction, manufacturing, and logistics sectors.
Improved Productivity: Efficient logistics and transport reduce travel time, lower costs, and boost competitiveness for businesses.
Urbanization and Real Estate Growth: Enhanced connectivity fuels urban expansion, leading to increased demand for housing, retail, and industrial spaces.
Investment Magnet: Stable infrastructure attracts foreign direct investment (FDI), especially in sectors like manufacturing, renewable energy, and technology parks.
Regional Development: Projects in tier-2 and tier-3 cities are reducing regional disparities, promoting balanced growth.
According to estimates, infrastructure could contribute nearly 10% to India’s GDP by 2030, transforming the nation into a global manufacturing and logistics hub.
4. Stock Market Impact: The Infrastructure Theme Takes Center Stage
India’s stock markets have responded positively to this infrastructure wave. Investors see this as a multi-decade opportunity across several interconnected sectors.
a. Core Infrastructure Stocks
Companies in construction, engineering, and heavy machinery — such as Larsen & Toubro, IRB Infrastructure, KNR Construction, and NBCC — are witnessing strong order inflows and improved margins.
b. Cement and Steel
Demand for building materials is soaring. Cement majors like UltraTech, ACC, and Dalmia Bharat, and steel producers like Tata Steel and JSW Steel, have benefited from the government’s spending spree.
c. Capital Goods and Equipment
Firms like Siemens, ABB India, and Cummins are riding the wave of infrastructure electrification, metro projects, and industrial automation.
d. Logistics and Transport
The development of multi-modal transport networks boosts companies in logistics and warehousing, such as Container Corporation of India, TCI Express, and Adani Ports.
e. Ancillary Sectors
Power, renewable energy, and urban development firms are integral beneficiaries of the infrastructure ecosystem. For instance, NTPC, Power Grid Corporation, and Adani Energy Solutions are vital to India’s grid modernization.
Thus, the infrastructure theme has become one of the strongest investment narratives in India’s equity market, attracting both domestic and foreign institutional investors.
5. Financing the Boom: Innovative Funding Models
Financing India’s infrastructure ambitions requires creativity beyond traditional budget allocations. To address this, the government and private sector are leveraging multiple instruments:
Infrastructure Investment Trusts (InvITs) and Real Estate Investment Trusts (REITs) are unlocking liquidity by monetizing assets like roads, power transmission lines, and commercial real estate.
Green Bonds and Masala Bonds are mobilizing international capital for sustainable projects.
Sovereign Wealth Funds and Pension Funds from countries like Canada, Singapore, and the UAE are increasingly investing in long-term Indian infrastructure assets.
Development Finance Institutions (DFIs), such as the National Bank for Financing Infrastructure and Development (NaBFID), provide specialized financing for large-scale projects.
This diversification of funding sources ensures that India’s infrastructure revolution is both financially sustainable and globally integrated.
6. Challenges on the Road Ahead
Despite remarkable progress, several challenges persist:
Execution Delays: Land acquisition, environmental clearances, and litigation can slow project timelines.
Cost Overruns: Inflation in construction materials and logistical inefficiencies can erode profitability.
Private Participation Risks: Uncertain returns and policy changes can deter private investment.
Skill Shortage: The sector still faces a lack of skilled labor, especially in high-tech construction and project management.
Environmental Concerns: Balancing rapid development with ecological sustainability remains a critical challenge.
Addressing these issues will require continued policy refinement, institutional strengthening, and technological innovation.
7. Future Outlook: India’s Infrastructure Decade
Looking ahead, the 2020s are likely to be remembered as India’s “Infrastructure Decade.” The focus is now expanding beyond traditional construction to include digital infrastructure, green mobility, renewable energy, and sustainable cities.
Digital India and 5G rollout will connect even the remotest regions, enabling inclusive growth.
Renewable energy projects, targeting 500 GW by 2030, will redefine India’s energy landscape.
High-speed rail networks and metro expansion will modernize urban transport.
Smart logistics parks and industrial corridors will make India a global manufacturing powerhouse.
With urbanization accelerating and global investors viewing India as a growth engine, infrastructure will continue to be the foundation of the nation’s economic narrative.
Conclusion: The Market’s Golden Era of Infrastructure
India’s infrastructure revolution is more than a construction story — it’s a transformation of the nation’s economic DNA. It intertwines policy reform, financial innovation, and market opportunity. As roads, railways, ports, and data highways connect the nation, they are also connecting investors to one of the most promising growth stories in the world.
The infrastructure-led growth model not only drives GDP expansion but also deepens India’s capital markets, generates employment, and enhances global competitiveness. For investors and policymakers alike, India’s infrastructure revolution represents both an opportunity and a responsibility — to build a future that is strong, sustainable, and inclusive.
In essence, this is not merely an infrastructure boom; it’s the building of “New India” — brick by brick, byte by byte, and vision by vision.
AI-Driven Economies: Boon or Inflation Trap?1. The Economic Boon of AI
a. Productivity Revolution
One of AI’s most powerful contributions lies in its ability to enhance productivity. Unlike previous technological shifts that replaced physical labor, AI enhances cognitive productivity. Algorithms can analyze massive datasets, make real-time decisions, and optimize operations that humans could never process at similar speed or accuracy.
For instance, AI-driven automation in manufacturing reduces downtime, minimizes errors, and lowers production costs. In the service sector, AI chatbots and recommendation engines improve customer experiences while cutting operational costs. As a result, output per worker increases — a key driver of GDP growth.
b. Innovation and New Industry Creation
AI is not just optimizing existing industries but creating entirely new ones. The rise of autonomous vehicles, robotics, healthcare analytics, and smart agriculture represents multibillion-dollar markets built around AI innovation. These new sectors attract massive investment, stimulate entrepreneurship, and create high-value jobs in data science, engineering, and software development.
The global AI market, projected to surpass $2 trillion by 2030, has become a cornerstone of modern industrial policy. Nations investing early in AI infrastructure, like the U.S., China, and India, are positioning themselves as leaders in the next phase of the digital economy.
c. Efficiency in Resource Allocation
AI systems enable more efficient use of resources — energy, raw materials, and capital. In agriculture, AI optimizes irrigation and fertilizer use; in finance, it reduces bad loans through predictive risk models; and in logistics, it minimizes fuel consumption by optimizing routes. These efficiencies reduce costs and environmental impact simultaneously — a win-win scenario for businesses and governments alike.
d. Deflationary Forces in the Short Term
Interestingly, AI can initially act as a deflationary force. As automation increases, the cost of goods and services tends to drop because of higher productivity and lower labor costs. For example, AI-driven manufacturing allows companies to produce more at lower costs, passing savings on to consumers. This short-term price stability often supports economic expansion and higher consumer spending.
2. The Inflation Trap: Hidden Risks of AI-Driven Economies
While the short-term gains from AI appear promising, long-term structural challenges could create inflationary pressures and social imbalances.
a. Unequal Distribution of Wealth
AI-driven productivity gains do not always benefit everyone equally. Large corporations that own AI technologies and data infrastructure accumulate significant economic power, while smaller firms and low-skilled workers struggle to keep up. This wealth concentration leads to income inequality, which indirectly fuels inflationary cycles.
When profits are concentrated in a few hands, consumer demand may become skewed — luxury goods prices rise, while basic goods and wages stagnate. As the middle class shrinks, governments may increase fiscal spending and social programs to stabilize consumption, adding inflationary pressure to the system.
b. Wage Polarization and Cost-Push Inflation
AI often automates repetitive, low-skill jobs while creating demand for high-skill technical roles. This “job polarization” leads to wage growth at the top and stagnation at the bottom. Over time, this could produce cost-push inflation, especially in sectors like healthcare, education, and housing — where human labor remains essential and costs cannot easily be automated.
Moreover, displaced workers may require retraining or government support, which increases fiscal spending. This government-driven stimulus, though necessary, can also be inflationary if not managed carefully.
c. Overreliance on Technology and Supply Constraints
AI systems depend on complex supply chains — semiconductors, rare earth elements, and high computing infrastructure. If supply disruptions occur (like during the 2020–2022 global chip shortage), the cost of AI deployment could spike dramatically. Such shortages can trigger supply-side inflation, as companies raise prices to offset rising input costs.
d. Productivity Paradox and the Lag Effect
Historically, major technological innovations take years to translate into widespread productivity gains. While AI promises long-term efficiency, short-term disruptions — such as job losses, retraining costs, and restructuring — can slow growth. If governments and central banks anticipate faster gains than reality delivers, they may overstimulate the economy through loose monetary or fiscal policy, unintentionally fueling inflation.
e. Data Monopoly and Market Power
Another inflationary risk comes from AI-driven monopolies. As large tech firms dominate AI data and computing ecosystems, competition declines. With fewer players controlling markets, they gain pricing power. For instance, if a handful of companies control AI chips or cloud computing, they can increase prices with little resistance — embedding inflation within critical digital infrastructure.
3. The Policy Balancing Act
The challenge for policymakers is to harness AI’s growth potential without allowing it to destabilize inflation and inequality.
a. Investing in Human Capital
Education and reskilling programs are essential to help workers adapt to AI-driven changes. By closing the skill gap, governments can prevent mass unemployment and wage stagnation — two key sources of inflationary pressure. Encouraging AI literacy at all education levels ensures that the workforce evolves alongside technology.
b. Strengthening Competition and Regulation
To prevent monopolistic practices, policymakers must enforce antitrust laws and promote open data ecosystems. Encouraging small and medium enterprises (SMEs) to adopt AI through subsidies or shared platforms can democratize productivity gains, spreading benefits more evenly across the economy.
c. Smart Monetary Policy
Central banks face a unique challenge: distinguishing between AI-driven deflation (from productivity) and AI-driven inflation (from inequality or bottlenecks). Adaptive monetary policies — including real-time data analysis powered by AI itself — could help maintain balance.
d. Sustainable AI Infrastructure
AI consumes significant energy and computing resources. Building green, efficient data centers and investing in renewable energy reduces the risk of cost-driven inflation tied to energy usage.
4. The Long-Term Outlook
If managed wisely, AI could usher in a new era of sustainable, inclusive growth. Imagine economies where AI predicts demand accurately, minimizes waste, and boosts productivity across industries — from healthcare diagnostics to energy optimization. However, without careful regulation and equitable access, AI could deepen divides, distort price structures, and trap economies in persistent inflation.
The real test will be governance — how nations balance innovation with fairness. Economies that combine AI adoption with strong education systems, ethical regulation, and transparent competition policies will likely emerge as winners. Those that allow monopolies, inequality, and resource inefficiencies to spread may find themselves facing an inflationary storm masked as progress.
Conclusion
AI-driven economies are neither pure blessings nor inherent traps — they are complex ecosystems shaped by human choices. Artificial Intelligence can unlock enormous wealth and efficiency, but it can also magnify inflationary risks if benefits are unevenly distributed or poorly regulated.
The future of AI in economics depends not only on technological progress but on policy foresight. Governments, corporations, and societies must collaborate to ensure that AI serves as a tool for inclusive growth rather than a catalyst for inflationary instability. The question, therefore, is not whether AI will reshape economies — it already is — but whether we can guide its power wisely enough to ensure prosperity without falling into the inflation trap.

Chart Analysis: EIGEN / USDT (Daily Timeframe)Pattern: Bullish Hammer Reversal (Demand Zone Reaction)
The chart shows EIGEN forming a Bullish Hammer pattern right above its last demand zone, indicating that buyers are defending this critical support level. This setup suggests a potential short-term reversal and a shift in momentum from bearish to bullish.
Key Observations
🔹 Demand Zone: $0.70 – $0.75 — acting as the last major accumulation area where buying pressure is visible.
🔹 Supply Zone: $1.10 – $1.20 — serves as the next key resistance where sellers may step in.
🔹 Bullish Hammer Pattern: Signals possible end of the downtrend and early signs of recovery momentum.
🔹 Bull Bear Power (BBP): Currently improving from deep negative territory (−0.30), showing decreasing bearish pressure and gradual bullish momentum build-up.
🔹 Structure: Price is attempting a rebound from a long-term support base, potentially setting up for a trend reversal if confirmed by higher highs in the coming sessions.
Potential Move
If EIGEN sustains above $0.75, the next upside targets could be:
🎯 Target 1: $0.92 — short-term resistance.
🎯 Target 2: $1 — The Physicologycal Number.
A breakdown below $0.70, however, could invalidate the setup and open room for further downside.
Summary:
EIGEN is showing a bullish hammer reversal at a critical demand zone, with improving BBP momentum suggesting that sellers are losing control. A sustained hold above $0.75 may trigger a recovery rally toward the $0.92–$1.15 range.
#coinpediamarkets #EIGEN #CryptoAnalysis #EIGENUSDT #TechnicalAnalysis #CryptoTraders #DemandZone #SupplyZone

Nifty Intraday Analysis for 06th November 2025NSE:NIFTY
Index has resistance near 25775 – 25825 range and if index crosses and sustains above this level then may reach near 25975 – 26025 range.
Nifty has immediate support near 25400 – 25350 range and if this support is broken then index may tank near 25200 – 25150 range.
