Steps Involved in Executing a Trade1. Identifying the Trading Opportunity
The trade execution process begins long before clicking the buy or sell button. The first step is identifying a valid opportunity. Traders use various methods based on their style—technical analysis, fundamental analysis, or a combination of both.
Technical traders look for chart patterns, indicators, trends, support/resistance zones, or momentum signals.
Fundamental traders analyze earnings, macroeconomic news, sector trends, and company performance.
Algorithmic systems scan markets automatically based on coded rules.
A good opportunity must meet specific criteria defined in the trader’s strategy. This ensures you follow a systematic approach rather than making impulsive decisions.
2. Conducting Market Analysis and Confirmation
Once an opportunity is spotted, the next step is to confirm the trade. This involves deeper analysis to avoid false signals or emotional trades.
Technical Confirmation
Checking multiple timeframes
Validating trends
Reading candlestick patterns
Confirming indicator signals (RSI, MACD, moving averages)
Fundamental Confirmation
Monitoring economic releases
Checking for earnings announcements
Evaluating sector strength
Understanding market sentiment
Without confirmation, traders risk entering low-quality trades.
3. Determining Entry and Exit Levels
Before placing the trade, traders clearly define:
Entry Point
The exact price level where the trade should be opened. Professional traders do not “guess” entry—they plan it.
Stop-Loss Level
This is the maximum acceptable loss. Setting a stop-loss:
Protects capital
Removes emotional decision-making
Prevents large unexpected losses
Target or Take-Profit Level
A predetermined price at which the trader will exit with profit. Having targets:
Encourages disciplined exits
Helps calculate risk-reward ratio
Avoids holding too long
For example:
If you risk ₹10 to make ₹30, your risk-reward is 1:3—an excellent setup.
4. Calculating Position Size
This step separates professionals from amateurs. Position sizing ensures the trader does not over-expose their capital.
Factors considered:
Account size
Maximum risk per trade (usually 1%–2%)
Stop-loss distance
Volatility of the asset
Proper position sizing ensures survival in the long run. A trader who risks a small percentage of capital per trade can withstand market fluctuations without blowing up the account.
5. Choosing the Right Order Type
Execution depends heavily on the order type used. Different orders serve different purposes:
Market Order
Executes immediately at the current market price. Ideal for:
Fast-moving markets
When speed matters more than exact price
Limit Order
Executes only at a specific price or better. Best for:
Precise entries
Avoiding slippage
Stop-Loss Order
Automatically exits the trade at a set price to limit losses.
Stop-Limit Order
Combines stop and limit conditions. Useful when traders want price control with conditional execution.
Understanding order types helps avoid mistakes like entering at a wrong price or missing an important exit.
6. Executing the Trade
At this stage, the order is sent to the broker or exchange for execution. Key points include:
Ensuring no network delay or order mismatch
Double-checking quantity and price
Watching for slippage in volatile markets
Using fast execution for intraday or scalping traders
For algorithmic traders, execution is automated, but still depends on server speed, order routing, and liquidity.
7. Monitoring the Trade After Execution
Once the trade is live, monitoring becomes essential. Traders watch:
Price action
Volume changes
Market reactions to news
Key support or resistance levels
Active monitoring ensures quick decision-making if the market moves unexpectedly. Many traders adjust their stop-loss to breakeven once the trade moves in their favor—a technique called trailing stop.
8. Managing the Trade
Trade management determines long-term profitability more than entries. It includes:
Adjusting Stop-Loss
As the trade becomes profitable, the stop-loss can be moved closer to lock in gains.
Scaling In
Adding more quantity when the trend strengthens.
Scaling Out
Reducing exposure gradually by taking partial profits.
Exiting Early
If conditions change or the setup becomes invalid, exiting early protects capital.
Managing a trade requires discipline, flexibility, and understanding market behavior.
9. Closing the Trade
The trade is eventually closed at:
Stop-loss
Take-profit
Manual exit
Time-based exit
Closing a trade is not the end—it triggers reflection and learning. A calm and systematic exit reduces regret and emotional pressure.
10. Recording the Trade in a Journal
Successful traders record every trade. A trading journal includes:
Entry and exit price
Stop-loss and target
Reason for trade
Outcome
Emotions during the trade
A properly maintained journal reveals patterns of strengths and weaknesses.
For example:
You may discover you overtrade during volatile news
You may find certain setups work better than others
You may see that trades without stop-loss usually fail
Journaling helps refine strategies and improve decision-making.
11. Reviewing Performance and Optimizing Strategy
After recording the trade, traders review and analyze their performance weekly or monthly. This step focuses on:
Accuracy rate
Risk-reward ratio
Win/loss consistency
Emotional discipline
Strategy adjustments
Continuous improvement is the backbone of long-term trading success. Markets evolve, and traders must adapt to changing conditions.
Conclusion
Executing a trade is not simply buying or selling an asset; it is a disciplined process involving research, planning, risk management, execution, monitoring, and review. Each step—from identifying an opportunity to journaling the result—contributes to consistent profitability. Traders who follow this structured approach remove emotions from trading, make better decisions, and build a strong foundation for long-term success in the financial markets.
Contains image
Core Principles of Intraday Scalping Strategy1. Precision in Entry and Exit Timing
The heart of scalping lies in flawless timing. Since each trade aims to capture only a few ticks or points, even a slight delay can turn a winning trade into a losing one. Scalpers rely heavily on lower time frames such as the 1-minute, 3-minute, or 5-minute charts to pinpoint micro-trends and volatility spikes.
To achieve precision, traders often utilize tools such as:
Level 2 market depth
Order flow analysis
Volume-profile clusters
Price action patterns like micro pullbacks, breakouts, and retests
Perfect timing means entering before the move accelerates and exiting as soon as momentum shows signs of exhaustion. Overstaying in a position almost always leads to unnecessary risk.
2. Emphasis on Liquidity and Tight Spreads
Liquidity is the lifeblood of scalping. To get in and out quickly at favorable prices, a trader must operate in markets where buyers and sellers are constantly active. High liquidity reduces slippage, ensures tight bid-ask spreads, and allows traders to execute multiple positions efficiently.
In equities, scalpers usually pick:
High-volume large-cap stocks
Liquid index constituents
Instruments with narrow spreads
In forex or commodities, they prefer major pairs or index futures like NIFTY, BANKNIFTY, S&P500, gold, etc.
The tighter the spread, the easier it becomes for scalpers to break even and lock in small profits.
3. Risk Management Above Everything
Even though scalpers aim for small profits, the risk can escalate quickly if stops are not strictly executed. A single large loss can wipe out the gains of 20–30 successful scalps. Hence, risk management is not optional—it is the foundation.
Key risk principles include:
Fixed stop-loss orders for every single trade
Using smaller position sizes relative to capital
Defining daily maximum loss limits (stop trading after it hits)
Risk-to-reward ratios tailored for frequent exits, often 1:1 or even slightly lower, because the win rate compensates for it
Professional scalpers also avoid revenge trading and never compound losses by adding to a losing position.
4. High Win Ratio with Controlled Losses
Scalping depends on high trade accuracy. Unlike position trading where a few large wins can overcome many small losses, scalping thrives on consistency. A win-rate of 60–75% is typical among successful practitioners.
The core principle is simple:
Take small, consistent wins and cut losing trades instantly.
Losing trades must be kept extremely small, often exiting within seconds if the price does not move as expected. The edge lies not in the size of the profit but in the frequency and accuracy.
5. Reading Momentum and Micro-Trends
Momentum is everything in scalping. Traders must develop the ability to sense the strength of price movement in real time. This involves:
Watching consecutive green or red candles
Observing volume surges
Tracking sudden imbalances in buying or selling pressure
Identifying micro pullbacks and continuation setups
Momentum trading is especially effective during:
Opening market hours
Breakouts of key intraday levels
News releases
Strong trending sessions
Scalpers avoid sideways, choppy markets because the probability of whipsaws increases significantly.
6. Clear and Repeatable Strategy Setup
Successful scalpers do not improvise on the spot. They follow one highly refined setup or at most two. Their repeatable strategy might involve:
Breakout scalping
VWAP bounce/reversal scalping
Order-flow imbalance scalping
EMA crossover with momentum confirmation
Liquidity sweep and immediate reversal entry
The more precise and repetitive the setup, the quicker the execution. Scalpers aim for muscle-memory trading, where they instantly recognize setups with minimal hesitation.
7. Discipline and Emotional Stability
Scalping can be psychologically intense. Trades open and close within seconds. Markets can reverse rapidly, and rapid-fire decision-making can trigger emotional responses like fear, greed, and frustration.
Core psychological principles include:
Avoiding FOMO entries
Remaining patient until the perfect setup appears
Not increasing position size to recover losses
Maintaining calm during rapid market movements
Mental discipline is what separates consistent scalpers from impulsive traders who burn out quickly.
8. Technology and Speed of Execution
Since scalping requires ultra-fast entries and exits, traders depend on high-quality trading infrastructure:
Low-latency internet connection
High-performance trading platform
Hotkeys for quick order execution
Advanced charting tools
Direct market access (DMA) brokers when available
Even a one-second delay in order execution can significantly affect profitability.
9. Focus on Market Structure and Key Intraday Levels
Scalpers must understand the structure of the market at a micro level. Before trading, they identify key levels such as:
Previous day’s high/low
Opening range breakout (ORB) levels
VWAP and standard deviations
Fibonacci intraday zones
Fair value gaps (FVGs)
Supply and demand zones
Trading around these levels provides natural liquidity, momentum bursts, and clearer direction.
10. Small Profit Targets, but High Frequency
Scalpers aim for 0.1% to 0.5% price movements. The strategy works because trades are frequent. Instead of chasing a big move, they accept whatever the market offers quickly and consistently.
A typical scalper may aim for:
10–50 trades per session
5–10 points in index futures per trade
0.05–0.2% move in stocks
Frequent partial exits to secure gains
Small wins accumulate rapidly, resulting in steady returns.
11. Adaptability to Changing Market Conditions
Markets behave differently across sessions. Some days are trending strongly; others are range-bound or news-driven. A scalper must adapt:
Trade more aggressively in high momentum
Reduce size during consolidation
Avoid trading before major news if spreads widen
Block trading during highly unpredictable spikes
Adaptability is a key edge because scalping cannot be performed blindly.
12. Strict Trading Journal and Performance Review
Data is the scalper’s ultimate teacher. Keeping a detailed trading journal helps identify:
Win/loss patterns
Best performing setups
Error tendencies
Psychological weaknesses
Times of day with highest accuracy
Weekly reviews allow scalpers to continuously refine their strategy and improve execution.
Conclusion
Intraday scalping is a skill-based, high-concentration trading method that demands discipline, speed, and a systematic approach. Its core principles revolve around precision, risk management, liquidity, momentum reading, and psychological control. While the profits per trade are small, the cumulative gains can be significant when the strategy is executed consistently. By mastering these principles and maintaining emotional stability, traders can turn scalping into one of the most rewarding—yet challenging—forms of intraday trading.
Best Timeframes for Candle PatternsCommon Mistakes Traders Make
Relying only on candle patterns without context
Trading patterns blindly without trend confirmation
Not waiting for candle close
Ignoring volume
Forcing patterns where there are none
Using too many candlestick rules
Candlestick patterns should be signals, not guarantees.

Best Timeframes for Chart PatternsHow to Trade Chart Patterns
Here is a simple, structured approach:
1. Identify the pattern early
Use clean charts, avoid too many indicators, and focus on structure. Patterns become clearer with practice.
2. Mark support and resistance levels
These levels act as breakout zones. Always confirm with a trendline or neckline.
3. Wait for a breakout
Never assume. Patterns are confirmed only when price breaks key levels.
4. Check volume
Higher volume on breakout adds confidence. Without volume support, avoid entering.
5. Set stop-losses
Place SL beyond pattern boundaries—e.g., outside triangles or below neckline.
6. Use target projections
Most patterns have measurable targets:
Flags → height of flagpole
Head and Shoulders → distance from head to neckline
Triangles → widest part of the formation

Water Treatment >>> ION ExchangeCMP 352
52 Weeks Low 342
SL CLB 320
Expected Targets 385 & 425
⚠️ Note: Stick to levels, follow discipline & use TSL (Trailing Stop Loss) once target starts approaching.
Let’s stay hopeful that the move continues as per our expectations! 📈
💡 Liked the idea?
Then don’t forget to Boost 🚀 it!
For more insights & trade ideas,
📲 Visit my profile and hit Follow
Warm regards,
Naresh G
SEBI Registered Research Analyst
💬 Comment below if you want me to analyse any stock for you 🔍

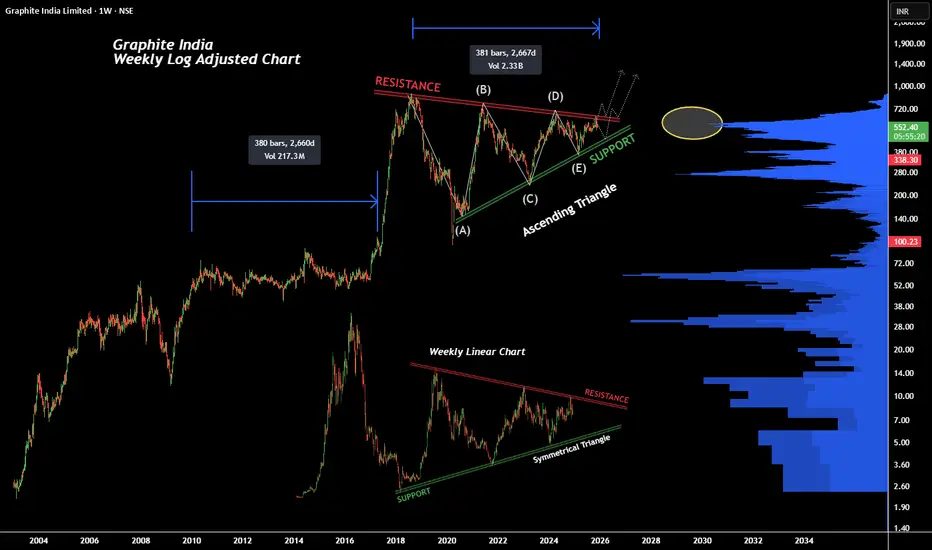
Graphite India Ltd Around Decisive LevelPossible Multi-Bagger Opportunity
Graphite India is moving sideways in a big range and forming an ascending triangle, wave count is complete, but on the linear chart (caption image) Graphite India is forming symmetrical triangle and last wave is still incomplete. Good volume activity at the current price and last time stock was rangebound for similar interval before huge upside.
There are two possibilities: -
Breakout from here and one can buy at retest around 655.
Stock tests support again and best buying opportunity around 450-430.
Target ranging from 1140 (linear) to 3400 (log). Nothing is going to happen overnight; it will take time.
Always go with a logical stop loss for capital protection.
Nifty Intraday Analysis for 27th November 2025NSE:NIFTY
Index has resistance near 26400 – 26450 range and if index crosses and sustains above this level then may reach near 26600 – 26650 range.
Nifty has immediate support near 26000 – 25950 range and if this support is broken then index may tank near 25800 – 25750 range.
Overall momentum is positive, however, rangebound trade is expected due to expiry day of the Monthly F&O contract on BSE.

Divergence Secrets Tips for Successful Option Trading
Always use stop-loss
Track IV and IV percentile
Learn market structure (trend, range, breakout)
Avoid buying options in low IV environments
Avoid selling options in highly trending markets
Maintain proper risk-to-reward
Never hold naked options till expiry if inexperienced
Focus on quality setups, not quantity

Option Trading Advantages of Option Trading
✔ Low capital needed
✔ Limited risk (for buyers)
✔ High reward potential
✔ Many strategies
✔ Ability to trade volatility
✔ Perfect hedging tool
✔ Flexibility to create customised views

Part 2 Support and Resistance Factors That Affect Option Premium
(A) Underlying Price Movement
Bigger moves → bigger premium.
(B) Time Value
Longer time to expiry → higher premium.
(C) Volatility (IV)
Higher IV = expensive options
Lower IV = cheaper options
(D) Demand & Supply
High activity in a strike increases premium.
(E) Market Events
Events like:
RBI Policy
Budget
Elections
Earnings
Cause volatility spikes.

Part 1 Support and ResistanceWhy Option Trading Is Popular
(1) Low Capital Requirement
A trader can control large exposure by paying only premium.
(2) Risk Can Be Controlled
Option buyers lose only the premium, unlike futures.
(3) Multiple Strategies
Options allow endless combinations:
Directional trades
Hedge positions
Neutral trades
Volatility trades
Income trades
(4) Can Earn in Any Market
You can profit in:
✔ Uptrend
✔ Downtrend
✔ Sideways periods
✔ High volatility
✔ Low volatility

Gold may continue rising — Trading around 4,150–4,200 range📊 Market outlook:
• Spot gold is currently around 4,150 USD/oz.
• It is up roughly +0.20% (≈ +8 USD) over the past 24 hours.
• The rise is supported by expectations that the Federal Reserve (Fed) may cut interest rates soon, making non-yielding assets like gold more attractive.
📉 Technical view (short-term):
• Support zone: ~ 4,130 – 4,140 USD/oz — watch for a retracement bounce.
• Resistance zone: ~ 4,180 – 4,200 USD/oz — a breakout could trigger further gains.
• In a low-interest environment and with ongoing macro uncertainties, gold remains a safe-haven asset — bullish bias continues.
📌 Interpretation:
• In the short term, gold is likely to rise further if expectations of rate cuts remain strong.
• If U.S. economic data comes in stronger and the Fed turns hawkish → a minor correction is possible.
• Current bias: upside, but sensitive to U.S. economic data and Fed signals.
💡 Trading Strategy:
🔺 BUY XAU/USD: 4,135 – 4,132
🎯 TP: 40 / 80 / 200 pips
🛑 SL: 4,129
🔻 SELL XAU/USD: 4,185 – 4,188
🎯 TP: 40 / 80 / 200 pips
🛑 SL: 4,192

Part 12 Trading Master Class How Put Options Work
A Put Option gives the buyer the right to sell the underlying asset at the strike price.
You buy a put when you expect the market to fall.
Example:
Nifty at 22,000
You buy 21,800 PE at ₹45 premium.
If Nifty drops to 21,600:
Intrinsic value = 21,800 – 21,600 = ₹200
Profit = 200 – 45 = ₹155
If Nifty stays above 21,800, you lose only the premium.

Part 11 Trading Master Class How Call Options Work
A Call Option gives the buyer the right to buy the underlying asset at the strike price.
You buy a call when you expect the market to go up.
Example:
Nifty at 22,000
You buy 22,200 CE at ₹50 premium.
If Nifty moves to 22,400, the call becomes valuable.
Intrinsic value = 22,400 – 22,200 = ₹200
Profit = 200 – 50 = ₹150
But if Nifty stays below 22,200, your call expires worthless and you lose the premium.
Risk = ₹50
Reward = unlimited

Best Timeframes for Riding Momentum1. Understanding Momentum Across Timeframes
Momentum is not equal on all charts. A stock may show momentum on a 5-minute chart due to a news spike, while the daily chart might show a strong trend reversal building over days or weeks. Therefore, selecting a timeframe is essentially choosing the type of momentum you want to ride:
Short-term momentum (scalping/intraday)
Medium-term momentum (swing trading)
Long-term momentum (positional/trend trading)
The key is to match your risk appetite, capital, and trading frequency with the correct timeframe.
2. Best Timeframes for Intraday Momentum Trading
Intraday momentum traders rely on speed, volume bursts, volatility expansions, and breakouts. These traders prefer timeframes that show quick moves and real-time strength.
(a) 1-Minute Chart (For Aggressive Scalpers)
The 1-minute chart captures the earliest shift in momentum. Traders who use this timeframe look for:
Quick breakouts
Volume surges
Rapid candles indicating imbalance
Small pullbacks in a fast trend
Pros:
Very early entry
Ideal during news events or opening volatility
Cons:
High noise
Requires fast decision-making
Stops can get hit easily
This timeframe suits only experienced, disciplined scalpers.
(b) 5-Minute Chart (Most Popular for Intraday Momentum)
The 5-minute chart is the most widely used for riding intraday momentum because it balances speed with reduced noise.
You can spot:
Breakouts with confirmation
Momentum continuation patterns
Clean trend waves
Strong candles backed by volume
Pros:
Good for capturing 30-minute to 2-hour momentum bursts
Less noise than 1-minute
Ideal for most intraday strategies
Cons:
Might give slightly late signals compared to 1-minute
For 90% of intraday momentum traders, this is the most effective timeframe.
(c) 15-Minute Chart (For Stable Intraday Momentum)
The 15-minute timeframe filters out small fluctuations and highlights more stable trends.
Traders use it to capture:
Structured trend continuation
Breakouts that sustain
Market-wide directional moves (index-based momentum)
Pros:
Cleaner momentum signals
Higher probability of trend continuation
Ideal for traders who don’t want to react to every tick
Cons:
May miss early entries
Momentum moves may already be halfway over
This timeframe is preferred by traders who want moderately fast but reliable moves.
3. Best Timeframes for Swing Momentum Trading
If you want to capture momentum lasting days to weeks, swing timeframes are ideal. Momentum on these charts often aligns with:
Strong fundamental triggers
Trend reversals
Breakouts from long consolidations
Institutional buying/selling
(a) 1-Hour Chart (Great for Short-Term Swings)
The 1-hour (H1) chart helps identify momentum trends that last 1–3 days.
Momentum here is typically caused by:
Overnight sentiment continuation
Market-wide setups
Sector rotations
Breakout retests
Benefits:
Captures multi-day momentum waves
Smoother trends vs. intraday charts
Works well for stocks, forex, crypto, and commodities
This timeframe is a bridge between intraday and swing trading.
(b) 4-Hour Chart (Most Reliable for Multi-Day Moves)
The 4-hour (H4) timeframe is considered one of the most powerful charts for swing momentum trading.
Here, momentum reflects:
Medium-term investor flows
Strong technical patterns
Higher probability breakouts
Why it works so well:
Less noise
Strong price follow-through
Institutional influence becomes visible
Most swing traders rely on H4 + Daily to ride big moves.
(c) Daily Chart (D1) — King of Momentum Trading
The daily chart generates the most reliable momentum signals. Moves generated here can last for:
Weeks
Months
Quarters
Daily momentum is driven by:
Strong fundamentals
Earnings
Policy changes
Market trends
Institutional accumulation or distribution
Pros:
Very high accuracy
Fewer false breakouts
Clear, powerful trends
Cons:
Requires patience
Larger stop-losses
Fewer trades (but higher quality)
If your goal is long-term, stable momentum riding, D1 is the best.
4. Best Timeframes for Positional Trend-Momentum Trading
Longer timeframes show macro momentum, ideal for investors who want to ride multi-month or multi-year trends.
(a) Weekly Chart (W1)
The weekly timeframe captures strong themes such as:
Sector trends
Commodity supercycles
Long-term breakouts
Market phases (bull/bear transitions)
Weekly momentum is extremely powerful because it represents consistent institutional buying across many weeks.
(b) Monthly Chart (MN)
The monthly chart is used for major momentum moves like:
Market cycles
Structural bull markets
Long-term investment themes
Momentum here unfolds slowly, but the moves are massive.
5. Combining Timeframes: The Secret to Riding Momentum Safely
The best traders use multi-timeframe analysis:
High timeframe = Trend direction
Lower timeframe = Entry timing
Example:
Daily chart → shows strong bullish trend
4-hour chart → shows breakout or pullback
15-minute chart → provides perfect entry
This lets you:
Avoid false signals
Trade in the direction of major forces
Enter with precision
6. Which Timeframe Is Best for YOU?
Your timeframe should match your personality and availability:
Trader Type Best Timeframes
Scalper 1m, 5m
Intraday Momentum Trader 5m, 15m
Swing Trader 1h, 4h, Daily
Positional Momentum Investor Weekly, Monthly
Ask yourself:
Do you want fast gains? → Lower timeframes
Do you want dependable momentum? → Higher timeframes
Do you want fewer but bigger moves? → Daily–Weekly
7. Key Indicators That Work Across All Timeframes
To ride momentum effectively, pair your chosen timeframe with:
RSI (overbought/oversold momentum strength)
MACD (momentum direction & crossover)
Moving Averages (20/50/200 EMA)
Volume (confirm strength)
VWAP (intraday only)
Momentum is strongest when:
Price > 20 & 50 EMA
Volume spike confirms breakout
RSI stays above 60 (bull) or below 40 (bear)
Conclusion
The best timeframe for riding momentum depends on your trading style, but the most reliable ones are:
5m for intraday
1h & 4h for swing
Daily for long-term momentum
Understanding how momentum behaves across timeframes allows you to enter earlier, stay confident in the trend, manage risk better, and maximize profits.
E-Commerce Profits in the Trading Market1. The Evolution of E-Commerce in Trading Markets
Traditional trading relied heavily on physical marketplaces, intermediaries, warehousing networks, and region-specific demand. E-commerce broke these boundaries, enabling sellers to trade goods across vast geographies with minimal friction. With digital payments, online marketplaces, automated logistics, and data analytics, the trading market’s profit model fundamentally shifted from limited, location-based selling to scalable, digital-led operations.
Key drivers of this evolution include:
Internet penetration and smartphones making online buying accessible.
Logistics innovation, including hyperlocal delivery, multi-city fulfilment centers, and cross-border shipping.
Digital payments reducing transaction friction.
AI-powered recommendations, improving customer experience and conversion.
These developments made e-commerce not just an extension of traditional trading but a new, dominant trading model.
2. How E-Commerce Generates Profits in the Trading Market
A. High Scalability with Low Marginal Cost
After initial setup—website, inventory, marketplace listings—the cost of reaching additional customers is extremely low. Unlike a physical store, which requires space, staff, and utilities, e-commerce allows businesses to scale nationally and globally without proportionally rising expenses. This creates a unique margin structure where revenue can grow faster than cost, leading to higher profits.
B. Marketplace Fee Model and Commissions
For platforms like Amazon, Flipkart, Alibaba, and Shopify stores, profits are earned through:
Listing fees
Commissions per sale
Fulfilment fees
Advertising fees
Subscription plans
This model creates steady and predictable income for e-commerce giants. Marketplaces profit whether a seller is new or established, creating a robust ecosystem.
C. Data-Driven Pricing and Dynamic Margins
E-commerce thrives on data — demand analysis, consumer behaviour, competitor pricing, time-of-day trends, geo-level demand, and more.
Dynamic pricing allows:
Higher margins during peak demand
Competitive pricing during slow periods
Inventory liquidation at optimal prices
This flexibility increases profitability significantly compared to static, offline pricing.
D. Inventory-Light Models: Dropshipping and D2C
Modern traders use models where inventory risk is low or zero:
Dropshipping: The seller markets the product; the supplier ships it.
D2C (Direct-to-Consumer): Brands bypass distributors and retail chains.
These models minimize working capital needs and reduce financial risks, allowing even small traders to achieve strong profit margins.
E. Cross-Border E-Commerce Trading
Global e-commerce platforms open new profit channels for traders:
Selling high-margin Indian products (handicrafts, Ayurveda, textiles) abroad.
Arbitrage trading between markets where prices differ.
Importing niche products and selling in new markets.
Cross-border trade provides multi-currency revenue, higher margins, and greater market depth.
3. Key Profit Drivers in the E-Commerce Trading Ecosystem
1. Customer Acquisition and Retention
Profits depend heavily on how efficiently a business attracts and retains buyers.
SEO and content marketing bring organic, low-cost traffic.
Paid ads bring fast conversions but require proper budgeting and targeting.
Email and CRM systems generate repeat purchases at low cost.
Repeat customer revenue improves profitability dramatically, as acquisition costs drop over time.
2. Supply Chain and Logistics Optimization
Efficient logistics boost profits by:
Reducing delivery time
Lowering return rates
Optimizing warehousing costs
Improving customer satisfaction
Companies that integrate last-mile delivery or use fulfilment services achieve higher operational efficiency, which strengthens margins.
3. Scale-Based Negotiation Power
Larger sellers or marketplaces achieve higher profits by:
Negotiating lower supplier costs
Reducing per-unit shipping charges
Accessing better credit terms
Getting priority listing and visibility
Scale multiplies profitability through operational leverage.
4. Technology Automation
Automation reduces labor costs, errors, and delays. Profitable traders use:
Inventory management systems
Predictive analytics for demand forecasting
Automated ad campaigns
Chatbots and AI-driven customer support
Workflow automation tools
Tech-driven operations allow small teams to run large e-commerce operations profitably.
5. Brand Building and Customer Trust
Brands earn higher profits than generic sellers due to:
Emotional connection
Repeat sales
Higher pricing power
Positive reviews and trust
D2C brands, in particular, achieve strong margins by owning their narrative, packaging, and product experience.
4. Profit Models in E-Commerce Trading
A. Retail Arbitrage
Buying lower-priced goods and selling higher online. Profit comes from price gaps between markets.
B. Private Label Selling
Sellers source generic products, rebrand them, and sell at premium margins.
C. Wholesale and Bulk Trading
Traders buy in bulk from manufacturers and sell online:
High volume
Low per-unit margins
Stable profits
D. Subscription-Based Sales
Recurring revenue models (memberships, replenishment boxes) provide predictable monthly income.
E. Affiliate Marketing
Not all traders sell products; some earn commissions by promoting others’ products online.
5. Challenges That Affect Profitability
While e-commerce is profitable, several challenges can reduce margins:
1. High Competition and Price Wars
Low entry barriers attract many sellers, which reduces margins.
2. Platform Dependency
Sellers relying heavily on marketplaces face:
Commission increases
Listing restrictions
Algorithm changes
3. Logistics and Return Costs
High return rates in categories like fashion reduce profitability.
4. Advertising Costs
Paid ads can become expensive if not optimized.
5. Inventory Risks
Overstocking or unsold goods impact cash flow and profits.
Despite these challenges, strategic traders navigate them using efficient supply chains, niche products, and technology.
6. The Future of E-Commerce Profits in the Trading Market
The next decade will bring transformative changes:
1. AI-Driven Trading
AI will optimize pricing, demand forecasting, and customer segmentation.
2. Live Commerce
Real-time selling through live video will drive impulse purchases and higher conversions.
3. Hyper-Personalized Shopping
Customized product recommendations will increase average order value and profitability.
4. Sustainable and Green E-Commerce
Consumers increasingly prefer eco-friendly brands, creating high-margin niches.
5. Expansion of Cross-Border Markets
More small traders will sell globally as shipping and compliance improve.
Conclusion
E-commerce has fundamentally reshaped the trading market, turning it into a fast, scalable, data-driven ecosystem where profits come from technology adoption, efficient operations, global reach, and consumer-centric strategies. Whether through private labels, cross-border trading, dropshipping, bulk wholesale, or digital-first branding, e-commerce offers multiple pathways to achieving profitability. As AI, logistics innovation, and digital payments evolve, e-commerce will continue to unlock even greater profit potential in global trading markets.
Part 10 Trade Like InstitutionsStrike Price, Premium, and Expiry
To understand any option, three elements are critical:
(A) Strike Price
The fixed price at which you can buy (call) or sell (put) the asset.
Example:
Nifty at 22,000
Call option strike: 22,200 CE
Put option strike: 21,800 PE
(B) Premium
The cost of buying the option.
Premium reflects what traders believe about future movement, volatility, and time value.
Higher volatility → higher premium.
(C) Expiry
Options have a limited lifespan. In India, index options expire weekly, and stock options expire monthly.
At expiry, out-of-money options lose all value.

Part 9 Trading Master Class With Experts What Are Options?
Options are derivative contracts. This means their value is derived from an underlying asset—such as Nifty, Bank Nifty, stocks like Reliance or TCS, commodities, or currencies.
There are two types of options:
Call Options (CE) – Right to buy at a specific price
Put Options (PE) – Right to sell at a specific price
But remember this key point:
Options give a right, not an obligation.
This is what makes options asymmetric:
Buyers have limited risk and unlimited potential gain.
Sellers (writers) have limited profit but potentially high risk.

Candle Patterns Practical Trading Tips Using Candle Patterns
Trade only with trend confirmation.
A reversal pattern against a strong trend may fail.
Look for patterns at key levels.
Support, resistance, supply-demand zones enhance accuracy.
Use stop-loss placement wisely.
For example, below the wick of a Hammer or above the wick of a Shooting Star.
Avoid trading every pattern blindly.
Candle patterns tell probabilities, not certainties.
Wait for candle close.
Incomplete candles may give false signals.
Use volume and structure to confirm.
Patterns with volume are more reliable.

Premium Chart Patterns Chart patterns provide clues about what buyers and sellers are doing:
Buyers create demand, pushing prices higher.
Sellers create supply, pushing prices lower.
When these forces interact, certain shapes form on the price chart. These shapes—like triangles, flags, head and shoulders, double tops—help traders forecast the next big move.
Patterns can be classified into two major types:
Reversal Patterns – indicate a possible change in trend.
Continuation Patterns – indicate the existing trend is likely to continue.
Understanding both helps traders catch major market moves with good accuracy.

Cholafin Long - Investment Ideas & AnalysisTechnical Analysis : Cholamandalam Investment and Finance Co. Ltd.
Current Price: 1,610.30
Multi-Timeframe Technical Analysis
Weekly Timeframe Pattern
The stock has formed a **Cup and Handle** pattern on the weekly chart, which is traditionally considered a bullish continuation pattern. This pattern suggests potential accumulation and a possible breakout scenario.
Daily Timeframe Analysis
On the daily chart, a * *Bullish Pennant* * formation has developed, indicating consolidation after a strong upward move. This pattern typically suggests continuation of the prior trend once a breakout occurs.
Key Technical Levels
Fibonacci Retracement Levels:
- 0 Level: ₹1,491.20
- 0.5 Level: ₹1,567.70 (approximate support zone)
- 0.618 Level: ₹1,595.45 (golden ratio support)
- 1 Level: ₹1,644.20
- 1.272 Level: ₹1,685.80
- 1.414 Level: ₹1,707.55
Current Price Action:
The stock is trading near ₹1,610.30, positioned between the 0.618 and 1.0 Fibonacci levels, suggesting a mid-range consolidation zone.
Upside Targets
If the bullish patterns play out and the stock breaks above recent resistance:
- **Primary Target:** Based on the Fibonacci extension, the measured move suggests potential toward ₹1,685-₹1,708 range
- **Pattern Target:** The Cup and Handle height projection aligns with Fibonacci extension levels
Support Analysis
- **Immediate Support:** ₹1,595-₹1,600 zone (0.618 Fibonacci level)
- **Strong Support:** ₹1,567 region (0.5 Fibonacci level)
- **Major Support:** ₹1,491 (pattern base/0 level)
With Nifty made a Bounce back and if the rally continues, adds advantage for the stock to break previous resistance." This highlights the **correlation with broader market sentiment** (Nifty index), suggesting the stock's performance may be influenced by overall market conditions.
Swing Trading Perspective
For short-term traders, the Cup and Handle height provides a **measured move target**. However, confirmation of breakout above resistance with volume would be essential before entry.
**Disclaimer:** This is a technical analysis based on chart patterns and historical price action. This is not financial advice. Traders should conduct their own research, consider risk management strategies, and consult with financial advisors before making trading decisions. Past performance does not guarantee future results.

Hindustan Petroleum Corporation Ltd – Weekly Chart AnalysisPricePrice has been moving inside a rising wedge structure, forming higher highs & higher lows over the past several months. Recently, the stock attempted a breakout above the wedge resistance but is now trading near the upper trendline, showing signs of pullback or retest behavior.
Volume has remained moderate, suggesting the market is waiting for a clear direction.
Now price action is at a decision zone — either a successful retest could resume bullish momentum, or failure may lead to profit-booking and a slide toward lower support trendlines.
This zone becomes crucial for directional clarity.

Cup & Handle Breakout in HDFCLIFEThe chart idea posted shows a classic Cup & Handle breakout in HDFC Life Insurance Co. Ltd.
, signaling a bullish opportunity. The cup features a rounded bottom, followed by a handle—the short consolidation before price surges above resistance. This breakout is confirmed by strong buying volume and an 18% move in the option price, indicating momentum. Traders commonly enter above the handle’s high, set stop-loss below the handle, and target gains equivalent to the cup’s depth projected upward. The Cup & Handle pattern is reliable and widely used for trend continuation trades
