Volatility Index (VIX) TradingUnderstanding What the Volatility Index Represents
The VIX is often called the “fear gauge” of the market. When investors expect calm markets, the VIX remains low. When uncertainty rises—due to economic news, geopolitical tension, policy announcements, or unexpected events—the VIX rises sharply.
Key characteristics of volatility indexes:
Mean-Reverting Nature
Volatility cannot stay extremely high or low forever. It tends to revert toward its long-term average over time. This makes volatility trading very different from equity or commodity trading.
Negative Correlation with Stock Markets
When stock markets fall sharply, volatility rises. This makes VIX instruments excellent hedging tools for traders.
Forward-Looking Indicator
Unlike price movements, which are backward-looking, the VIX reflects future expectations implied by options prices. Therefore, it reacts before markets move significantly.
Not Directly Tradable
The VIX itself cannot be bought or sold like a stock or index. Instead, traders use various derivative products linked to the VIX.
How Volatility Indexes Are Calculated
VIX is calculated using a range of out-of-the-money call and put options on the S&P 500 (or Nifty for India VIX). The formula takes into account:
Weighted prices of options
Time to expiration
Strike prices
Forward index level
This complex calculation estimates the expected magnitude of market movement over the next 30 days, expressed as annualized volatility.
Example:
If VIX is 20, the market expects the S&P 500 to move up or down about 20% annually (or approximately 5.8% monthly).
Instruments Used for Volatility Index Trading
1. VIX Futures
The most common way traders gain exposure to volatility. Futures allow traders to take long or short positions on where they believe VIX will be on a future date.
Long VIX Futures: Profit if volatility increases
Short VIX Futures: Profit if volatility decreases
These futures often trade at a premium due to storage-like costs called contango.
2. VIX Options
Options on the VIX behave differently from equity options because the underlying asset is volatility—not a stock price.
Call options gain value when volatility rises
Put options gain value when volatility falls
These instruments are widely used by hedge funds and professional traders.
3. Volatility ETFs and ETNs
Examples include VXX, UVXY, SVXY (U.S. markets). These track futures on the VIX rather than the index itself.
Leveraged ETFs amplify the movement
Inverse ETFs profit from falling volatility
They are popular among retail traders but can decay in value over time due to futures roll costs.
4. India VIX Futures (NSE)
In India, traders use India VIX futures on the National Stock Exchange. These allow hedging for Nifty investors during events such as:
Elections
Monetary policy announcements
Global uncertainties
Why Traders Use Volatility Index Instruments
1. Hedging Portfolio Risk
When markets fall, volatility rises. Traders buy VIX futures or VIX call options as a hedge against sudden market decline.
Example:
If a trader holds long positions in Nifty stocks, they may take a long exposure in India VIX futures for protection.
2. Speculation on Market Fear
Some traders bet on volatility spikes during events like:
Economic data releases
Wars or geopolitical tensions
Budget announcements
Earnings seasons
Because the VIX reacts quickly, speculative trading can yield large short-term profits.
3. Arbitrage Opportunities
Professional traders use volatility-based arbitrage strategies such as:
Calendar spreads
Term structure arbitrage (contango vs. backwardation)
VIX vs. equity options mispricing
These strategies exploit discrepancies in the pricing of volatility futures across time periods.
4. Portfolio Diversification
Volatility instruments have low or negative correlation with stocks, making them powerful diversifiers in a balanced portfolio.
How Volatility Behaves in Markets
Volatility is not constant. It shows typical behavior patterns:
1. Volatility Spikes Are Sudden
News shocks can cause VIX to jump from 12 to 30 within hours. Traders must react quickly.
2. Volatility Drops Slowly
After a spike, the VIX declines gradually as markets stabilize.
3. Volatility Clusters
Periods of high volatility often follow each other. Calm periods also cluster together.
4. Volatility Mean Reverts
If VIX rises too high, it eventually comes down. Traders use this for mean-reversion strategies.
Common Trading Strategies
1. Buying Volatility Before Major Events
Traders go long VIX before important announcements expecting an increase in volatility.
2. Selling Volatility During Calm Conditions
When volatility is high but expected to return to normal, traders short the VIX.
3. Volatility Spread Trading
Example: Long near-month VIX future and short far-month future if backwardation is expected.
4. Hedging Equity Exposure
Holding a VIX long position while maintaining a long stock portfolio helps protect against market crashes.
5. Using VIX Options
Buying call options on VIX gives asymmetrical protection—limited loss, unlimited upside.
Risks Involved in Volatility Index Trading
1. Futures Roll Costs
ETFs and futures lose value when the market is in contango, causing decay in long-term positions.
2. Sharp Reversals
A spike in volatility can be followed by a rapid fall, wiping out gains quickly.
3. Leverage and Margin Risks
Volatility products are often leveraged, magnifying losses.
4. Complexity
Volatility is one of the most advanced fields in trading. Pricing models are complex and require deep understanding.
5. Decay in Leveraged ETFs
Products like UVXY experience significant long-term decay due to daily rebalancing.
Advantages of Volatility Trading
High-profit potential during market stress
Effective tool for managing risks
Helps diversify portfolios
Provides insight into market sentiment
Offers opportunities even when markets are not trending
Conclusion
Volatility index trading is a powerful and sophisticated form of market participation. It gives traders an opportunity to profit from market fear, hedge against unexpected downturns, and gain exposure to an entirely different dimension of financial markets. Understanding how volatility behaves—its mean-reverting nature, its correlation with market stress, and its reaction to external events—is crucial for trading VIX-based instruments effectively.
Contains image
Investing in Shares in the Indian Market1. Understanding the Indian Stock Market
India’s stock market is primarily operated through two major exchanges:
(a) National Stock Exchange (NSE)
The NSE is the largest exchange in terms of volume. It introduced electronic trading in India and is home to major indices such as Nifty 50, Nifty Bank, Nifty IT, and others.
(b) Bombay Stock Exchange (BSE)
One of the oldest exchanges in Asia, the BSE hosts indices like the Sensex, BSE Midcap, and BSE Smallcap.
Both exchanges are regulated by the Securities and Exchange Board of India (SEBI), which ensures transparency, investor protection, and fair trading practices.
2. What Are Shares?
Shares represent ownership in a company. When you invest in shares, you:
Become a part-owner of the business
Benefit from the company’s growth through capital appreciation
Receive dividends, if declared
Get voting rights in some cases
Share prices fluctuate due to demand and supply, economic conditions, company performance, global news, and market sentiment.
3. How to Start Investing in Shares in India
(a) Open a Demat Account
A Demat (Dematerialized) account stores your shares electronically. It is essential for buying and selling equities in India.
Major brokers include:
Zerodha
Groww
Angel One
Upstox
ICICI Direct
HDFC Securities
(b) Open a Trading Account
Connected to your Demat account, this is used to place buy/sell orders on the exchange.
(c) Link a Bank Account
Funds are transferred from your bank to the trading account to execute transactions.
(d) Complete KYC
AADHAR, PAN, mobile number verification, and e-signature are mandatory parts of the KYC process.
Once these steps are completed, you can begin investing through your broker’s app or platform.
4. Ways to Invest in the Indian Stock Market
(a) Direct Equity (Buying Individual Stocks)
This means selecting individual companies for long-term investment based on research.
(b) Mutual Funds / Equity SIPs
Investors who prefer passive management often choose mutual funds such as:
Large-cap funds
Mid-cap funds
Small-cap funds
Index funds
Thematic funds
SIP (Systematic Investment Plan) allows regular monthly investments.
(c) ETFs (Exchange-Traded Funds)
ETFs track an index like Nifty 50 and trade like stocks. They offer low costs and diversification.
(d) IPOs (Initial Public Offerings)
Investors can apply for shares of companies when they list for the first time.
5. Types of Shares in India
By Market Capitalization
Large-cap: Stable, established companies (Reliance, TCS, HDFC Bank)
Mid-cap: Growing companies with higher potential
Small-cap: High-risk, high-reward companies
By Sector
Banking and Finance
IT and Technology
Pharma
FMCG
Metal and Energy
Auto
Infrastructure
Telecom
Each sector performs differently depending on macroeconomic cycles.
6. Why Invest in Shares?
(a) Wealth Creation
Over long periods, equities offer the highest returns compared to gold, real estate, or fixed deposits. For example, Nifty 50 has delivered around 14–15% annualized returns over 20 years.
(b) Beat Inflation
Inflation reduces money’s purchasing power. Equity returns typically outpace inflation, helping preserve and grow wealth.
(c) Dividends and Bonuses
Investors may receive dividend income, bonus shares, and stock splits.
(d) Ownership and Transparency
India’s markets are well-regulated, ensuring transparent transactions and investor protection.
7. Risks of Investing in Shares
Stock investment is rewarding but comes with risks:
(a) Market Risk
Share prices move up and down due to market sentiment, global cues, and economic changes.
(b) Company-Specific Risk
Poor management, low earnings, fraud, or competition can affect a company's share price.
(c) Liquidity Risk
Some shares, especially small caps, may have fewer buyers, making it hard to sell quickly.
(d) Economic and Geopolitical Risk
Events like elections, wars, oil price fluctuations, and global recession impact Indian markets.
Managing risk through diversification and research is essential.
8. Fundamental vs. Technical Analysis
Investors use two main methods to pick stocks:
(a) Fundamental Analysis
Focuses on a company’s core financial health. This involves studying:
Revenue and earnings
Profit margins
Debt levels
Cash flow
Competitive advantage
Management quality
The goal is to buy companies undervalued relative to their intrinsic value.
(b) Technical Analysis
Helpful for short-term trading. It focuses on:
Price charts
Chart patterns
Support and resistance
Indicators like RSI, MACD, moving averages
Traders use technical analysis to time entry and exit points.
9. Long-Term vs. Short-Term Investing
Long-Term Investing (Wealth Building)
Investing with a 5–10+ year horizon helps benefit from compound returns. Historically, holding quality stocks over long periods reduces risk and maximizes growth.
Short-Term Trading
Includes intraday, swing trading, options trading, and futures. While it offers quick profits, it is high risk and requires discipline and advanced market knowledge.
10. Taxes on Shares in India
Short-Term Capital Gains (STCG)
15% tax if shares are sold within 1 year.
Long-Term Capital Gains (LTCG)
10% tax on gains above ₹1 lakh for shares held beyond 1 year.
Dividends
Taxed at the investor’s slab rate.
11. Key Tips for Stock Market Investors
✔ Invest regularly (SIP method)
✔ Diversify across sectors and market caps
✔ Focus on fundamentally strong companies
✔ Avoid panic selling during corrections
✔ Do not follow rumors or tips blindly
✔ Keep a long-term perspective
✔ Review your portfolio annually
✔ Understand risk appetite before investing
12. Common Mistakes to Avoid
Investing without research
Over-trading for quick profits
Lack of diversification
Emotional decisions
Ignoring risk management
Putting all savings into stocks
Conclusion
Investing in shares in the Indian market offers a powerful opportunity to build long-term wealth. With a robust regulatory framework, digital trading platforms, and a rapidly growing economy, India provides a fertile environment for equity investment. While market fluctuations and risks exist, informed decision-making, disciplined investing, and a long-term approach can significantly enhance the probability of success. Whether you are a beginner or an experienced investor, the key lies in continuous learning, patience, and choosing the right companies aligned with your financial goals.
Crypto Asset Secrets: Fundamental Dynamics, Structural Realities1. Liquidity Is the Real Power in Crypto
The biggest secret in crypto markets is that price is controlled by liquidity, not popularity.
Most newcomers focus on:
News
Social media hype
Project fundamentals
Influencers
But markets move when large buyers or sellers enter low-liquidity environments. Liquidity gaps can produce:
Rapid pumps
Flash crashes
Stop-loss hunts
“Wick” volatility that destroys leveraged positions
A coin with a $500 million market cap can still move violently if daily trading volume is thin. In crypto, the book depth (available orders) matters far more than market cap.
Key point:
Low liquidity = high manipulation potential.
2. Whales Shape Most Major Market Moves
In stock markets, institutions dominate. In crypto, large holders—“whales”—play an even bigger role.
Whales can:
Move prices by placing large buy/sell walls
Trigger liquidation cascades
Create fear or euphoria with timed transactions
Exploit precise liquidity zones around funding cycles
Their strategies include:
Spoofing (placing fake orders to influence sentiment)
Wash trading (creating artificial volume)
Accumulation/distribution cycles
Stop-hunting via sudden volatility
Blockchain transparency exposes whale movements, but interpreting them correctly is an art.
Secret:
Following whale wallets often reveals market direction before retail sees it.
3. Market Makers Quietly Control the Order Flow
Market makers (MMs) provide liquidity to exchanges, but they also shape price behaviour.
Their influence includes:
Maintaining spreads
Absorbing buy/sell pressure
Moving price to areas with highest liquidity (liquidation zones)
Hedging risk across spot, futures, and options
In crypto, many market makers act with more flexibility than traditional finance because regulation is looser.
MMs often engineer:
Range-bound price action
Breakouts toward liquidity pools
Sudden volatility to rebalance exposures
Secret:
If you watch where liquidity pools form (using heatmaps or liquidation charts), you can anticipate MM moves.
4. Most Altcoins Inflate Through Token Unlocks
The majority of altcoin investors don’t know that token unlocking schedules dilute price over time.
Even strong projects follow emission schedules:
Team vesting
Private sale unlocks
Ecosystem incentives
Liquidity injections
These can release millions of tokens into circulation—sometimes monthly or even weekly.
This creates constant sell pressure.
Secret:
You must study tokenomics before touching an altcoin. Fully diluted valuation (FDV) is often more important than current price.
5. Centralized Exchanges Have Enormous Hidden Power
Crypto is marketed as decentralized, but trading is 90% dependent on centralized exchanges (CEXs).
Exchanges control:
Order books
Liquidation engines
Funding rates
Front-end data feeds
Risk management algorithms
Sometimes, exchanges:
Adjust leverage availability
Close off withdrawals during volatility
Run maintenance at “mysterious” times
Remain opaque about reserves
Some even act as market makers for their own platforms.
Secret:
Understanding exchange mechanics is essential. The exchange is always the house—and the house rarely loses.
6. Liquidation Cascades Move the Market More Than News
Crypto futures markets have massive leverage (up to 100x), causing forced buying and selling when prices hit certain levels.
The hidden force: liquidation engines.
When many traders are long with high leverage:
Price drop → forced sell orders
Forced sell orders push price down more
More traders get liquidated
A cascade forms
This also happens with shorts during squeezes.
This explains why crypto often moves:
10% in minutes
Without any news
At perfectly predictable liquidity levels
Secret:
Liquidation maps show where cascades may occur. Price often hunts these zones.
7. On-Chain Data Reveals the Truth Behind the Charts
Traditional markets hide data. Crypto exposes everything on-chain:
Wallet holdings
Exchange inflows/outflows
Long-term holder behaviour
Staking metrics
Miner activity
Smart contract interactions
If you know how to read:
NVT ratio
MVRV
Exchange reserves
Realized price bands
Whale accumulation patterns
…you can detect real momentum before price reacts.
Secret:
Charts lie. On-chain data doesn’t.
8. Narrative Cycles Drive Altcoin Seasons
Every major rally has a narrative:
DeFi Summer
NFT Boom
Layer-1 Wars
Meme coin mania
AI tokens
Real-world assets (RWA)
Liquid Staking Tokens (LST)
Investors rotate money from one narrative to the next. These narratives often appear months before the public notices.
Smart investors track:
Developer activity
Ecosystem funding
Partnerships
VC trends
Secret:
Narratives drive capital flows. Capital flows drive price.
9. Most Crypto Gains Happen in Short Bursts
Studies show that less than 10 trading days per year often produce the majority of bitcoin’s returns.
Reasons:
Halving-driven supply shocks
Macro cycles
FOMO waves
Short squeezes
Liquidity gaps
Missing just a few days can mean missing the entire bull run.
Secret:
The market rewards patience and punishes overtrading.
10. Security Is the Most Overlooked Crypto Secret
Most people focus on price, not protection. Yet the fastest way to lose everything is through:
Phishing attacks
Private key leaks
Smart contract exploits
Rug pulls
Exchange hacks
Proper security includes:
Hardware wallets
Multi-sig accounts
Avoiding suspicious sites
Using separate wallets for risky assets
Secret:
In crypto, custody = control. If you don’t own your keys, you don’t own your coins.
11. Macroeconomic Cycles Still Control Crypto
Despite its futuristic image, crypto reacts strongly to:
Interest rates
Liquidity conditions
Bond yields
Dollar strength
Risk-on/risk-off cycles
Bitcoin behaves like a high-beta macro asset.
When global liquidity expands, crypto thrives.
When liquidity contracts, crypto bleeds.
Secret:
Crypto is free-spirited, but not independent from global finance.
12. The Halving Cycle Is Not Magic—It’s Economics
Bitcoin halvings reduce new supply by 50%.
This supply shock:
Reduces miner selling pressure
Alters long-term market psychology
Triggers new speculative phases
This creates 4-year boom-bust cycles.
It’s not magic—it’s simple scarcity economics mixed with human behaviour.
Secret:
Halving cycles still matter because supply psychology still matters.
Conclusion
The real “secrets” of crypto assets are not mystical or hidden behind paywalls. They are the deeper forces—liquidity mechanics, whale behaviour, on-chain transparency, tokenomics, exchange power, and macro cycles—that quietly dictate market structure.
Understanding these truths transforms how you see the market:
You stop chasing hype.
You learn to track liquidity.
You interpret whale moves.
You anticipate volatility.
You understand risk.
Crypto is still evolving, still volatile, and still experimental. But with knowledge of its inner workings, you gain clarity in a market where most remain confused.
Zero-Day Option Trading (0DTE)1. What Are Zero-Day Options?
A Zero-Day option is simply a regular option contract on its expiration day. Because U.S. indices like the S&P 500 (SPX), Nasdaq 100 (NDX) and ETFs like SPY, QQQ now have multiple expirations per week—and SPX has daily expirations—traders can access 0DTE opportunities every single trading day.
Key Characteristics
No time left → options decay extremely fast.
Highly sensitive (high gamma) → small price changes lead to large premium moves.
Very cheap or very expensive depending on proximity to strike.
Used for intraday speculation and hedging.
Cash-settled index options (like SPX) avoid assignment risk.
Because of the intense speed and leverage, 0DTE trading is often compared to day trading with derivatives on steroids.
2. Why 0DTE Became So Popular
a. High Leverage
A trader can control thousands of dollars of market exposure for a very low premium. For example, a deep out-of-the-money SPX option might cost only a few dollars but can balloon 10×–30× if the index rallies quickly.
b. Immediate Results
Traders don’t wait weeks or months—profits or losses occur in minutes or hours.
c. High Liquidity
Because major indices have huge participation, 0DTE options have:
fast fills,
tight bid–ask spreads,
minimal slippage (especially on SPX).
d. Attractive to Both Retail and Institutions
Retail traders seek quick profits.
Institutions often sell 0DTE options for income due to rapid theta decay.
3. Understanding the Mechanics
a. Time Decay (Theta)
Theta is at maximum on expiration day. Options lose value rapidly, especially after midday.
A call option worth $4 at 10:00 AM might be worth $1 by 1:00 PM—even if price hasn’t moved.
b. Gamma Exposure
Gamma determines how fast delta changes. On 0DTE:
delta moves extremely fast,
a 5-point SPX move can flip an option from worthless to highly profitable instantly.
c. Volatility’s Impact
Implied volatility (IV) plays a crucial role:
High IV → higher premiums, more unpredictable movement.
Low IV → cheaper premiums, easier theta decay for sellers.
Understanding the interplay of theta, gamma, and IV is the core of 0DTE expertise.
4. Types of Traders in 0DTE Markets
1. Buyers (Directional Traders)
They seek big intraday moves and are willing to risk small amounts for the chance of large returns. Suitable for:
breakout traders,
news-event traders,
momentum scalpers.
2. Sellers (Income Traders)
They benefit from:
rapid premium decay,
mean-reversion behavior.
These traders often sell:
spreads,
iron condors,
credit put spreads (CSP),
credit call spreads (CCS).
Institutions typically dominate this side because selling naked options carries unlimited risk.
5. Popular 0DTE Trading Strategies
1. ATM Straddle (High-Volatility Bet)
Buy both a call and a put at-the-money. Profit if the market makes a large move in either direction.
Used for:
major economic announcements (CPI, FOMC, NFP)
index breakout or breakdown days
Risk: Expensive strategy and requires big movement to break even.
2. OTM Strike Buying (Lottery Ticket Style)
Buying cheap far OTM calls or puts that cost very little. They can explode in value if the index rallies quickly.
Pros:
High reward-to-risk
Small capital required
Cons:
Very low probability of success
Most expire worthless
3. Credit Spreads
Selling an option and buying another further OTM for protection.
Example: Sell 5000 put, buy 4990 put (bull put spread).
Pros:
Higher probability of profit
Defined risk
Benefit from time decay
Cons:
Low reward-to-risk ratio
Must manage risk tightly
This is one of the most popular ways institutions use 0DTE.
4. Iron Condor
Sell OTM call spread and OTM put spread simultaneously. Profit if price stays within a range.
Pros:
High win rate
Income-style strategy
Cons:
Vulnerable to sharp moves
Quick adjustments needed
5. Directional Scalping With Options
Buying short-term scalp options (ATM or near ATM) for a few minutes to ride intraday momentum.
Best for:
Price-action traders
VWAP, support–resistance levels
Trend-following
Risk: Requires excellent timing and discipline.
6. When Traders Use 0DTE Options
1. News Events
0DTE options are extremely popular during:
Federal Reserve announcements (FOMC)
Inflation reports (CPI, PCE)
Jobs data (NFP)
Earnings of major tech companies (for QQQ, NDX)
These events cause large intraday swings—ideal for fast movers.
2. Expiration Day Index Movements
SPX often moves erratically around expiry due to dealer hedging flows.
3. Intraday Trend Days
When markets show clear momentum, 0DTE buyers can ride strong sweeps.
7. Benefits of Zero-Day Option Trading
1. Limited Risk (for Buyers)
Maximum loss is the option premium.
2. High Potential Returns
0DTE buyers can see:
50% profit in minutes,
200%+ intraday,
occasional 10×–30× moves.
3. Flexibility for Any Market Condition
Trend days → buy calls or puts
Range days → sell condors
Volatile days → buy straddles
0DTE offers something for every style.
8. Major Risks of 0DTE Trading
1. Extremely Fast Time Decay
Even correct directional trades can lose money if price moves too slowly.
2. Emotional Pressure
0DTE trading requires:
instant decision-making
tight stop-loss discipline
ability to handle rapid price swings
Many traders overtrade due to adrenaline.
3. Liquidity and Slippage (During News)
Although normally liquid, bid–ask spreads can widen by 5× during major announcements.
4. Margin Risk for Sellers
Selling naked 0DTE options can cause:
huge losses,
margin calls,
account blow-ups.
Beginners should avoid naked selling entirely.
9. Best Practices for Safe 0DTE Trading
Always trade with defined risk (spreads or small-position buying).
Set time-based rules (e.g., exit all trades by 3:15 PM).
Avoid trading during the first 5–10 minutes of market open due to volatility.
Wait for direction—don’t guess the first move of the day.
Use stop-loss and take-profit rules.
Avoid revenge trades.
Track win rate, average gain, and average loss.
Avoid over-leveraging—capital preservation is key.
10. Who Should Trade 0DTE Options?
Suitable for:
Experienced traders
Price-action and volatility traders
Traders comfortable with fast decision-making
Not suitable for:
Beginners
Traders with emotional discipline issues
Anyone relying on hope instead of strategy
0DTE trading is best when you have strong knowledge of technical analysis, option Greeks, and intraday market behavior.
Conclusion
Zero-Day option trading is one of the most powerful and exciting forms of modern trading. It offers unmatched leverage, fast-paced decision-making, and profit potential that few financial instruments can match. However, it is equally dangerous without discipline, strategy, and risk management.
For traders who understand price action, volatility, and the Greeks, 0DTE can be a highly rewarding tool. For others, it can quickly lead to significant losses. Mastery comes from practice, data-driven decision-making, and emotional control. If used responsibly, 0DTE options can enhance both income and directional trading strategies in today’s fast-moving markets.
Part 11 Trading Master Class With Experts 1. What Is an Option?
An option is a financial contract that gives the buyer the right, but not the obligation, to buy or sell an underlying asset (like stocks, indices, or commodities) at a fixed price within a specific time period.
The right but not the obligation makes options unique.
The underlying asset could be Nifty, Bank Nifty, stocks like Reliance or TCS, commodities like gold, etc.
The agreement is always between two parties:
Option Buyer (Right, Limited Risk)
Option Seller / Writer (Obligation, Unlimited Risk)

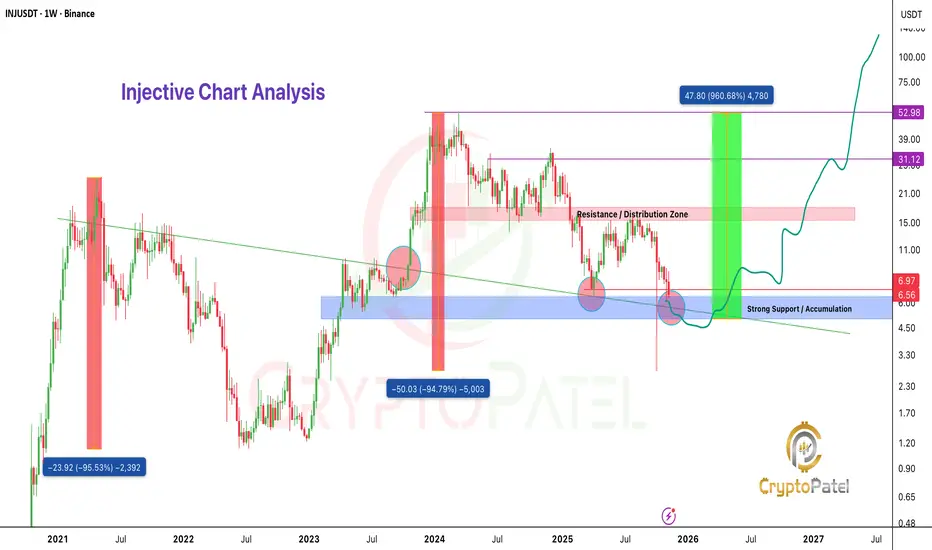
$INJ Is Repeating the 2021 Fractal: The Next 4,000% Move?CRYPTOCAP:INJ Is Repeating the 2021 Fractal: The Next 4,000% Move?
2021 Cycle Pattern:
🔹 Impulse: $0.65 → $25
🔹 Corrective Phase: -95% → $1.12
🔹 Expansion: +4,500% → $53 ATH
2024 Structure Mirrors 2021:
🔹 Impulse: $7 → $53
🔹 Corrective Phase: -94% → $2.74
🔹 Price now sitting inside historical Post-Cycle Reaccumulation Zone.
Accumulation Zone: $6–$4
Upside Targets: $15 / $30 / $50 / $70 (HTF liquidity clusters)
Invalidation: Break of structural low based on individual risk.
If 2021 fractal continues to play out, CRYPTOCAP:INJ is entering its highest-probability expansion window.
NFA & DYOR
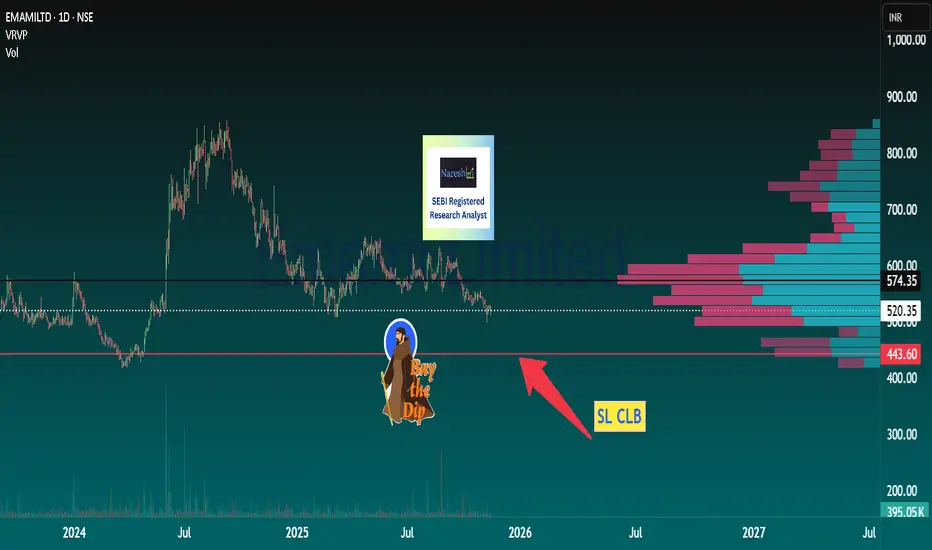
For Patient Traders >> Winter Cream Emami EMAMI LTD
LTP 520
Buy on dips till 450
SL CLB 440
Expected Tgts
550,575,625,675,725,775,825
Hint : Sustain above 555 > it might move up fast
⚠️ Note: Stick to levels, follow discipline & use TSL (Trailing Stop Loss) once target starts approaching.
Let’s stay hopeful that the move continues as per our expectations! 📈
💡 Liked the idea?
Then don’t forget to Boost 🚀 it!
For more insights & trade ideas,
📲 Visit my profile and hit Follow
Warm regards,
Naresh G
SEBI Registered Research Analyst
💬 Comment below if you want me to analyse any stock for you 🔍
Candle Patterns Candlestick patterns are visual signals created by price movement. Each candle shows open, high, low, and close, but certain shapes reveal strong buying or selling pressure.
✅ 1. Single Candlestick Patterns
✅ 2. Bullish Candlestick Patterns (Reversal)
✅ 3. Bearish Candlestick Patterns (Reversal)
✅ 4. Continuation Patterns

Premium Chart Patterns Premium chart patterns are high-quality technical structures that show where big money is entering or exiting, helping you predict future moves with strong accuracy. These patterns are widely used in swing trading, intraday trading, and positional trading.
Below, you’ll find the top high-probability premium patterns, along with how to trade them.

Part 10 Trade Like Institutions Advantages of Option Trading
Low investment, high return potential
Can profit in any market condition
Great for hedging and insurance
Wide range of strategies
Lower capital requirement compared to futures
Disadvantages of Option Trading
Requires knowledge of Greeks
High risk if used incorrectly
Time decay eats into profits
Volatility can change premiums rapidly

Part 9 Trading Master Class with Experts In-the-Money, At-the-Money, Out-of-the-Money
Call Options
ITM: Market price > strike
ATM: Market price ≈ strike
OTM: Market price < strike
Put Options
ITM: Market price < strike
ATM: Market price ≈ strike
OTM: Market price > strike
OTM options are cheap but risky.
ITM options are safer but cost more.

Part 8 Trading Master Class with Experts Time Decay (Theta): The Silent Killer
Time decay works against option buyers and in favor of sellers.
As expiry approaches, the time value decreases.
Even if the price stays the same, the option loses value daily.
Weekly options lose value much faster than monthly options.
This is why many professional traders prefer option selling—because time decay works in their favor.

Part 7 Trading Master Class With Experts Option Pricing: Why Premium Changes
Premium is the price paid by the option buyer. It depends on:
1. Intrinsic Value
Value if exercised today.
2. Time Value
More time → more chances of profit → higher premium.
3. Volatility (IV – Implied Volatility)
When volatility increases, option premiums rise.
4. Supply & Demand
High demand increases option prices.
5. Interest Rates & Dividends
These have minor impact but still matter for pricing models.

Part 6 Learn Institutional Trading Why Trade Options?
Options are extremely popular because they offer:
1. Leverage
You can control a large position using a small amount of money (the premium).
Example: Buying a stock may cost ₹1,00,000, but a call option may cost only ₹3,000.
2. Hedging
Investors use options to protect their portfolios from losses during market corrections.
3. Income Generation
Option sellers generate regular income through premium collection strategies.
4. Flexibility
You can build strategies that make money in rising, falling, or sideways markets.

Part 4 Learn Institutional Trading Two Sides of an Option Trade
Every option contract involves two parties:
a. Option Buyer
Pays a premium (price of the option)
Limited risk (only the premium paid)
Unlimited profit potential in some cases
b. Option Seller (Writer)
Receives the premium
Limited profit potential
Higher risk (sometimes unlimited)
Option buyers purchase potential, while sellers sell that potential in exchange for premium income.

Part 3 Learn Institutional Trading What Are Options?
Options are derivative contracts, meaning their value is derived from an underlying asset. The underlying asset may be stocks, indices, commodities, currencies, ETFs, or even cryptocurrencies.
There are two main types of options:
Call Option – Gives the buyer the right, but not the obligation, to buy the underlying asset at a specific price before a specific date.
Put Option – Gives the buyer the right, but not the obligation, to sell the underlying asset at a specific price before a specific date.
The specific price is called the strike price, and the last day the contract is valid is the expiry date.

Automated AI Trading1. What is Automated AI Trading?
Automated AI trading is a system that uses machine-learning models to identify market patterns, predict price movements, and execute trades without human intervention. It operates on:
Data (price, volume, order flow, macro news, sentiment)
Logic (rules, model predictions, risk parameters)
Execution engines (API connectivity with brokers/exchanges)
Feedback loops (continuous learning and improvement)
Unlike traditional algo trading, which follows fixed mathematical rules (e.g., moving average crossover), AI-driven trading systems learn from data, recognize non-linear relationships, adapt to different market regimes, and evolve over time.
How AI differs from simple algos:
Traditional Algo Trading AI-Driven Trading
Follows fixed rules Learns from millions of data points
Struggles in changing markets Adapts to new volatility and structure
Limited to indicators Understands patterns, order flow, sentiment
No self-improvement Continuously improves via ML models
This shift is why the world’s biggest hedge funds—Citadel, Renaissance, Two Sigma—rely heavily on AI-powered trading.
2. Core Components of Automated AI Trading
**1. Data Collection Systems
AI learns from large amounts of data such as:
Historical price data (candles, ticks)
Volume profile and order-book data
News articles, macro releases
Social media sentiment
Company fundamentals
Global market correlations (Forex, commodities, indices)
The more accurate the data, the more powerful the AI.
2. Machine-Learning Models
AI trading uses models like:
Supervised learning → Predicting future prices from historical patterns
Unsupervised learning → Detecting hidden clusters and regimes
Reinforcement learning → Teaching models how to “reward” profitable actions
Deep learning → Working on complex and high-dimensional inputs (order flow, charts)
For example, a reinforcement learning model may learn to buy dips in a rising market and fade breakouts in a choppy market because it has “experienced” millions of simulated trades.
3. Strategy Engine
This links model predictions to market actions. It includes:
Entry signals
Exit signals
Stop-loss and target placement
Position sizing
Hedging decisions
Time-based rules
Even if the AI predicts a bullish move, the strategy engine decides:
how much capital to deploy,
how many trades to execute,
whether to trail SL or take partials,
whether to hedge via options.
4. Order Execution Engine
This is the part that actually executes trades through APIs. It handles:
Slippage control
Spread detection
Smart order routing
Latency optimization
High-frequency micro-decisions
Professional systems place orders in milliseconds to take advantage of liquidity pockets.
5. Feedback & Reinforcement System
AI trading bots track every action:
Did the model react correctly?
Was there unnecessary drawdown?
Did volatility shift?
Did correlations break?
These results feed back into the learning cycle, making the system smarter.
3. How Automated AI Trading Works Step-by-Step
Here’s a simplified version of how an AI system might trade Nifty or Bank Nifty:
Data Input:
The AI collects candlesticks, volume profile, India VIX, global cues (SGX/GIFT Nifty), news sentiment, and order-flow metrics.
Prediction:
The model predicts probabilities such as:
Market trending or ranging
Expected volatility
Direction bias (up/down/neutral)
Strength of buyers vs sellers
Signal Generation:
If the AI believes there is a 70% chance of an upside breakout based on VWAP deviation, delta imbalance, and global sentiment, it triggers a buy signal.
Risk Management:
The AI sets SL based on ATR or structure, adjusts position sizing based on volatility, and may hedge using options if needed.
Execution:
Orders are placed instantly at the best liquidity point, often slicing orders to reduce slippage.
Monitoring & Adaptation:
If volatility spikes due to news, the AI tightens stops or exits early.
Feedback Learning:
After the trade, the outcome is fed back into the model to refine future decisions.
This continuous loop is what makes AI trading so powerful.
4. Types of AI Trading Strategies
AI systems can run multiple strategy categories simultaneously:
1. Trend-Following AI Strategies
They identify trending markets using ML-based pattern recognition.
Useful for:
Indices
FX
Commodities
2. Mean Reversion AI Strategies
The AI detects overextensions or liquidity vacuum areas.
Excellent for:
Low-volatility equities
Options premium selling
3. High-Frequency Trading (HFT)
AI reads order-book microstructure and executes trades in milliseconds.
4. Arbitrage & Statistical Arbitrage
The system scans correlated assets (e.g., Nifty–BankNifty, Gold–USDINR) and identifies mispricing.
5. Option Trading AI Models
They use Greeks, IV crush patterns, gamma exposure, and flow data to:
Sell premium during low volatility
Buy options during breakout volatility expansions
Hedge positions dynamically
5. Advantages of Automated AI Trading
1. Eliminates Emotional Trading
Fear, greed, revenge trading, and FOMO are removed completely.
2. Faster Decision Making
AI can scan hundreds of markets in milliseconds.
3. High Accuracy in Pattern Recognition
It sees relationships invisible to human eyes.
4. Consistency
AI follows rules perfectly 24/7 with no fatigue.
5. Ability to Adapt
Markets shift from trending to ranging, from low to high volatility—AI systems detect these shifts early.
6. Better Risk Management
AI adjusts SL, TS, exposure, and hedging dynamically.
6. Limitations of Automated AI Trading
Despite its power, AI trading has practical challenges:
1. Overfitting Risk
Models may memorize old data and fail in live markets.
2. Regime Changes
AI trained on low-volatility years might struggle during black-swan events.
3. Technology Costs
High-quality data, GPUs, and low-latency infra are expensive.
4. Black-Box Nature
Many AI decisions lack transparency—difficult to interpret.
5. Dependency
Traders relying too much on bots may lose market intuition.
7. The Future of Automated AI Trading
The next era will combine:
AI + Market Structure
Using volume profile, liquidity zones, order-flow imbalance.
AI + Global Macro Intelligence
Models that read FOMC statements, inflation prints, and currency flows.
AI + Voice/Chat Interfaces
Traders will speak: “AI, manage my Nifty long, hedge with a put spread,” and the system will execute.
AI-Driven Portfolio Automation
Fully autonomous wealth-management engines.
We are entering a world where AI will not assist traders—it will act as a complete trading partner.
Conclusion
Automated AI trading is transforming financial markets by combining vast data processing, machine learning, and rule-based automation. It removes human emotion, enhances precision, adapts to market shifts, and executes strategies with high speed. While it comes with limitations like overfitting and model opacity, the benefits far outweigh the challenges. Whether you trade indices, equities, commodities, or options, AI will play a central role in future trading success.

Smart Options Strategies1. What Makes an Options Strategy “Smart”?
A strategy becomes smart when it has:
✔ Defined Risk
You must always know the maximum loss before entering a trade. Smart strategies use spreads, hedges, and risk caps.
✔ High Probability of Profit
Instead of chasing home runs, smart traders target high-probability setups using delta, implied volatility, and data-backed levels.
✔ Edge From Volatility
Most retail traders ignore implied volatility (IV). Smart traders sell options when IV is high, and buy options when IV is low.
✔ Time Decay Advantage
Smart strategies often sell premium so theta works in your favor.
✔ Directional but Hedged
Directional trades must include some level of risk protection.
✔ Market Structure Alignment
No strategy works alone; it must match:
Trend (up, down, sideways)
Volatility environment
Support/Resistance
Momentum levels
2. Smart Strategies for Trending Markets
A. Vertical Spreads (Bull Call / Bear Put)
Vertical spreads are smart because they lower the cost, define risk, and give directional exposure with far less stress than naked options.
1. Bull Call Spread (Uptrend Strategy)
Buy ATM call
Sell OTM call
Limited risk & limited reward
Best used in steady uptrends
Why smart?: Reduces premium cost by 40–60% and controls emotions.
2. Bear Put Spread (Downtrend Strategy)
Buy ATM put
Sell OTM put
Works in controlled downtrends
Why smart?: Cheaper than naked puts and gives clear risk-reward structure.
B. Covered Call
If you own stocks and expect slow upward movement, sell OTM calls and earn a consistent income.
Why smart?:
Generates passive premium
Reduces cost basis
Safer than naked options
Ideal for long-term investors who want side income.
C. Cash-Secured Put
Selling a put at a support level
You collect premium
If assigned, you buy stock at a discount
Why smart?:
High-probability income strategy
Great for undervalued stocks
Safer than buying at market price
3. Smart Strategies for Sideways Markets
Most markets are range-bound for 60–70% of the time. Professional traders make money even in flat markets using credit spreads and range strategies.
A. Iron Condor
This is one of the smartest non-directional strategies.
Structure:
Sell OTM call spread
Sell OTM put spread
Collect premium from both sides
Your view: Market stays inside a range.
Why smart?:
High probability (70%–85%)
Neutral strategy
Benefits from theta decay
Risk is defined
Smart traders use Iron Condors in:
Low-volatility phases
Consolidation zones
Before stable events (not before major announcements)
B. Iron Butterfly
A more aggressive version of condor.
Structure:
Sell ATM straddle (call + put)
Hedge with OTM wings
Why smart?:
High premium
Tight risk box
Ideal for strong consolidations
4. Smart Strategies for High-Volatility Markets
During events like Fed meetings, India budget, RBI policy, earnings, or global chaos, IV increases sharply. Smart traders sell expensive options to exploit this.
A. Straddle Sell (Advanced)
Sell ATM call & ATM put
Best used:
Only by skilled traders during extremely stable markets or right after volatility spikes.
Why smart:
Maximum theta advantage
Profits from volatility crush
But needs:
Strict risk management
Adjustment rules
Exit discipline
B. Strangle Sell
Sell OTM call
Sell OTM put
Less risky than a straddle. Suitable when you expect market to stay within a broader range.
Why smart:
Wider profit zone
Higher probability
Uses IV crush effectively
5. Smart Strategies for Low-IV Markets
When implied volatility is very low, option premiums are cheap. Smart traders buy options or debit spreads.
A. Long Straddle
Buy ATM call
Buy ATM put
Used when you expect a big move but uncertain direction.
B. Long Strangle
Buy OTM call
Buy OTM put
Lower cost than a straddle.
Why smart?:
Best for breakout traders
Profits from volatility expansion
6. Smart Adjustments (The Secret Behind Profitable Option Traders)
Strategies alone are not smart—adjustments make them powerful.
✔ Rolling
Move options to a later expiry or better strike if wrong direction.
✔ Converting spreads
Convert naked options → spreads
Convert condor → butterfly
Convert straddle → strangle
✔ Locking gains
When one side of the trade is fully profitable, close it and keep the other side running.
✔ Hedging with futures
Smart traders hedge using Nifty/BankNifty futures when market moves aggressively.
7. Smart Strategy Selection Based on Market Conditions
Market Condition Smart Strategy
Strong Uptrend Bull Call Spread · Covered Calls · Cash Puts
Strong Downtrend Bear Put Spread · Ratio Put Spread
Sideways Market Iron Condor · Calendar Spread · Short Strangle
Volatile Market Straddle/Strangle Sell · Iron Fly · Debit Spreads
Breakouts Long Straddle · Strangle · Vertical Spreads
This is the rulebook professional traders follow.
8. Smart Greeks-Based Trading
Smart traders analyze the Greeks before executing a trade:
✔ Delta – Directional risk
Use delta to position trades according to trend.
✔ Theta – Time decay
Sell premium when theta is in your favor.
✔ Vega – Volatility sensitivity
Sell options when IV is high
Buy options when IV is low
✔ Gamma – Sensitivity to big moves
High gamma helps in long straddle/strangle during breakout phases.
9. Smart Position Sizing
Even the best strategies fail without proper money management.
Smart rules:
Risk only 1–2% of capital per trade
Avoid naked options unless experienced
Prefer spreads for controlled risk
Avoid overtrading during volatile news days
10. Smart Psychology in Options Trading
Your strategy is only 30% of success; psychology is 70%.
Smart traders:
Avoid emotional entries
Don’t chase runaway options
Close losing trades early
Avoid revenge trades
Stick to predefined rules
They understand that options trading is not about prediction—it’s about probability + discipline.
Conclusion
Smart options strategies are structured, risk-defined, volatility-aware tactics used by professional traders to maximize profits while minimizing risk. Whether you are trading trending markets, sideways markets, breakout phases, or volatile conditions, selecting the right strategy gives you a huge edge over random directional betting.
By combining:
Proper strategy selection
Volatility analysis
Greeks
Market structure
Adjustments
Psychology
you transform from a guess-based trader to a smart, systematic options trader.
Macro Events and Their Impact on the Indian Market1. Global Monetary Policy and Interest Rates
One of the strongest macro forces is the US Federal Reserve’s policy, followed by decisions from the RBI. When global central banks hike interest rates, especially the Fed, foreign investors tend to move their capital towards the US because higher yields become attractive. This leads to:
FPI outflows from Indian equities and bonds
Rupee depreciation
Volatility spikes in Nifty and Bank Nifty
RBI intervention in forex markets
Conversely, when global rates fall or the Fed hints at dovishness, money flows into emerging markets, creating rallies. Indian stocks, particularly financials and large caps, benefit the most.
2. Inflation Trends and Price Stability
Inflation is a key macro indicator. Rising inflation reduces purchasing power, increases raw material costs, and compresses corporate margins. When inflation spikes:
RBI increases interest rates
Borrowing costs rise
Economic growth slows
Sectors like banks, autos, real estate face pressure
Moderate and stable inflation supports steady growth in GDP and corporate earnings. India’s CPI data and the US inflation numbers are therefore watched closely by traders, as they shape interest rate expectations.
3. Fiscal Policies: Budget, Taxation, Government Spending
Every February, the Union Budget is one of the most powerful macro events influencing Indian markets. Government spending on infrastructure, agriculture, manufacturing, and welfare programs affects sectoral performance:
Higher capex → bullish for construction, cement, metals, railways, infra
Lower corporate tax → boosts earnings → Nifty re-rating
Changes in import/export duties → impact autos, electronics, oil & gas
Fiscal deficit numbers also matter. A high deficit worries investors because it increases borrowing and inflation risk. A lower-than-expected deficit boosts bond prices and strengthens the rupee.
4. Global Commodity Prices (Crude Oil, Gold, Metals)
India is a major importer of crude oil, so oil prices significantly impact inflation, the rupee, and fiscal deficit.
Rising crude → higher fuel prices → inflation → rate hikes → market pressure
Falling crude → lower inflation → stronger rupee → corporate margin expansion
Metal prices (aluminium, copper, steel) affect manufacturing and infra companies, while gold movements influence currencies and interest rate dynamics.
5. Geopolitical Events and Global Tensions
Geopolitical events include wars, trade tensions, sanctions, border conflicts, and diplomatic breakdowns. These events increase uncertainty, which is the enemy of financial stability. Impacts include:
Supply chain disruptions
Rising commodity prices
Risk-off sentiment globally
FPI selling in emerging markets
Recent examples such as US-China tensions, Russia-Ukraine war, and Middle East conflicts all created volatility in Indian markets.
6. Currency Movements and Rupee Dynamics
The rupee’s performance is a barometer of macro health. A depreciating rupee:
Increases import costs
Worsens inflation
Reduces foreign investor confidence
However, exporters like IT, pharma, textiles, and chemicals benefit from a weaker rupee.
A stronger rupee generally signals macro strength, lower inflation, and high capital inflows.
7. GDP Growth Trends and Economic Cycles
GDP growth is the ultimate measure of economic performance. Strong GDP growth signals a healthy economy and supports:
Higher corporate profits
Strong labor market
Rising consumption
Rising credit demand
Weak GDP prints, on the other hand, lead to:
Lower earnings estimates
Reduced valuations
Bearish market sentiment
Traders look at quarterly GDP numbers, industrial production, and PMI data to gauge the direction of the market.
8. FPI/FII and DII Flow Trends
Foreign Institutional Investors (FIIs/FPI) and Domestic Institutional Investors (DIIs) play a major role in the Indian market. FIIs react heavily to global macro events, while DIIs respond to local economic trends.
FPI buying → Nifty surges
FPI selling → sharp corrections, rupee weakens
DII buying (mutual funds, LIC) → stabilizes markets during global volatility
Tracking FPI/DII trends is crucial for predicting short-term market direction.
9. Corporate Earnings Season
Though company-specific, earnings seasons reflect the macro environment. Strong earnings indicate:
Good demand
Better pricing power
Strong credit cycle
Weak earnings reflect macro issues like inflation, currency depreciation, or weak consumer spending.
Market-wide earnings downgrades often precede significant corrections.
10. Weather Patterns, Monsoons, and Climate Risks
India is heavily dependent on the monsoon. A strong monsoon leads to:
Higher rural consumption
Better crop output
Lower food inflation
Higher GDP growth
A weak monsoon disrupts agriculture, increases food prices, and leads to inflationary pressure, forcing RBI to tighten policy. Climate change events like heatwaves or floods also impact agriculture and supply chains.
11. Political Stability and Policy Reforms
Political stability is one of India’s biggest strengths. Stable governments encourage:
Long-term reforms
Foreign investments
Stronger capital markets
Reforms such as GST, PLI schemes, disinvestment, labor law changes, and digitalization have attracted global capital. Elections are major macro events, often creating pre-result volatility.
12. Banking Sector Health and Credit Cycle
The health of the banking sector influences the overall economic cycle. Low NPAs, strong credit growth, and stable interest rates support expansion. Banking crises—like those in certain global banks—can create panic even in Indian markets.
13. Global Market Movements (US, China, Europe)
Indian markets take cues from global indices:
S&P 500, Nasdaq → tech and IT stocks
Hang Seng, Nikkei, DAX → emerging market sentiment
Risk-on/risk-off cycles decide whether money flows to India or away from it.
The Indian market typically reacts immediately to overnight US market movements.
Conclusion
Macro events are the heartbeat of the Indian financial market. They influence liquidity, valuations, risk sentiment, and corporate earnings. From global interest rates to fiscal policy, from geopolitical tensions to domestic inflation, each macro factor leaves a distinct footprint on sectors, indices, and investor behavior.
A trader who understands the macro landscape gains a tremendous edge: the ability to anticipate market moves rather than just react to them. With India becoming a global economic powerhouse, macro analysis is no longer optional—it is a necessity for successful long-term investing and profitable short-term trading.

Trading Plans for Success1. Why a Trading Plan is Essential
Markets are emotional places. Prices move fast, news flows unexpectedly, and traders often react out of fear or greed. A trading plan removes this emotional bias by giving you pre-defined rules. Instead of thinking “Should I buy or sell?” in the moment, you act according to a system you created when you were calm and logical.
A trading plan is your personal constitution.
It answers essential questions:
What market conditions will I trade?
What strategies will I use?
How much capital will I risk per trade?
How will I manage winners and losers?
What will I track and improve over time?
Successful traders spend more time refining their trading plan than blindly hunting for signals.
2. Core Components of a Successful Trading Plan
A robust plan includes these core pillars:
A. Personal Profile & Trading Goals
Every trader is different.
Ask yourself:
What is my financial goal?
How much time can I give to trading daily?
Am I a conservative, moderate, or aggressive trader?
Do I prefer short-term (scalping, intraday), medium-term (swing), or long-term (position) trading?
Your plan should match your personality. For example, if you are emotional and impatient, scalping may be risky. If you have a full-time job, swing trading may suit you better.
B. Market Selection
Do not trade everything. Select a niche.
Equity cash
Index futures
Stock options
Commodity futures
Forex pairs
Crypto (if allowed and you understand the risks)
Traders who trade too many instruments lose focus. Choosing 2–4 instruments allows you to understand their behaviour, volatility, and volume profiles more deeply.
C. Entry & Exit Strategy
Your plan must explain exactly when you enter and exit trades.
This includes:
Indicators or price patterns you use
Timeframes (e.g., 5-min, 15-min, 1-hr, daily)
Conditions that validate a trade
Conditions that invalidate a trade
Profit targets
Stop loss placement
Scaling in or out rules
For example, your plan may say:
“Buy only when price is above 20 EMA, RSI is above 50, and volume is increasing.”
A clear system removes guesswork.
D. Risk Management Rules
This is the heart of a successful trading plan.
Maximum risk per trade (e.g., 1–2% of total capital)
Maximum daily loss (e.g., stop trading if 3% capital lost in a day)
Position sizing formula
Avoiding over-trading
Rules for trading during high-impact news events
Most traders lose not because of wrong analysis, but because of poor risk control.
E. Trade Management
After entering a trade, the plan guides:
Do you move SL to breakeven after certain profit?
Do you trail stop loss?
Do you exit partially at certain levels?
When do you accept that the trend is reversing?
Your plan should protect both your capital and your profits.
3. Psychology & Discipline in a Trading Plan
Even the best strategy fails without discipline. A trading plan gives structure, but psychology keeps you following the structure.
Key psychological rules:
Never revenge trade
Never add to losing positions
Avoid checking P&L constantly
Follow the plan even after losses
Take breaks if emotionally unstable
A calm mind trades better than a brilliant mind.
4. Journaling and Performance Tracking
A successful plan requires tracking and improvement. Every trade should be recorded in a journal:
Why you entered
Why you exited
Profit or loss
Market conditions
Emotional state
What you learned
This data helps you identify patterns in your behaviour and refine your plan further.
5. Backtesting & Forward Testing
Before risking real capital, a strategy should be tested.
Backtesting: Check how your strategy performs on past data
Forward testing: Try the strategy on paper trading or small capital
Optimization: Adjust rules based on results
Validation: Ensure the changes make logical sense
This step deletes emotional biases and gives confidence in your system.
6. Daily, Weekly, and Monthly Routines
To maintain consistency, a trader needs routines.
Daily Routine:
Pre-market scan
Identify key levels
Review economic events
Decide what setups you are willing to trade today
After market: Journal trades
Weekly Routine:
Review all trades of the week
Identify mistakes
Study one pattern or strategy
Plan watchlist for next week
Monthly Routine:
Equity curve analysis
Win/loss ratios
Average profit per trade
Areas of improvement
Trading success is built on routines.
7. Adapting the Plan to Market Conditions
Markets change. A plan should not be rigid; it should evolve.
Different conditions require different approaches:
Trending markets
Range-bound markets
High volatility
Low volatility
News-driven markets
Your plan should define how you adjust position sizes, setups, and risk in each environment.
8. Common Mistakes Traders Make Without a Plan
Over-trading
Fear of missing out (FOMO)
Jumping between strategies
Trading based on news noise
Lack of risk control
Emotional exits
No proper review of trades
A plan removes these mistakes.
9. Building a Sample Trading Plan (Simple Version)
Here’s a short example:
Trading Style: Intraday index futures
Instruments: Nifty & Bank Nifty
Entry Rule:
Buy when price breaks VWAP + bullish candle + rising volume
Exit Rule:
SL = last swing low
Target = 1:2 risk-reward
Risk Rules:
Max loss per trade = 1%
Max daily loss = 3%
Stop trading after 2 consecutive losses
Psychology:
No revenge trades
Take break after big loss
Review:
Journal every trade
Weekly performance check
A real plan will be much more detailed, but this shows the structure.
10. Final Thoughts: A Trading Plan is a Lifelong Process
Success in trading is not about predicting markets; it is about controlling yourself. A trading plan helps you act like a professional, not a gambler. It builds consistency, discipline, and confidence—three pillars of long-term success.
Trading plans evolve as you grow. Over months and years, your plan becomes sharper, simpler, and more powerful. Ultimately, the goal is not to create the perfect plan, but a plan that makes you trade with clarity, control, and confidence.
Stop Trying to Recover Losses. Start Trying to Build ConsistencyHello Traders!
Every trader goes through losses. But what separates a struggling trader from a successful one is not the size of their wins, it’s what they focus on after a loss.
Most traders waste months trying to “get back” the money they lost.
But the truth is simple: the more you chase recovery, the more you lose.
Your real job is not to recover losses, it’s to build consistency.
1. Loss Recovery Creates Emotional Pressure
When you trade just to recover what you lost, you stop thinking logically.
You increase lot size, enter without confirmation, and ignore your plan.
This emotional pressure makes you take trades you would never take in a calm state.
Recovery trading doesn’t fix losses, it multiplies them.
2. Consistency Has No Ego
Consistency doesn’t care about your last loss or last win.
It’s about following the same rules every day, no matter what happened yesterday.
Small, controlled wins compound over time, and slowly replace every old loss.
Consistency creates stability. Stability creates clarity. Clarity creates profits.
3. When You Stop Chasing, You Start Thinking
You no longer rush entries, you wait for your setup.
You risk only what fits your plan, not what your emotions whisper.
You accept that losses are part of your business, not threats to your ego.
A calm mind sees opportunities a stressed mind can’t.
4. The Real Recovery Happens Naturally
When your focus shifts from recovering to improving, your trades automatically become better.
Consistency makes your equity curve smoother.
Slow, steady growth quietly replaces big losses without you forcing anything.
Professional traders don’t “recover”, they simply continue.
Rahul’s Tip:
Your next breakthrough won’t come from a big winning trade, it will come from a week where you followed your plan perfectly, even if the profits were small.
Consistency is your strongest weapon in trading. Use it.
Conclusion:
Stop fighting your past losses, they’re already gone.
Focus on building the habits that ensure you never repeat them again.
Recovery is temporary. Consistency is permanent.
If this post shifted your mindset, like it, share your thoughts in comments, and follow for more honest trading psychology lessons!
Candle Patterns Risk Management in Options
While options offer opportunities, they also carry risks:
Selling naked options can lead to unlimited losses
High leverage can magnify mistakes
Emotional trading during volatility can destroy capital
Ignoring Greeks can cause unexpected losses
Disciplined traders use:
Stop loss
Position sizing
Hedging
Proper strategy selection
Options should always be traded with clear logic, not hope or fear.

Part 2 Ride The Big MovesMoneyness of Options
Options are classified as:
In the Money (ITM) – already profitable if exercised
At the Money (ATM) – strike close to current price
Out of the Money (OTM) – not profitable yet
Traders choose strikes based on strategy, risk appetite, and market view.
Greeks: The DNA of Options
Options behave differently based on market conditions. The Greeks measure these sensitivities:
Delta – how much the option price changes with underlying movement
Gamma – how much delta changes
Theta – time decay
Vega – sensitivity to volatility
Rho – sensitivity to interest rates
Understanding Greeks helps traders manage risk and predict option behavior.
