Part 1 Ride The Big Moves 1. Introduction
Option trading is one of the most exciting parts of the stock market. It allows traders and investors to speculate, hedge risk, and generate income in ways that simple stock buying and selling cannot. But because options involve contracts with specific rights and obligations, they can seem complicated at first glance.
In this explanation, we’ll go step by step — covering what options are, how they work, the different types, common strategies, risks, and benefits.
2. What Are Options?
An option is a financial contract that gives the buyer the right, but not the obligation, to buy or sell an asset at a pre-decided price within a fixed time frame.
The asset could be a stock, index, commodity, or currency.
The price is called the strike price.
The time frame is the contract’s expiry date.
Think of an option like a reservation. For example, if you pay a small deposit to lock in the price of a phone that you might buy next month, you have an “option.” If the phone price goes up, you’re happy because you can still buy it at the old locked price. If the price goes down, you can choose not to buy — but you lose the deposit.
That’s exactly how options work in financial markets.
3. Types of Options
There are two main types:
Call Option – This gives the holder the right to buy the asset at the strike price.
Traders buy calls if they expect prices to go up.
Put Option – This gives the holder the right to sell the asset at the strike price.
Traders buy puts if they expect prices to go down.
Example:
Stock ABC is trading at ₹100.
A call option with strike price ₹105 gives you the right to buy at ₹105 before expiry.
If the stock rises to ₹120, your call becomes valuable.
If it stays below ₹105, the option may expire worthless.
4. Key Terms in Options Trading
Before going deeper, let’s understand the basic terminology:
Premium: The price paid by the option buyer to the seller.
Strike Price: The pre-decided price at which the asset can be bought/sold.
Expiry Date: The last day the option is valid.
In the Money (ITM): When exercising the option would lead to profit.
Out of the Money (OTM): When exercising would not make sense.
At the Money (ATM): When the stock price equals the strike price.
Contains image

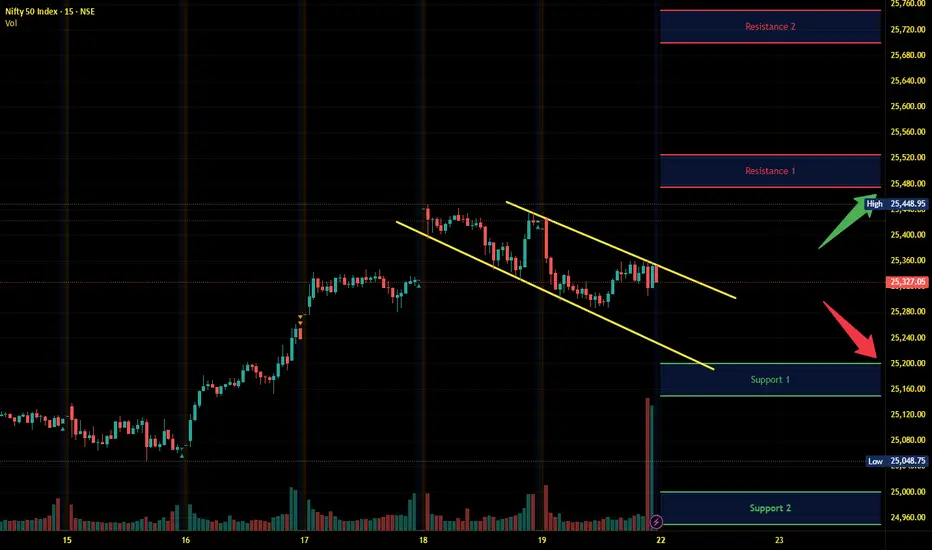
Nifty Intraday Analysis for 22nd September 2025NSE:NIFTY
Index has resistance near 25475 – 25525 range and if index crosses and sustains above this level then may reach near 25700 – 25750 range.
Nifty has immediate support near 25200 – 25150 range and if this support is broken then index may tank near 25000 – 24950 range.
Market specially IT stocks will react to imposition of exorbitant H-1B Visa fee by US and expected to open down.
Nifty Weak 25K - 24,800 wont be a Surprise Recap:
💡 View shared on 18th Sep 2025:
Trend is positive & any dip is a buy opportunity.
✅ Strength above 25,430
❌ Weakness below 25,350
⚠️ Cautions near 25,515 - 25650
Actual on 19th Sep 2025
OHLC
25,410 🎯 Strength only above 25,430.00
25,428 🎯 Strength only above 25,430.00
25,286
25,327 🎯 Given Support was 25,350.00
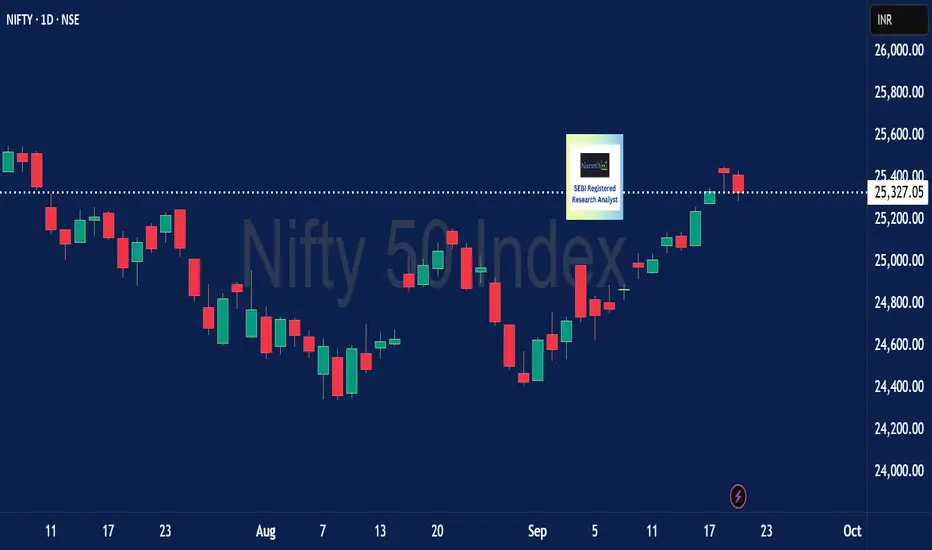
22/09/2025 Nifty View
📌 Last Close: 25,327
🔻 Support: 25,254 - 25,204
🔺 Resistance: 25,340 - 25,426
💡 View:
Trend is seems negative & Gap down opening wont be a surprise.
✅ Strength above 25,460
❌ Weakness below 25,200
⚠️ Stay Cautions in LONG & SHORT - Keep churning to avoid Volatility
👉 Do you find these daily views useful and want to receive them regularly?
If yes, show 👍
Your support motivates us to share more
💡 Liked the idea?
Then don’t forget to Boost 🚀 it!
For more insights & trade ideas,
📲 Visit my profile and hit Follow
Warm regards,
Naresh G
SEBI Registered Research Analyst
💬 Comment below if you want me to analyse any stock for you 🔍
Trdaing Master Class With Experts 1. Option Terminology
Understanding options requires familiarity with specific terms:
In the Money (ITM):
Call: Spot price > Strike price
Put: Spot price < Strike price
At the Money (ATM):
Spot price ≈ Strike price
Out of the Money (OTM):
Call: Spot price < Strike price
Put: Spot price > Strike price
Intrinsic Value: The real value if exercised now.
Time Value: Extra premium above intrinsic value due to time remaining until expiration.
Implied Volatility (IV): Expected volatility of the underlying asset, impacting option price.
Delta: Measures sensitivity of option price to underlying price change.
Gamma: Rate of change of delta.
Theta: Rate of decline in option value due to time decay.
Vega: Sensitivity to changes in volatility.
2. Types of Options
Options can be classified based on exercise style and underlying asset:
2.1 Exercise Style
American Options: Can be exercised anytime before expiration.
European Options: Can only be exercised at expiration.
2.2 Based on Underlying Asset
Equity Options: Based on stocks.
Index Options: Based on stock indices.
Commodity Options: Based on commodities like gold, oil, or agricultural products.
Currency Options: Based on forex pairs.
ETF Options: Based on exchange-traded funds.
3. Option Pricing Models
Option pricing is influenced by multiple factors. The most widely used model is the Black-Scholes Model, which calculates the theoretical price of an option based on:
Current stock price
Strike price
Time to expiration
Volatility
Risk-free interest rate
Dividends
Other models include:
Binomial Model: Useful for American options with the flexibility of early exercise.
Monte Carlo Simulation: Simulates random paths to estimate option value.
Factors affecting pricing:
Intrinsic value: The difference between spot price and strike price.
Time value: More time to expiration = higher option value.
Volatility: Higher volatility increases potential for profit, raising option price.
Interest rates: Higher risk-free rates slightly increase call prices.

Trdaing Master Class With Experts1. Introduction to Options
Options are financial derivatives that give the buyer the right, but not the obligation, to buy or sell an underlying asset at a specified price before or on a predetermined date. Unlike stocks, where ownership is outright, options are contracts with specific conditions.
Underlying asset: Can be stocks, indices, commodities, currencies, or ETFs.
Strike price: The price at which the option can be exercised.
Expiration date: The date on which the option contract expires.
Premium: The price paid by the buyer to acquire the option.
Options are categorized into two main types:
Call Options: Give the holder the right to buy the underlying asset at the strike price.
Put Options: Give the holder the right to sell the underlying asset at the strike price.
2. The Mechanics of Option Trading
Option trading involves two parties: the buyer (holder) and the seller (writer).
Option Buyer (Holder):
Pays a premium for the right.
Can choose whether to exercise the option.
Risk is limited to the premium paid.
Option Seller (Writer):
Receives the premium.
Obliged to fulfill the contract if the buyer exercises.
Risk can be unlimited (for naked calls) or limited (for covered positions).
Key Features of Options
Leverage: Options allow controlling a large number of shares with a relatively small investment.
Limited Risk for Buyers: Buyers can only lose the premium paid.
Flexibility: Options can be used for speculation, hedging, or income strategies.
Time Decay: Option value declines over time, especially for out-of-the-money options.
Volatility Sensitivity: Options pricing is heavily affected by changes in market volatility.

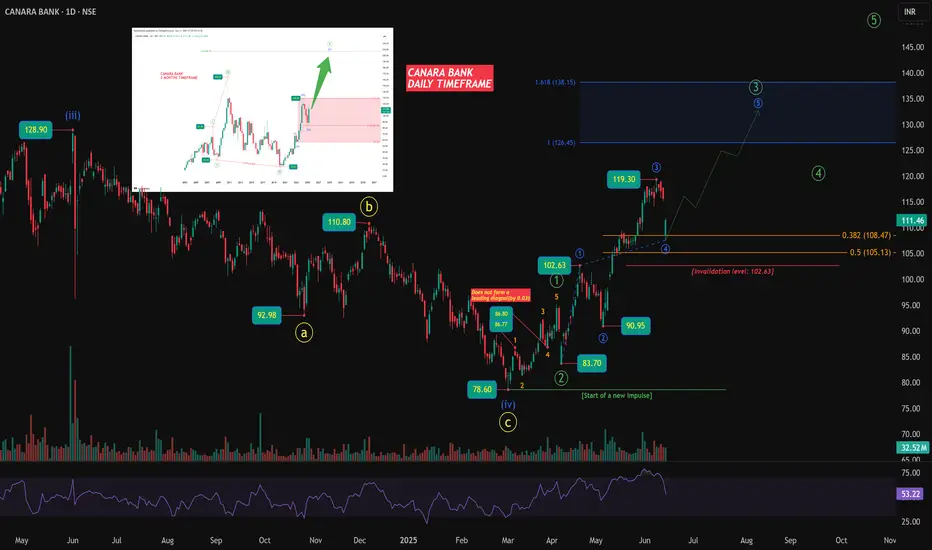
A Rally Born in Silence: The Canara Bank SetupCanara Bank – Multi-Timeframe Impulse Reloaded
On the 3-month timeframe, Canara Bank is staging what looks like a textbook long-term Elliott Wave impulse. With Wave (IV) bottoming out around ₹15.15 and a roaring rally taking us into Wave (V), the broader structure suggests that this could be the start of a generational uptrend, aiming toward the 2.618 extension near ₹206.
Dropping down to the daily chart, things get even more compelling. The move off the March 2025 lows at ₹78.60 is showing all the signs of a fresh impulsive structure. That low aligns precisely with the higher-degree Wave (IV), suggesting the beginning of Wave (V) is already underway. What’s particularly interesting is how the current rally is unfolding — the green Wave 3, which started from ₹83.70, appears to be extending. It has already subdivided into a clean internal five-wave structure, with blue subwaves 1 through 4 in place and blue wave 5 in progress.
This kind of extended third wave is not only typical but often the most powerful part of the move, carrying the strongest momentum. The current wave is aiming toward the 1.618 projection zone around ₹138, which would be a fitting cap for an extended third. Once this fifth subwave of green 3 completes, a corrective green Wave 4 would be due, likely shallow given the strength of the third wave, followed by one final push in green 5.
On the risk side, the structure remains intact as long as price holds above ₹102.63 — the invalidation level for the current count. A break below would suggest the impulse failed and could force a reassessment of the bias. Until then, both the short-term and long-term wave counts remain firmly aligned to the upside, with momentum backing the structure on multiple timeframes.
Chart will be updated as price action evolves.
Disclaimer: This analysis is for educational purposes only and does not constitute investment advice. Please do your own research (DYOR) before making any trading decisions.
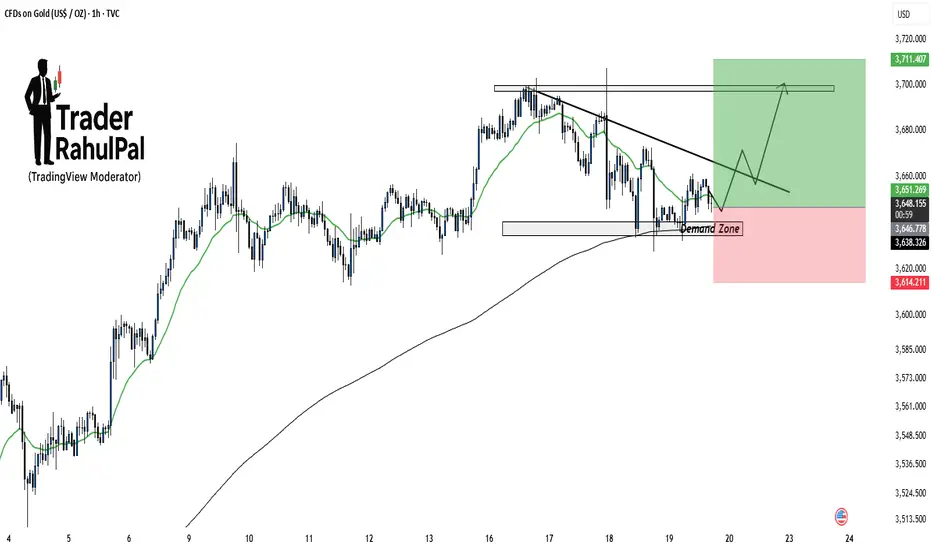
Gold Demand Zone Holding – Upside Potential Toward 3710!Gold is currently testing a demand zone around 3640–3650 , which aligns well with moving average support. As long as this zone holds, price action favors a potential bounce toward the falling trendline and eventually the key resistance area near 3710 . Short-term buyers may look for confirmation inside the demand zone before positioning, while a breakdown below 3614 would invalidate this setup.
Disclaimer: This analysis is for educational purposes only and should not be taken as financial advice. Please do your own research or consult your financial advisor before investing.
Option vs Stock Trading: A Complete Analysis1. Introduction to Stock Trading
1.1 What is Stock Trading?
Stock trading involves buying and selling shares of a company, representing ownership in that company. A stockholder owns a fraction of the company and may benefit from:
Price appreciation: If the stock’s market price increases, the value of the investment rises.
Dividends: Companies may distribute a portion of profits as cash dividends.
Stock trading occurs primarily on stock exchanges such as the NYSE, NASDAQ, and NSE, and prices are influenced by market supply-demand dynamics, company performance, and macroeconomic factors.
1.2 Types of Stock Trading
Day Trading: Buying and selling stocks within the same trading day to exploit short-term price movements.
Swing Trading: Holding stocks for a few days to weeks to benefit from medium-term trends.
Position Trading: Long-term holding based on fundamentals or long-term trends.
Investing: Buying and holding shares for years, focusing on company fundamentals, dividends, and capital growth.
1.3 Benefits of Stock Trading
Ownership & Voting Rights: Investors gain partial ownership and voting power in company decisions.
Long-Term Growth: Stocks historically provide substantial returns over time.
Liquidity: Large-cap stocks are highly liquid, allowing easy entry and exit.
Transparency: Companies are required to disclose financial statements, enhancing investor knowledge.
1.4 Risks of Stock Trading
Market Risk: Stock prices fluctuate due to macroeconomic or sectoral changes.
Business Risk: Company-specific events like poor earnings or management failures.
Liquidity Risk: Some small-cap stocks may be difficult to sell quickly without affecting price.
Opportunity Cost: Capital locked in underperforming stocks could be used elsewhere.
2. Introduction to Options Trading
2.1 What Are Options?
Options are financial derivatives that provide the right, but not the obligation, to buy or sell an underlying asset (commonly stocks) at a predetermined price (strike price) before or on a specific date (expiration date). Options are broadly classified as:
Call Options: Right to buy an asset at a strike price.
Put Options: Right to sell an asset at a strike price.
Unlike stocks, options do not represent ownership but rather contractual rights to trade an underlying asset.
2.2 Key Terms in Options Trading
Premium: The price paid to purchase an option.
Strike Price: The predetermined price at which the asset can be bought or sold.
Expiration Date: The date by which the option must be exercised.
In-the-Money (ITM), At-the-Money (ATM), Out-of-the-Money (OTM): Terms describing the intrinsic value of an option.
2.3 Types of Options Trading
Speculation: Traders use options to bet on price movements with limited capital.
Hedging: Investors use options to protect against adverse price movements in their stock holdings.
Income Generation: Strategies like covered calls allow earning premium income from owned stocks.
2.4 Benefits of Options Trading
Leverage: Control a larger position with a smaller capital outlay.
Flexibility: Wide range of strategies to profit in bullish, bearish, or sideways markets.
Limited Risk (for buyers): Maximum loss is limited to the premium paid.
Hedging: Protect stock portfolios against losses.
2.5 Risks of Options Trading
Complexity: Requires understanding of Greeks, strategies, and volatility.
Time Decay: Option value erodes as expiration approaches (Theta risk).
Liquidity Risk: Some options may have low trading volumes.
Unlimited Losses (for sellers): Writing uncovered options can lead to huge losses.
3. Mechanics of Trading Stocks vs Options
3.1 How Stock Trading Works
Account Opening: Investors open a brokerage account.
Selection of Stock: Based on fundamental or technical analysis.
Placing Order: Buy/sell at market or limit price.
Settlement: Usually T+2 days in most markets.
Profit Realization: Sell at a higher price or receive dividends.
3.2 How Options Trading Works
Account Requirement: Options trading requires margin approval and understanding of risk levels.
Selection of Option: Decide on type (call/put), strike price, and expiration.
Placing Trade: Pay premium to buy or receive premium to sell.
Strategies: Single-leg (basic) or multi-leg (complex) strategies can be applied.
Profit Realization:
Exercising the Option: Buy/sell underlying stock at strike price.
Closing the Option: Sell option before expiration to capture premium changes.
4. Strategic Applications
4.1 Stock Trading Strategies
Buy and Hold: Focus on long-term growth and dividends.
Growth Investing: Invest in companies with high earnings growth potential.
Value Investing: Buy undervalued stocks based on fundamentals.
Technical Trading: Use charts, trends, and indicators to profit from price movements.
4.2 Options Trading Strategies
Protective Put: Buy a put to hedge a stock position.
Covered Call: Sell call options on owned stocks for premium income.
Straddle/Strangle: Bet on volatility without predicting direction.
Iron Condor/Butterfly: Advanced strategies to profit in low-volatility scenarios.
5. Leverage and Capital Efficiency
5.1 Leverage in Stock Trading
Buying stocks outright requires full payment.
Margin trading allows borrowing, increasing risk and potential returns.
5.2 Leverage in Options Trading
Options provide high leverage because a small premium controls a large number of shares.
Example: Buying 1 call option (representing 100 shares) requires much less capital than buying 100 shares outright.
Key Insight: Leverage amplifies profits but can also magnify losses if not managed carefully.
6. Risk and Reward Dynamics
6.1 Risk-Reward in Stocks
Upside Potential: Unlimited in theory.
Downside Risk: Limited to the total investment.
6.2 Risk-Reward in Options
Option Buyer: Risk limited to premium paid; profit potential theoretically unlimited.
Option Seller: Receives premium; risk can be unlimited if uncovered.
Time Decay Factor: Options lose value as expiration approaches, adding a layer of risk not present in stock trading.
7. Market Behavior and Volatility Impact
7.1 Stocks
Prices influenced by company fundamentals, news, earnings, and macro events.
Volatility affects price swings but is generally less dramatic for long-term investors.
7.2 Options
Value depends on stock price, volatility (Implied Volatility), time to expiration, interest rates, and dividends.
Options allow profiting from both directional moves and volatility changes.
8. Practical Considerations for Traders
Capital Requirement: Options require less capital upfront but are more complex.
Time Commitment: Day traders and option speculators must monitor markets constantly.
Learning Curve: Stock trading is easier to start; options require deeper understanding.
Tax Implications: Option gains can have different tax treatment than stock gains in many jurisdictions.
Brokerage and Fees: Options trades often have higher costs per contract compared to stock trades.
9. Real-World Use Cases
9.1 When to Prefer Stock Trading
Long-term wealth creation.
Desire for dividends and ownership rights.
Low-risk exposure to market trends.
9.2 When to Prefer Options Trading
Speculating with limited capital.
Hedging an existing stock portfolio.
Leveraging volatility opportunities.
Creating complex income strategies in sideways markets.
Conclusion:
Stock trading and options trading serve different purposes and require different mindsets. Stocks are ideal for long-term ownership and steady growth, while options allow traders to strategically manage risk, leverage positions, and profit from market volatility. A balanced approach often combines both: using stocks for ownership and stability, and options for hedging, leverage, and income generation.
Understanding Fundamental Market Concepts1. Introduction to Financial Markets
Financial markets are platforms where buyers and sellers come together to trade financial instruments. They provide liquidity, transparency, and price discovery, ensuring efficient allocation of resources. Markets are not limited to stocks; they include bonds, commodities, currencies, and derivatives.
Purpose of Financial Markets
Capital formation: Businesses raise funds to expand operations or invest in projects.
Price discovery: Market prices reflect supply-demand dynamics and underlying value.
Liquidity: Investors can quickly buy or sell assets.
Risk transfer: Instruments like derivatives help shift or manage financial risk.
Economic growth: Efficient markets channel capital to productive sectors.
Types of Financial Markets
Stock markets: Trading of company shares.
Bond markets: Trading of debt securities.
Commodity markets: Trading raw materials like metals, energy, and agriculture.
Foreign exchange markets: Currency trading.
Derivatives markets: Trading contracts based on underlying assets.
2. Key Participants in Financial Markets
Understanding participants helps in analyzing market dynamics.
1. Retail Investors
Individuals trading their personal capital.
Motivated by wealth creation, savings growth, or speculation.
2. Institutional Investors
Mutual funds, hedge funds, insurance companies, and pension funds.
They control large capital pools and influence market trends.
3. Brokers and Market Makers
Brokers: Facilitate buying and selling for clients.
Market makers: Provide liquidity by quoting buy and sell prices.
4. Regulators
Ensure market transparency, fairness, and stability.
Examples: SEBI (India), SEC (USA), FCA (UK).
3. Stocks: Ownership in Companies
Stocks, also called equities, represent ownership in a company. Investing in stocks allows individuals to participate in company profits and growth.
Types of Stocks
Common stocks: Voting rights and dividends.
Preferred stocks: Fixed dividends, limited voting rights.
Stock Valuation Metrics
Market Capitalization: Stock price × total shares.
Price-Earnings (P/E) Ratio: Price per share ÷ earnings per share (EPS).
Book Value: Net asset value per share.
Dividend Yield: Annual dividend ÷ stock price.
Stock Indices
Represent performance of a group of stocks.
Examples: Nifty 50, S&P 500, Dow Jones Industrial Average.
Indices serve as benchmarks for investment performance.
Stock Trading Mechanisms
Conducted through stock exchanges like NSE, BSE, NYSE, or NASDAQ.
Primary market: Companies issue shares via IPOs to raise capital.
Secondary market: Existing shares are traded among investors.
4. Bonds and Fixed-Income Instruments
Bonds are debt instruments issued by governments or corporations to raise funds. Investors lend money to issuers and receive periodic interest payments.
Key Bond Concepts
Face value: Amount paid at maturity.
Coupon rate: Interest paid to bondholders.
Yield: Return on investment.
Credit rating: Risk assessment by agencies like Moody’s or S&P.
Types of Bonds
Government bonds (low risk).
Corporate bonds (higher returns, moderate risk).
Municipal bonds (tax advantages in some countries).
Advantages of Bonds
Lower risk than stocks.
Regular income through interest.
Diversification for a balanced portfolio.
5. Commodity Markets
Commodity markets trade raw materials critical for global industries.
Types of Commodities
Metals: Gold, silver, copper.
Energy: Oil, natural gas, coal.
Agricultural: Wheat, coffee, cotton.
Price Determinants
Supply-demand imbalance.
Weather and natural disasters.
Geopolitical events.
Currency fluctuations (especially USD).
Trading Mechanisms
Spot markets: Immediate delivery.
Futures markets: Agreements to buy/sell at future dates.
6. Foreign Exchange Markets
The forex market is the largest global financial market, facilitating currency exchange for trade, investment, and speculation.
Key Concepts
Exchange rate: Value of one currency in terms of another.
Currency pairs: e.g., EUR/USD, USD/INR.
Spot rate vs. forward rate: Immediate vs. future delivery.
Market Participants
Central banks (e.g., RBI, Fed) controlling monetary policy.
Commercial banks facilitating trade and hedging.
Retail and institutional traders speculating on currency movements.
7. Derivatives: Managing Risk
Derivatives are financial instruments whose value is derived from underlying assets (stocks, bonds, commodities, currencies).
Types of Derivatives
Futures: Obligatory contract to buy/sell at a future date.
Options: Right, but not obligation, to buy/sell at a predetermined price.
Swaps: Exchange of cash flows between parties (e.g., interest rate swaps).
Forwards: Customized contracts for future transactions.
Purpose of Derivatives
Hedging: Protect against price fluctuations.
Speculation: Profit from price movements.
Arbitrage: Exploit price differences between markets.
8. Market Analysis Techniques
Investors use multiple approaches to evaluate markets and select investments.
1. Fundamental Analysis
Evaluates intrinsic value based on economic, financial, and industry factors.
Key metrics: Earnings, revenue growth, P/E ratio, debt levels.
Macro factors: Inflation, GDP growth, interest rates, unemployment.
2. Technical Analysis
Studies historical price and volume patterns to predict future movements.
Tools: Candlestick charts, moving averages, RSI, MACD.
3. Sentiment Analysis
Gauges investor mood using news, surveys, and social media trends.
Important for predicting short-term market movements.
9. Risk and Money Management
Effective risk management ensures sustainable returns and protects capital.
Types of Market Risk
Market risk: Loss due to price movements.
Credit risk: Borrower fails to repay.
Liquidity risk: Inability to sell assets quickly.
Operational risk: Failures in systems or processes.
Risk Mitigation Techniques
Diversification: Spread investments across sectors and asset classes.
Position sizing: Invest proportionally to portfolio value.
Stop-loss orders: Limit potential losses on trades.
10. Global Market Awareness
Markets are increasingly interconnected, influenced by global economic and geopolitical developments.
Key Influencers
Global indices: S&P 500, FTSE 100, Nikkei 225 indicate economic trends.
Currency movements: Affect trade and multinational companies.
Central bank policies: Interest rate changes and quantitative easing impact markets.
Geopolitical events: Wars, elections, trade agreements affect market sentiment.
Importance
Investors must track international trends to make informed decisions.
Global awareness aids in risk diversification and long-term strategy planning.
11. Financial Products and Instruments
Investors have multiple options to gain exposure to markets:
Mutual funds: Pooled investment managed by professionals.
Exchange-Traded Funds (ETFs): Traded like stocks, tracking indices or commodities.
Real Estate Investment Trusts (REITs): Income from property portfolios.
SIP (Systematic Investment Plan): Periodic investment in mutual funds.
IPOs and FPOs: Opportunities to invest in companies at the primary market level.
These products help investors tailor risk-return profiles to their financial goals.
12. Building a Market Mindset
Successful investors develop a disciplined mindset:
Patience: Long-term wealth creation over short-term gains.
Continuous learning: Understanding evolving market trends.
Adaptability: Adjusting strategies based on economic changes.
Analytical thinking: Making decisions based on data, not emotions.
Conclusion
Mastering fundamental market concepts involves understanding market structures, instruments, participants, and analysis techniques. Investors equipped with this knowledge can navigate stocks, bonds, commodities, forex, and derivatives, balancing risk and return. Global awareness, disciplined risk management, and continuous learning are essential for sustainable market success.
The world of financial markets may appear complex initially, but breaking it down into structured learning—starting with basic concepts and progressing to global strategies—enables anyone to become a confident, informed market participant.
Risk Management in Momentum Trading1. Understanding Risk in Momentum Trading
Momentum trading relies on riding price trends, which can be unpredictable and volatile. Unlike value investing, where positions are often held long-term, momentum traders operate in shorter timeframes, making them more susceptible to sudden reversals.
1.1 Types of Risks
Market Risk: The possibility of losses due to market movements against your position. Example: A stock you bought on a bullish breakout suddenly falls due to unexpected news.
Volatility Risk: Momentum trading thrives on volatility, but extreme volatility can produce rapid reversals.
Liquidity Risk: Thinly traded stocks or assets can make it difficult to enter or exit positions without significant slippage.
News Risk: Earnings, macroeconomic data, or geopolitical events can abruptly reverse momentum.
Behavioral Risk: Emotional reactions like FOMO (fear of missing out) or panic selling can lead to poor decision-making.
2. Risk-Reward Assessment
Every momentum trade should have a clearly defined risk-reward ratio, usually at least 1:2 or higher.
Example: If you risk $100 per trade, aim for a target profit of $200 or more.
Using a favorable risk-reward ratio ensures that even if only half your trades succeed, the strategy remains profitable over time.
Momentum traders often rely on technical levels, like support/resistance, Fibonacci retracements, or trendlines, to determine profit targets.
3. Volatility Management
Momentum trading thrives on volatility, but too much volatility increases risk. Managing it requires:
3.1 Volatility Indicators
Average True Range (ATR): Measures daily price movement to adjust stop-loss and position size.
Bollinger Bands: Identify periods of high volatility where momentum can reverse.
VIX Index (for stocks): Indicates overall market fear and potential risk spikes.
3.2 Volatility-Based Position Sizing
In highly volatile markets, reduce position size to avoid large losses.
Conversely, in low-volatility environments, slightly larger positions may be acceptable because price swings are smaller.
4. Trade Planning and Discipline
Risk management in momentum trading is not just about numbers; it’s also about planning and discipline.
4.1 Pre-Trade Analysis
Identify entry points, stop-loss, and profit targets before entering a trade.
Evaluate market context, sector performance, and relative strength of the asset.
Determine acceptable loss for the trade relative to account size.
4.2 Journaling
Maintain a trading journal with entry, exit, stop-loss, profit, loss, and notes on market conditions.
Helps identify patterns, mistakes, and improve risk management decisions over time.
4.3 Avoiding Overtrading
Momentum can create excitement, but overtrading increases exposure to market risk.
Focus only on high-probability setups that meet predefined criteria.
5. Psychological Risk Management
Momentum trading requires a strong mental framework. Emotional mismanagement can lead to catastrophic losses.
5.1 Controlling Greed
Traders often hold positions too long, hoping for extra profit, risking reversal.
Discipline with profit targets and trailing stops prevents giving back gains.
5.2 Managing Fear
Fear can lead to exiting positions prematurely or hesitation to enter valid trades.
Confidence in pre-planned setups and risk rules is critical.
5.3 Avoiding FOMO
Momentum traders may feel compelled to enter trades late in a trend.
FOMO often leads to poor entry prices and inadequate stop-loss levels.
6. Hedging and Portfolio Risk
Advanced momentum traders often use hedging to manage portfolio-level risk:
Options Hedging: Using puts to protect long momentum positions in stocks.
Diversification Across Assets: Trading momentum in different markets (stocks, forex, commodities) reduces correlation risk.
Inverse ETFs or Short Positions: Can hedge downside risk during market reversals.
7. Market-Specific Risk Management
7.1 Stocks
Use stop-loss orders based on technical support/resistance levels.
Avoid thinly traded small-cap stocks to reduce liquidity risk.
Monitor market-wide news to avoid broad reversals.
7.2 Forex
Account for macroeconomic news and central bank announcements.
Use smaller position sizes during low-liquidity periods.
Consider volatility spreads and slippage in currency pairs.
7.3 Cryptocurrencies
Use tight stop-losses and smaller positions due to extreme volatility.
Avoid low-liquidity altcoins to reduce exposure to pump-and-dump schemes.
Monitor social media and news sentiment for sudden momentum shifts.
7.4 Commodities
Use futures contracts with proper margin management to avoid over-leverage.
Be aware of seasonal and geopolitical factors affecting supply-demand dynamics.
Combine trend-following indicators with volume analysis for better risk control.
8. Combining Technical Analysis with Risk Management
Technical analysis is the backbone of momentum trading. Effective risk management involves integrating technical signals with disciplined capital control:
Entry Confirmation: Only enter trades when multiple momentum indicators align.
Stop-Loss Placement: Set stops just beyond support/resistance or volatility bands.
Profit Targeting: Use Fibonacci extensions, previous highs/lows, or trendlines to lock in gains.
Exit Signals: Monitor trend weakening indicators like divergence in MACD or RSI for early exits.
9. Case Study Example
Scenario: Trading momentum in a trending stock.
Entry: Stock breaks resistance at ₹200 with high volume.
Stop-Loss: Placed at ₹195, based on ATR and recent consolidation.
Position Size: Account risk 2%, capital ₹50,000 → risk ₹1,000 → 200 shares.
Target: Risk-reward ratio 1:3 → target profit = ₹3000 → exit at ₹215.
Outcome: If stock surges to ₹215, gain ₹3,000. If reverses to ₹195, loss limited to ₹1,000.
This demonstrates capital protection, risk-reward adherence, and discipline in momentum trading.
10. Advanced Risk Management Techniques
Volatility Scaling: Adjust position sizes dynamically based on current market volatility.
Algorithmic Risk Controls: Use automated stop-losses, trailing stops, and risk alerts in high-frequency momentum trading.
Correlation Analysis: Avoid taking multiple momentum trades in highly correlated assets to reduce portfolio risk.
Stress Testing: Simulate market shocks to test the resilience of momentum strategies.
Summary
Momentum trading can generate substantial profits, but it comes with high risks. Effective risk management in momentum trading requires:
Capital allocation and position sizing to limit losses.
Stop-loss placement tailored to market volatility.
Risk-reward assessment for every trade.
Volatility management to adapt to changing market conditions.
Discipline and psychological control to prevent emotional decisions.
Market-specific adjustments for stocks, forex, cryptocurrencies, and commodities.
Advanced techniques like hedging, correlation analysis, and stress testing.
By combining these principles, momentum traders can maximize profits while minimizing potential losses, creating a sustainable trading strategy in volatile and unpredictable markets.
Market Rotation and Its Types1. Introduction
Market rotation is a core concept in financial markets that refers to the movement of capital from one sector, asset class, or investment style to another. It is a natural outcome of the ever-changing economic, political, and financial environment. By understanding market rotations, investors and traders can anticipate trends, optimize portfolio performance, and manage risks effectively.
Market rotations are often influenced by macroeconomic conditions, monetary policy, investor sentiment, interest rate cycles, inflation trends, and geopolitical developments. They reflect the underlying shifts in investor risk appetite and the changing opportunities across different segments of the market.
Importance of Market Rotation
Enhances Investment Returns: By investing in sectors or styles that are in favor, investors can capitalize on trends before they peak.
Reduces Risk: Market rotation helps avoid sectors or assets that may underperform during certain economic phases.
Portfolio Optimization: Active investors and fund managers use rotation strategies to balance growth and defensive assets.
Economic Insight: Observing rotations provides insight into where the economy is headed, as different sectors react differently to economic cycles.
2. The Concept of Market Rotation
Market rotation can be understood as a strategic reallocation of capital across different market segments. Investors move their money based on perceived risk, expected returns, and economic cycles. These rotations are cyclical and often predictable to some extent, making them an essential tool for traders and portfolio managers.
Rotations can happen:
Between sectors (e.g., technology to energy)
Between investment styles (e.g., growth to value)
Across regions (e.g., emerging markets to developed markets)
Between asset classes (e.g., stocks to bonds or commodities)
Within market capitalizations (e.g., large-cap to small-cap)
Characteristics of Market Rotation
Cyclical: Rotations often follow the economic cycle: expansion, peak, contraction, and recovery.
Predictable to Some Extent: Historical data and economic indicators can provide clues.
Influenced by External Factors: Geopolitical events, monetary policy changes, inflation, and market sentiment play key roles.
Sector-Specific: Not all sectors respond similarly to economic changes; some outperform while others lag.
3. Types of Market Rotation
Market rotations can be broadly classified into several types. Understanding these types helps investors position themselves strategically in different market conditions.
3.1 Sector Rotation
Sector rotation occurs when capital shifts from one industry sector to another based on economic conditions or market cycles. Different sectors perform differently during different stages of the business cycle.
Economic Cycle and Sector Performance
Expansion Stage: Economic growth is strong, consumer demand is high.
Best Performing Sectors: Consumer discretionary, industrials, technology.
Why: Companies expand, invest, and consumer spending rises.
Peak Stage: Growth reaches its highest point, inflation may rise.
Best Performing Sectors: Energy, materials, financials.
Why: Rising interest rates favor financials; inflation benefits commodity-linked sectors.
Contraction Stage: Economic growth slows or falls, unemployment rises.
Best Performing Sectors: Utilities, consumer staples, healthcare.
Why: These sectors provide essential goods and services, acting as defensive investments.
Recovery Stage: Economy begins to grow after a downturn.
Best Performing Sectors: Industrials, technology, cyclicals.
Why: Increased capital expenditure and demand for goods and services spur growth.
Example of Sector Rotation:
During the 2008-2009 financial crisis, capital moved from financials and cyclicals to defensive sectors like utilities and consumer staples. Post-crisis, recovery saw a rotation back to technology, industrials, and consumer discretionary sectors.
3.2 Style Rotation
Style rotation refers to the movement of capital between different investment styles, most commonly growth and value investing.
Growth vs. Value
Growth Stocks: Companies with high expected earnings growth, often tech or emerging sectors.
Value Stocks: Companies trading at lower valuations relative to earnings, assets, or dividends.
Drivers of Style Rotation
Interest Rate Changes: Rising interest rates generally favor value over growth stocks because growth stocks have high future earnings discounted more heavily.
Economic Conditions: Economic recovery may favor growth stocks; recession may favor value stocks with stable earnings.
Investor Sentiment: Risk-on sentiment favors growth; risk-off sentiment favors value.
Example:
In 2022, inflation and interest rate hikes triggered a style rotation from growth tech stocks to value sectors like energy, financials, and industrials.
3.3 Geographic Rotation
Geographic rotation involves the movement of capital between countries or regions. Investors shift funds based on macroeconomic conditions, currency strength, and geopolitical stability.
Key Considerations
Developed vs. Emerging Markets: During risk-on periods, capital often flows into emerging markets for higher returns. In risk-off periods, funds move to safer developed markets.
Currency Movements: Strong domestic currencies can attract foreign investment; weak currencies may discourage inflows.
Political and Economic Stability: Investors prefer regions with stable governance and economic policies.
Example:
During periods of global uncertainty, investors may rotate capital from emerging markets like Brazil or India to safer markets like the US or Germany.
3.4 Asset Class Rotation
Asset class rotation is the shifting of capital between equities, bonds, commodities, and cash equivalents.
Drivers of Asset Rotation
Interest Rate Changes: Rising rates make bonds less attractive and equities more attractive in certain sectors like financials.
Inflation: Commodities often outperform during high inflation.
Risk Appetite: During uncertainty, investors rotate from equities to bonds or gold as safe havens.
Example:
In 2020, during the COVID-19 crisis, investors rotated heavily into bonds and gold, while equities suffered. As markets recovered, capital rotated back into equities, particularly tech and healthcare.
3.5 Market Capitalization Rotation
Market capitalization rotation refers to capital moving between large-cap, mid-cap, and small-cap stocks based on risk appetite and economic conditions.
Characteristics
Small-Cap Stocks: Higher growth potential but higher risk; perform well during economic expansion.
Mid-Cap Stocks: Balanced risk and growth; often outperform during early recovery.
Large-Cap Stocks: Stable and defensive; preferred during market uncertainty or downturns.
Example:
During the 2020 recovery, small-cap and mid-cap indices in India and the US outperformed large-cap indices as investors sought higher growth potential.
4. Drivers of Market Rotations
Market rotations are driven by several macroeconomic, financial, and behavioral factors:
Economic Cycles: Each stage of the business cycle favors different sectors or investment styles.
Interest Rates: Central bank policies affect discount rates and equity valuations.
Inflation Trends: Inflation favors commodities and value stocks, while low inflation favors growth stocks.
Monetary and Fiscal Policy: Quantitative easing, stimulus packages, or tightening measures shift capital allocation.
Geopolitical Events: Wars, sanctions, and political instability trigger risk-on/risk-off rotations.
Market Sentiment and Psychology: Investor optimism or fear often leads to defensive or aggressive rotations.
5. Indicators to Track Market Rotations
Sector Performance Charts: Monitor relative strength of sectors against indices.
ETF Fund Flows: Money inflows/outflows indicate where capital is rotating.
Interest Rate Spreads and Yield Curves: Signal upcoming rotation between growth and value.
Commodities and Currency Movements: Rising commodity prices may trigger rotation into energy and materials sectors.
Market Breadth Indicators: Identify which sectors or asset classes are leading or lagging.
6. Popular Rotation Patterns
Cyclical → Defensive: Seen during economic slowdowns; investors move to utilities, consumer staples, healthcare.
Growth → Value: Triggered by rising interest rates or market uncertainty.
Large-Cap → Small/Mid-Cap: Risk-on environments favor smaller, high-growth companies.
Equities → Bonds/Gold: Risk-off periods push investors into safer assets.
Commodity-Led Rotation: Inflationary trends favor metals, energy, and materials.
7. Tools and Strategies for Tracking Rotations
Relative Strength Analysis: Compare sector ETFs or indices to identify outperformers.
ETF Investing: Easy way to rotate capital across sectors without picking individual stocks.
Quantitative and AI Models: Predict sector rotation using economic indicators.
Momentum and Trend Following: Rotate into sectors with strong price momentum.
Fund Flow Analysis: Monitor institutional and retail investor activity.
8. Historical Examples of Market Rotations
2008-2009 Financial Crisis: Defensive sectors like utilities and staples outperformed; cyclicals and financials lagged.
2020 COVID-19 Crisis: Rotation from equities to bonds and gold. Post-crisis recovery saw rotation back into tech, healthcare, and consumer discretionary.
2022 Inflation and Rate Hikes: Growth stocks underperformed, value sectors and commodities led the market.
9. Advanced Topics in Market Rotation
Cross-Asset Rotations: Understanding correlations between stocks, bonds, commodities, and currencies.
Intermarket Analysis: Using bond yields, equity indices, and commodity prices to anticipate rotation.
Quantitative Models and AI Predictions: Using data-driven methods to predict rotation trends.
Behavioral Finance Insights: How fear, greed, and sentiment drive rotations.
Global Macro Rotations: Monitoring central bank policies, geopolitical events, and trade developments.
10. Conclusion
Market rotation is an essential concept in trading and investing. By understanding its types, drivers, and patterns, investors can make informed decisions, optimize portfolios, and capitalize on trends.
Sector Rotation: Aligns investments with economic cycles.
Style Rotation: Adjusts between growth and value stocks.
Geographic Rotation: Shifts capital based on regional opportunities and risks.
Asset Class Rotation: Moves funds across stocks, bonds, commodities, and cash.
Market Capitalization Rotation: Optimizes risk-reward by moving across large, mid, and small-cap stocks.
Incorporating market rotation strategies into investment planning can significantly enhance returns while managing risk, making it a vital tool for traders, fund managers, and individual investors alike.

Stock Market Gains and Related Terms1. Types of Stock Market Gains
Stock market gains can be broadly classified into two types:
1.1 Capital Gains
Capital gains are the profits realized when an investor sells a stock at a higher price than the purchase price. They can be:
Short-Term Capital Gains (STCG): Gains from selling assets held for less than a year. Often taxed at a higher rate.
Long-Term Capital Gains (LTCG): Gains from selling assets held for more than a year. Usually taxed at a lower rate.
Example:
You buy 100 shares of a company at ₹500 each. After a year, the price rises to ₹700.
Capital gain = (700 – 500) × 100 = ₹20,000
1.2 Dividend Gains
Dividends are periodic payments made by companies to shareholders from their profits. Investors earn gains without selling shares. Dividends can be:
Cash Dividends: Direct cash paid to shareholders.
Stock Dividends: Additional shares given instead of cash.
Example:
You own 100 shares, and the company pays a ₹10 per share dividend: ₹10 × 100 = ₹1,000 gain.
1.3 Total Return
Total return combines capital gains and dividend gains, giving a holistic picture of the investor’s profit.
Formula:
Total Return = (Ending Value – Initial Investment + Dividends) / Initial Investment × 100%
2. Related Terms in Stock Market Gains
Understanding stock market gains involves several interrelated concepts:
2.1 Market Capitalization
Market capitalization (market cap) is the total market value of a company’s outstanding shares. It helps investors gauge the company’s size and potential for gains.
Formula:
Market Cap = Share Price × Number of Outstanding Shares
2.2 Earnings Per Share (EPS)
EPS is a measure of a company’s profitability, calculated as:
EPS = Net Income / Outstanding Shares
Higher EPS often leads to stock price appreciation, contributing to capital gains.
2.3 Price-to-Earnings Ratio (P/E Ratio)
The P/E ratio measures stock valuation relative to earnings:
P/E = Share Price / EPS
High P/E may indicate growth potential, influencing expected gains.
Low P/E may suggest undervaluation, signaling possible future gains.
2.4 Dividend Yield
The dividend yield measures the dividend relative to the share price:
Dividend Yield = Annual Dividend / Share Price × 100%
Indicates income component of stock market gains.
2.5 Volatility
Volatility represents the degree of price fluctuation in a stock. High volatility can mean higher potential gains but increased risk.
2.6 Liquidity
Liquidity is the ease with which a stock can be bought or sold without affecting its price. Higher liquidity ensures investors can realize gains quickly.
2.7 Risk and Return
There is a direct relationship between risk and expected return:
High-risk stocks → Potential for higher gains.
Low-risk stocks → Steady, smaller gains.
3. Market Factors Affecting Gains
Stock market gains are influenced by macroeconomic, microeconomic, and behavioral factors.
3.1 Economic Indicators
GDP growth
Inflation rate
Interest rates
3.2 Corporate Performance
Revenue and profit growth
Product launches and innovations
Management efficiency
3.3 Market Sentiment
Investor behavior, market trends, and news can drive short-term gains.
3.4 Global Factors
Geopolitical stability
Foreign investment flows
Currency fluctuations
4. Investment Strategies to Maximize Gains
Investors use various strategies to maximize gains:
4.1 Buy and Hold
Long-term investment to capture capital appreciation and dividends.
4.2 Swing Trading
Exploiting short- to medium-term price movements for gains.
4.3 Dividend Investing
Focusing on high dividend-paying stocks for consistent income.
4.4 Growth Investing
Investing in companies with high growth potential, expecting large capital gains.
4.5 Value Investing
Buying undervalued stocks to profit as their prices reflect intrinsic value over time.
5. Measuring Stock Market Gains
Investors track gains using several tools and metrics:
Portfolio Value Growth
Return on Investment (ROI)
Alpha and Beta (Risk-adjusted return)
Sharpe Ratio (Risk vs. Reward)
6. Tax Implications on Gains
Gains from stock market investments are subject to taxation:
Capital Gains Tax: Varies based on short-term vs. long-term holdings.
Dividend Tax: Taxed as per investor’s income bracket.
Wealth/Transaction Tax: Some countries impose additional charges.
Understanding taxes is critical for calculating net gains.
7. Psychological and Behavioral Factors
Investor behavior impacts the ability to realize gains:
Greed vs. Fear: Can lead to impulsive decisions, affecting gains.
Overtrading: Frequent buying and selling may reduce overall gains.
Herd Mentality: Following market trends without analysis can impact profits.
8. Advanced Concepts Related to Gains
8.1 Compound Gains
Reinvesting gains to generate exponential growth over time.
8.2 Leverage
Using borrowed capital to increase potential gains (but also risk).
8.3 Hedging
Strategies to protect gains against market downturns using derivatives like options and futures.
8.4 Diversification
Spreading investments across sectors and asset classes to stabilize gains.
9. Case Study Example
Investor A:
Buys 200 shares of XYZ Ltd. at ₹100.
Receives ₹5 per share dividend annually.
Stock price rises to ₹150 in 2 years.
Calculation:
Capital Gain = (150 – 100) × 200 = ₹10,000
Dividend Gain = 5 × 200 × 2 = ₹2,000
Total Gain = ₹12,000
This illustrates how both capital appreciation and dividends contribute to overall stock market gains.
10. Conclusion
Stock market gains are not merely about stock price increases. They encompass dividends, reinvestment, risk-adjusted returns, and strategic decision-making. Related terms like capital gains, dividends, EPS, P/E ratio, volatility, and portfolio management are all critical to understanding the nuances of gains. Effective investing requires a combination of financial literacy, market knowledge, and psychological discipline.

AI & Machine Learning Models in Market Prediction1. Overview of AI and Machine Learning in Finance
1.1 Artificial Intelligence in Finance
AI refers to computer systems designed to perform tasks that normally require human intelligence. In finance, AI can perform tasks like risk assessment, fraud detection, sentiment analysis, and predictive modeling. Its ability to simulate human-like decision-making is particularly valuable in trading, where speed, accuracy, and adaptability are crucial.
1.2 Machine Learning as a Subset of AI
Machine Learning is a subset of AI that focuses on algorithms that learn from data. Unlike traditional statistical methods, ML models improve their predictive accuracy as they are exposed to more data. ML can be categorized into:
Supervised Learning: The model learns from labeled historical data to predict future outcomes (e.g., stock prices).
Unsupervised Learning: The model identifies hidden patterns in unlabeled data (e.g., market clustering, anomaly detection).
Reinforcement Learning: The model learns by trial and error to maximize rewards, often used in algorithmic trading.
2. Types of Machine Learning Models Used in Market Prediction
2.1 Regression Models
Regression analysis predicts continuous outcomes, such as stock prices, interest rates, or commodity values. Common models include:
Linear Regression: Models the relationship between a dependent variable and one or more independent variables.
Ridge and Lasso Regression: Improve linear regression by adding regularization to prevent overfitting.
Polynomial Regression: Captures non-linear relationships in market data.
2.2 Classification Models
Classification models are used when outcomes are categorical, such as predicting whether a stock will go up or down. Examples include:
Logistic Regression
Support Vector Machines (SVM)
Random Forests
Gradient Boosting Machines
2.3 Time Series Models
Financial data is inherently sequential. Time series models exploit temporal dependencies to forecast future trends:
ARIMA (Auto-Regressive Integrated Moving Average)
SARIMA (Seasonal ARIMA)
Prophet (by Facebook)
LSTM (Long Short-Term Memory networks): A type of neural network ideal for capturing long-term dependencies in sequential data.
2.4 Deep Learning Models
Deep learning involves multi-layer neural networks capable of modeling complex, non-linear relationships in market data:
Convolutional Neural Networks (CNNs): Typically used for image recognition but applied to visualized market data like candlestick charts.
Recurrent Neural Networks (RNNs): Designed for sequential data, with LSTM and GRU as advanced versions.
Transformers: Advanced models that handle large datasets and multiple features, increasingly used in financial forecasting.
2.5 Reinforcement Learning
Reinforcement Learning (RL) models are particularly popular in algorithmic trading. In RL:
The agent (trading algorithm) interacts with an environment (market).
It receives feedback (reward or penalty) based on its actions.
Over time, it learns strategies to maximize cumulative rewards.
Applications include high-frequency trading, portfolio optimization, and dynamic hedging strategies.
3. Data Sources for AI Market Prediction
AI models require large and diverse datasets. Key sources include:
Historical Market Data: Prices, volumes, and volatility indices.
Economic Indicators: GDP, inflation, employment rates.
Company Fundamentals: Financial statements, earnings reports, and debt levels.
Alternative Data: Social media sentiment, news articles, Google Trends, satellite imagery.
High-Frequency Data: Tick-by-tick data used in HFT algorithms.
Data quality is critical: noisy, incomplete, or biased data can significantly reduce model accuracy.
4. Features and Variables in Market Prediction
Feature engineering transforms raw data into meaningful input variables. Common features include:
Technical Indicators: Moving averages, RSI, MACD, Bollinger Bands.
Sentiment Scores: Derived from social media or news sentiment analysis.
Macroeconomic Variables: Interest rates, commodity prices, geopolitical events.
Market Microstructure: Order book depth, bid-ask spreads, and trade volume.
Feature selection helps reduce dimensionality, improve computation efficiency, and avoid overfitting.
5. Advantages of AI and ML in Market Prediction
Speed and Efficiency: Can analyze millions of data points in seconds.
Pattern Recognition: Detects complex non-linear patterns invisible to human analysts.
Adaptability: Models can adjust to new market conditions.
Risk Management: Improves predictive accuracy, helping mitigate losses.
Automation: Enables algorithmic trading and continuous market monitoring.
6. Challenges and Limitations
Data Quality and Availability: Poor or biased data reduces model effectiveness.
Overfitting: Models may perform well on historical data but fail in real-time markets.
Market Unpredictability: Black swan events and irrational market behavior are difficult to model.
Interpretability: Complex models like deep neural networks are often “black boxes.”
Regulatory Compliance: Financial regulations may restrict the use of certain AI models.
7. Case Studies and Applications
7.1 Stock Price Prediction
Companies use LSTM networks and hybrid models combining technical indicators and sentiment analysis to forecast stock movements. Some hedge funds leverage AI for short-term price predictions.
7.2 Algorithmic and High-Frequency Trading
AI-driven HFT systems execute thousands of trades per second using reinforcement learning and predictive analytics to exploit market inefficiencies.
7.3 Portfolio Optimization
AI models can rebalance portfolios dynamically, considering risk, expected returns, and correlations between assets, often outperforming traditional mean-variance optimization.
7.4 Risk Assessment and Fraud Detection
Machine learning models assess credit risk, detect unusual trading patterns, and flag potential fraud in real-time.
8. Future Trends
Explainable AI (XAI): Increasing demand for transparent models that can explain decisions to regulators and investors.
Integration with Alternative Data: Enhanced predictive power through social media, news sentiment, and satellite imagery.
Quantum Computing: Potential to accelerate complex computations and improve prediction accuracy.
AI-Driven Macroeconomic Forecasting: Integration of global economic, political, and environmental data for holistic market prediction.
Conclusion
AI and Machine Learning have transformed financial market prediction, offering unprecedented speed, accuracy, and adaptability. By leveraging historical and real-time data, these technologies can identify complex patterns, optimize trading strategies, and improve risk management. However, challenges such as data quality, overfitting, interpretability, and market unpredictability remain.
As AI continues to evolve, combining explainable models, alternative data, and advanced computational techniques will redefine the future of market analysis, making financial decision-making more informed and strategic.

Nifty - Weekly Analysis Sep 22 - Sep 26The price is moving within a channel and is testing an important support level at 25350. It can give good movement by sustaining above 25350.
Buy above 25350 with the stop loss of 25290 for the targets 25400, 25460, 25500, 25560, 25620, 25680, and 25740.
Sell below 25240 with the stop loss of 25280 for the targets 25200, 25160, 25100, 25040, 25000, 24960, and 24920.
As per the hour chart, 25300 is a strong support. Any strength around this level can make the price to move towards 25800.
Always do your analysis before taking any trade.

Part 2 Master Candlestick Pattern1. Liquidity Risk – When You Can’t Exit
Some options, especially far out-of-the-money strikes or illiquid stocks, don’t have enough buyers and sellers. This creates wide bid-ask spreads.
You may be forced to buy at a higher price and sell at a lower price.
In extreme cases, you might not find a counterparty to exit at all.
👉 Example:
Suppose you buy an illiquid stock option at ₹10. The bid is ₹8, and the ask is ₹12. If you want to sell, you may only get ₹8 — losing 20% instantly.
Lesson: Stick to liquid contracts with high open interest and trading volume.
2. Assignment Risk – The Surprise Factor
If you sell (write) options, you carry assignment risk. That means the buyer can exercise the option at any time (in American-style options).
A short call may be assigned if the stock rises sharply.
A short put may be assigned if the stock falls heavily.
👉 Example:
If you sell a put option of Infosys at ₹1,500 strike, and the stock crashes to ₹1,400, you may be forced to buy shares at ₹1,500 — incurring a huge loss.
Lesson: Always be prepared for early exercise if you are a seller.
3. Gap Risk – Overnight Shocks
Markets don’t always move smoothly. They can gap up or down overnight due to global events, earnings, or news. This is gap risk.
If you are holding positions overnight, you cannot control what happens after market close.
Protective stop-losses don’t work in gap openings because the market opens directly at a higher or lower level.
👉 Example:
You sell a call option on a stock at ₹500 strike. Overnight, the company announces stellar results, and the stock opens at ₹550. Your stop-loss at ₹510 is useless — you are already deep in loss.
Lesson: Overnight positions carry additional dangers.
4. Interest Rate and Dividend Risk
Option pricing models also factor in interest rates and dividends.
Rising interest rates generally increase call premiums and reduce put premiums.
Dividends reduce call prices and increase put prices because the stock is expected to fall on ex-dividend date.
For index options or long-dated stock options, ignoring this can lead to mispricing.
5. Psychological Risk – The Human Weakness
Not all risks come from markets. Many come from the trader’s own mind.
Greed: Holding on for bigger profits and losing it all.
Fear: Exiting too early or avoiding trades.
Overtrading: Trying to chase every move.
Revenge trading: Doubling down after a loss.
👉 Example:
A trader makes a profit of ₹20,000 in a day but refuses to book gains, hoping for ₹50,000. By market close, the profit vanishes and turns into a ₹10,000 loss.
Lesson: Emotional discipline is as important as technical knowledge.
6. Systemic & Black Swan Risks
Finally, there are risks no model can predict — sudden wars, pandemics, financial crises, regulatory bans, or exchange outages. These are systemic or Black Swan risks.
👉 Example:
In March 2020 (Covid crash), markets fell 30% in weeks. Option premiums shot up wildly, and many traders were wiped out.
Lesson: Always respect uncertainty. No system is foolproof.

Part 1 Master Candlestick PatternIntroduction
Options trading has always attracted traders and investors because of its flexibility, leverage, and the ability to profit in both rising and falling markets. Unlike simple stock buying, where you purchase shares and wait for them to rise, options allow you to speculate, hedge, or even create income-generating strategies. But this flexibility comes at a cost: risk.
In fact, while options provide opportunities for huge rewards, they also carry risks that can wipe out capital quickly if not managed properly. Many new traders get lured by the promise of quick profits and ignore the hidden dangers. The truth is, every option trade is a balance between potential gain and potential loss — and understanding the nature of these risks is the first step to trading responsibly.
In this guide, we’ll explore all major types of risk in options trading — from market risk and time decay to volatility traps, liquidity issues, and even psychological mistakes.
1. Market Risk – The Most Obvious Enemy
Market risk is the possibility of losing money due to unfavorable price movements in the underlying asset. Since options derive their value from stocks, indices, currencies, or commodities, any sharp move against your position can create losses.
For call buyers: If the stock fails to rise above the strike price plus premium, you lose money.
For put buyers: If the stock doesn’t fall below the strike price minus premium, the option expires worthless.
For sellers (writers): The risk is even greater. A short call can lead to unlimited losses if the stock keeps rising, and a short put can cause heavy losses if the stock collapses.
👉 Example:
Suppose you buy a call option on Reliance Industries with a strike price of ₹3,000 at a premium of ₹50. If the stock stays around ₹2,950 at expiry, your entire premium (₹50 per share) is lost. Conversely, if you had sold that same call, and the stock shot up to ₹3,300, you’d lose ₹250 per share — far more than the premium you collected.
Lesson: Market risk is unavoidable. Every trade needs a pre-defined exit plan.
2. Leverage Risk – The Double-Edged Sword
Options provide huge leverage. You control a large notional value of stock by paying a small premium. But this magnifies both profits and losses.
A 5% move in the stock could mean a 50% change in the option’s premium.
A trader who overuses leverage can blow up their capital in just a few trades.
👉 Example:
With just ₹10,000, you buy out-of-the-money (OTM) Bank Nifty weekly options. If the market moves in your favor, you might double your money in a day. But if it goes the other way, you could lose everything — and very fast.
Lesson: Leverage is powerful, but without discipline, it’s deadly.
3. Time Decay Risk – The Silent Killer (Theta Risk)
Options are wasting assets. Every day that passes reduces their time value, especially as expiry nears. This is called Theta decay.
Option buyers suffer from time decay. Even if the stock doesn’t move, the option premium keeps falling.
Option sellers benefit from time decay, but only if the market stays within their expected range.
👉 Example:
You buy an at-the-money (ATM) Nifty option one week before expiry at ₹100. Even if Nifty stays flat, that option could drop to ₹40 by expiry simply because of time decay.
Lesson: If you are an option buyer, timing is everything. If you are a seller, time decay works in your favor, but risk still exists from sudden moves.
4. Volatility Risk – The Invisible Factor (Vega Risk)
Volatility is the heartbeat of options pricing. Higher volatility means higher premiums because there’s a greater chance of large price moves. But this creates Vega risk.
If you buy options during high volatility (like before elections, results, or big events), you may pay inflated premiums. Once the event passes and volatility drops, the option’s value can collapse, even if the stock moves as expected.
Sellers face the opposite problem. Selling options in low volatility periods is dangerous because any sudden jump in volatility can cause premiums to spike, leading to losses.
👉 Example:
Before Union Budget announcements, Nifty options trade at very high premiums. If you buy expecting a big move, but the budget turns out uneventful, volatility drops sharply, and the option loses value instantly.
Lesson: Never ignore implied volatility (IV) before entering an option trade.

Option Trading1. Real-World Opportunities
1.1. Equities and Index Options
Profitable in bullish, bearish, or sideways markets.
Examples: Nifty, Bank Nifty, Sensex options in India; S&P 500, Nasdaq options globally.
1.2. Commodity Options
Crude oil, gold, and agricultural commodities offer opportunities based on seasonality, geopolitical events, and supply-demand dynamics.
Traders can use options to hedge inventory or speculate on price movements.
1.3. Currency Options
Companies and investors hedge foreign exchange exposure using currency options.
Traders speculate on currency pairs like USD/INR, EUR/USD with directional or volatility-based strategies.
1.4. Volatility Trading
Options on volatility indices (like India VIX or CBOE VIX) provide opportunities to trade market sentiment rather than price.
2. Emerging Opportunities in Options Markets
Algorithmic Options Trading: Using AI and machine learning to exploit inefficiencies and price anomalies.
Synthetic Positions: Combining options to mimic stock positions at lower capital.
Weekly and Short-Term Options: Increasingly popular for nimble traders seeking frequent opportunities.
Cross-Asset Strategies: Trading options across equities, commodities, and currencies for diversified opportunities.
3. Practical Tips for Maximizing Opportunities
Educate Continuously: Understanding greeks (Delta, Gamma, Theta, Vega) is crucial.
Start Small: Begin with defined-risk trades before exploring complex strategies.
Focus on Liquidity: Trade options with high open interest to avoid slippage.
Monitor Volatility: Use IV percentile and historical volatility comparisons to identify opportunities.
Event-Based Trading: Plan trades around earnings, FOMC meetings, or geopolitical events for maximum edge.
Options trading presents endless opportunities for traders who approach the market with knowledge, strategy, and discipline. From generating income, hedging risk, or speculating on directional and volatility moves, options provide a flexible, capital-efficient, and strategic way to participate in financial markets.
Successful trading relies on:
Understanding the fundamentals of options.
Applying strategies aligned with market conditions.
Maintaining disciplined risk management.
Continuously adapting to evolving markets.
For both individual investors and professional traders, options are not just tools—they are pathways to sophisticated financial strategies that can enhance returns, manage risk, and exploit market opportunities.

PCR Trading Strategies1. Strategic Approaches to Options Trading
Options strategies can be simple or complex, depending on the trader’s risk tolerance, market outlook, and capital. These strategies are categorized into basic, intermediate, and advanced levels.
1.1. Basic Strategies
Buying Calls and Puts: Simple directional trades.
Protective Puts: Hedging against portfolio declines.
Covered Calls: Generating income from existing holdings.
1.2. Intermediate Strategies
Spreads: Simultaneous buying and selling of options to limit risk and reward.
Vertical Spread: Buying and selling options of the same type with different strike prices.
Horizontal/Calendar Spread: Exploiting differences in time decay by using options of the same strike but different expiration dates.
Diagonal Spread: Combining vertical and horizontal spreads for strategic positioning.
Collars: Combining protective puts and covered calls to limit both upside and downside.
1.3. Advanced Strategies
Iron Condor: Selling an out-of-the-money call and put while buying further OTM options to limit risk, profiting from low volatility.
Butterfly Spread: Exploiting low volatility by using three strike prices to maximize gains near the middle strike.
Ratio Spreads and Backspreads: Advanced plays to profit from skewed market expectations or strong directional moves.
2. Identifying Option Trading Opportunities
Successful options trading requires analyzing market conditions, volatility, and liquidity. Key factors include:
2.1. Market Direction and Momentum
Use technical indicators (moving averages, RSI, MACD) to gauge trends.
Trade options in alignment with market momentum for directional strategies.
2.2. Volatility Analysis
Historical Volatility (HV): Measures past price fluctuations.
Implied Volatility (IV): Market’s expectation of future volatility.
Opportunities arise when IV is underpriced (buy options) or overpriced (sell options).
2.3. Earnings and Event Plays
Companies’ earnings announcements, product launches, or macroeconomic events create volatility spikes.
Strategies like straddles or strangles are ideal to capitalize on such events.
2.4. Liquidity and Open Interest
Highly liquid options ensure tight spreads and efficient entry/exit.
Monitoring open interest helps identify support/resistance levels and market sentiment.
3. Risk Management in Options Trading
While options offer significant opportunities, risk management is crucial:
Position Sizing: Limit exposure to a small percentage of capital.
Defined-Risk Strategies: Use spreads and collars to control maximum loss.
Stop-Loss Orders: Protect against rapid adverse movements.
Diversification: Trade multiple assets or strategies to reduce concentration risk.
Implied Volatility Awareness: Avoid buying expensive options during volatility spikes unless justified by market events.

Divergence Secrets1. Understanding Options: The Foundation
Options are derivative instruments that derive their value from an underlying asset, such as stocks, indices, commodities, or currencies. They grant the buyer the right—but not the obligation—to buy or sell the underlying asset at a predetermined price within a specified period. There are two primary types of options:
Call Option: Provides the right to buy the underlying asset at a specified price (strike price) before or at expiration.
Put Option: Provides the right to sell the underlying asset at a specified price before or at expiration.
Key Terms:
Strike Price: The price at which the underlying asset can be bought or sold.
Expiration Date: The date on which the option contract expires.
Premium: The cost paid by the buyer to acquire the option.
In-the-Money (ITM): When exercising the option is profitable.
Out-of-the-Money (OTM): When exercising the option is not profitable.
Options provide leverage, enabling traders to control large positions with a relatively small capital outlay, creating unique opportunities for profit in both bullish and bearish markets.
2. Market Opportunities in Options Trading
Options trading opportunities are vast, ranging from directional plays to hedging strategies. The unique characteristics of options allow market participants to exploit price volatility, market inefficiencies, and changing investor sentiment.
2.1. Directional Opportunities
Traders can use options to profit from price movements in underlying assets:
Bullish Outlook: Buying call options allows traders to benefit from rising stock prices with limited risk.
Bearish Outlook: Buying put options provides an opportunity to profit from falling prices without short-selling.
Example: If a stock trading at ₹1,500 is expected to rise to ₹1,650 in two months, a trader could buy a call option with a strike price of ₹1,520. The profit potential is theoretically unlimited, while the maximum loss is limited to the premium paid.
2.2. Hedging Opportunities
Options provide risk mitigation for portfolios, protecting against adverse price movements:
Protective Puts: Investors holding stocks can buy put options to hedge against potential declines.
Covered Calls: Investors owning shares can sell call options to generate income, reducing portfolio volatility.
Example: An investor holding 100 shares of a stock priced at ₹2,000 may buy a put option at a ₹1,950 strike price. If the stock falls to ₹1,800, losses in the stock are offset by gains in the put option.
2.3. Income Generation
Options can be used to generate consistent income through premium collection:
Cash-Secured Puts: Selling put options on stocks an investor wants to acquire can generate premium income.
Covered Call Writing: Selling call options on held stock can earn income while potentially selling the stock at a target price.
2.4. Volatility-Based Opportunities
Options prices are highly sensitive to implied volatility, creating opportunities even when the market direction is uncertain:
Long Straddles: Buying both call and put options at the same strike price allows traders to profit from significant price swings, irrespective of direction.
Long Strangles: Similar to straddles but with different strike prices, strangles are cost-effective strategies for volatile markets.

Part 2 Support and Resistance1. How Option Pricing Works
Option pricing is determined primarily by two components:
1.1 Intrinsic Value
The intrinsic value of an option is the difference between the current market price of the underlying asset and the option’s strike price:
For a call option: Intrinsic Value = Max(0, Current Price – Strike Price)
For a put option: Intrinsic Value = Max(0, Strike Price – Current Price)
1.2 Time Value
The time value accounts for the possibility that the option’s price may increase before expiration. Factors influencing time value include:
Time to Expiry: Longer durations increase the likelihood of profitable movement.
Volatility: Higher volatility increases the potential for price swings, making options more expensive.
Interest Rates and Dividends: These factors can adjust the expected returns of the underlying asset and, consequently, the option premium.
1.3 The Black-Scholes Model
The Black-Scholes model is a widely used formula for estimating theoretical option prices. It considers factors like:
Current stock price
Strike price
Time to expiration
Volatility
Risk-free interest rate
This model forms the foundation of modern option pricing, though practical trading often considers market sentiment and liquidity as well.
2. Types of Option Styles
Options come in several styles, each dictating when the option can be exercised:
American Options: Can be exercised any time before expiration.
European Options: Can only be exercised on the expiration date.
Exotic Options: Include complex derivatives such as barrier options, Asian options, and lookback options, often used by institutional investors.
3. Uses of Options
Option trading serves multiple purposes in financial markets:
3.1 Hedging
Investors use options to protect their portfolios from adverse price movements:
Protective Put: Buying a put option to insure a long stock position.
Covered Call: Selling a call option on a stock already owned to earn additional premium income.
3.2 Speculation
Traders can use options to profit from anticipated price movements without owning the underlying asset:
Buying call options for bullish expectations.
Buying put options for bearish expectations.
Using leverage, a small investment can yield substantial returns if predictions are correct.
3.3 Income Generation
Selling options allows traders to collect premiums regularly:
Cash-Secured Puts: Selling put options while holding enough cash to buy the underlying asset if exercised.
Covered Calls: Generates income by selling calls against owned stock.
3.4 Arbitrage
Institutional traders use options to exploit price discrepancies between markets, combining options and underlying assets for risk-free profits.

Part 1 Support and Resistance1. Introduction to Option Trading
Option trading is a sophisticated financial instrument used widely in modern markets for hedging, speculation, and portfolio management. Options are derivatives, meaning their value is derived from an underlying asset, such as stocks, indices, commodities, or currencies. Unlike buying or selling the underlying asset directly, options give traders the right—but not the obligation—to buy or sell the asset at a predetermined price within a specific timeframe.
The global options market has grown exponentially, as institutional investors, retail traders, and hedge funds recognize the flexibility, leverage, and risk-management capabilities of options. They are integral to strategies ranging from simple protective hedging to complex arbitrage trades.
1.1 What Is an Option?
An option is a contract that grants its holder certain rights:
Call Option: The right to buy the underlying asset at a specific price (strike price) before or on a specified expiry date.
Put Option: The right to sell the underlying asset at a specific price before or on a specified expiry date.
Unlike futures or forwards, which carry obligations, options give the holder flexibility, making them versatile tools for both risk mitigation and speculative opportunities.
2. Key Terminology in Option Trading
Understanding option trading requires familiarity with certain fundamental terms:
Strike Price: The predetermined price at which the underlying asset can be bought (call) or sold (put).
Premium: The price paid to buy the option. This is influenced by time value, intrinsic value, volatility, and market conditions.
Expiry Date: The date on which the option contract expires and becomes void.
In-the-Money (ITM): An option with intrinsic value (e.g., a call option with a strike price below the current market price).
Out-of-the-Money (OTM): An option with no intrinsic value (e.g., a call option with a strike price above the current market price).
At-the-Money (ATM): An option where the strike price equals the current market price.
Underlying Asset: The financial instrument (stock, index, commodity, or currency) on which the option is based.
Volatility: A measure of the asset's price fluctuations, which directly impacts option pricing.

The Language of Charts: How Price Action GuidesHello fellow traders! Wishing you happy trading, may the charts guide you well. Today, we’ll discuss price action and how it helps us in our routine trading, And very Grateful to TradingView for providing such powerful charts that make understanding price action simpler
Introduction--::
In the trading world, price is the ultimate truth. While many traders rely on moving averages, oscillators, and other indicators, seasoned professionals often focus on something simpler yet more powerful: price action.
Price action is the study of how price moves on a chart—through candles, patterns, and levels. It reflects the ongoing battle between buyers and sellers, revealing the sentiment of the market in real time.
Unlike indicators, which are often lagging, price action is immediate, showing what’s happening now. By learning to read it, traders gain a clear picture of market psychology, trends, and potential reversals.
1. What is Price Action?
Price action trading is the art of making trading decisions based solely on the price chart, without relying heavily on external tools. Every candle, every bar, every level tells a story.
Key idea: Price action is the reflection of supply and demand.
When buyers dominate---price rises.
When sellers dominate---price falls.
When buyers and sellers balance---price consolidates.
A skilled trader can “read” these shifts and decide when to enter or exit trades.
2. Core Elements of Price Action
🔼Market Structure
Uptrend: Higher highs, higher lows.
Downtrend: Lower highs, lower lows.
Range/Consolidation: Price moves sideways between support and resistance.
Example: On a daily NIFTY chart, repeated higher highs indicate a bullish trend.
🔼Support & Resistance Levels
Support = price levels where buying pressure appears.
Resistance = price levels where selling pressure appears.
Tip: Look for areas where price has reacted multiple times.
🔼Candlestick Patterns
Pin Bar / Hammer / Shooting Star: Reversal signals.
Engulfing Candles: Momentum shift between buyers and sellers.
Doji: Indecision in the market, often preceding a reversal.
🔼Supply & Demand Zones
Supply zone = excess selling; price likely to fall.
Demand zone = excess buying; price likely to rise.
Example: A BTC chart showing a strong rejection from a previous demand zone.
3. Popular Price Action Patterns
Pin Bar Rejection: Shows price rejection from a key level.
Engulfing Candles: Bullish or bearish, indicate strong reversals.
Breakouts and Retests: Price breaks a level, retraces, then continues the trend.
Chart Patterns: Head & Shoulders, Triangles, Flags, Pennants.
4. How Traders Use Price Action
🔼Identifying Entries and Exits
Enter near support in an uptrend after bullish candle confirmation.
Exit near resistance or after a reversal candle forms.
🔼Stop-Loss and Risk Management
Place stop-loss just beyond the invalidation point (e.g., below pin bar tail).
🔼Trend Following
Join the trend only after a clear price action signal.
🔼Volume Confirmation
Higher volume on breakout/reversal signals strengthens the validity.
5. Advantages of Price Action Trading
Simplicity: No cluttered indicators.
Flexibility: Works on any market or timeframe.
Clarity: Shows real-time market psychology.
Versatility: Applicable to intraday trading, swing trading, or investing.
6. Limitations & Common Mistakes
Subjectivity: Interpretation can differ between traders.
Overtrading: Seeing patterns everywhere can lead to losses.
Requires Discipline: Consistency and patience are key.
Practice Needed: Cannot learn overnight; requires chart study.
7. Real-World Example
Imagine NIFTY is trending upward. It touches a prior resistance zone but forms a bullish engulfing candle at a support level. A price action trader sees this as:
Buyers are strong.
Trend likely to continue.
Entry near support, stop-loss just below candle tail, target near next resistance.
This decision is based purely on price movement, no indicators required.
Conclusion
Price action is the language of the market. Every candle, pattern, and level tells a story about what traders are thinking and doing. By learning to read it, you can trade with confidence, clarity, and simplicity.
Remember: Indicators lag, but price is always present. If you master price action, you master the market’s story itself.
Best Regards- Amit
Leveraged & Margin Trading1. Understanding Margin and Leverage
1.1. Margin Trading
Margin trading is a practice where traders borrow funds from a broker to trade financial instruments beyond the capital they own. Essentially, the trader puts up a portion of the trade’s value as a “margin,” while the broker provides the remainder.
Initial Margin: The amount a trader must deposit to open a position.
Maintenance Margin: The minimum account balance required to keep the position open. Falling below this can trigger a margin call.
Example:
If an investor wants to buy $10,000 worth of stock but only has $2,000, they can borrow the remaining $8,000 from the broker. Here, $2,000 is the initial margin.
2. How Margin Trading Works
2.1. Opening a Margin Account
Margin trading requires a margin account with a brokerage. Unlike a standard cash account:
Brokers assess creditworthiness and risk tolerance.
Regulatory bodies often impose minimum equity requirements.
Margin accounts allow borrowing for long and short positions.
2.2. Margin Call and Liquidation
A margin call occurs when the trader’s equity falls below the maintenance margin. Brokers demand additional funds or liquidate positions to cover losses.
Example:
Initial equity: $5,000
Maintenance margin: 25%
Position value drops, equity falls below $1,250 → margin call issued.
2.3. Interest and Costs
Borrowing funds incurs interest. Traders must account for:
Daily or monthly interest rates on borrowed funds.
Fees for overnight or extended positions.
Potential hidden costs in leveraged ETFs or derivatives.
3. Types of Leverage and Margin Instruments
3.1. Equity Margin Trading
Allows buying more shares than one can afford.
Popular in stock markets like the NYSE, NSE, and NASDAQ.
Often subject to regulatory limits, e.g., max 2x leverage for retail investors.
3.2. Forex Leverage
Forex brokers often provide high leverage (50:1 to 500:1) due to low volatility per pip.
Extremely high risk due to rapid market movements.
Margin is expressed as a percentage (e.g., 2% margin = 50x leverage).
3.3. Derivatives and Futures
Futures contracts inherently involve leverage.
Traders only deposit a fraction of the contract value as margin.
Profit/loss calculated daily (“mark-to-market”).
3.4. CFD (Contract for Difference) Trading
CFDs let traders speculate on asset price movements without owning the asset.
Leverage is widely used, amplifying gains and losses.
4. Benefits of Leveraged & Margin Trading
Amplified Returns: Small price movements can generate substantial profits.
Capital Efficiency: Traders can deploy limited capital across multiple positions.
Hedging Opportunities: Use leverage to hedge existing portfolios.
Short-Selling: Margin accounts enable profiting from falling markets.
Access to Advanced Markets: Leverage allows participation in markets with high nominal value (commodities, derivatives).
5. Risks and Challenges
5.1. Magnified Losses
Leverage increases exposure to adverse price movements.
Small losses can quickly exceed initial capital, leading to debt.
5.2. Margin Calls and Forced Liquidation
Margin calls can trigger automatic liquidation at unfavorable prices.
Timing and liquidity are critical to avoid catastrophic losses.
5.3. Interest and Fees
Borrowing costs reduce net gains.
Long-term leveraged positions can become expensive.
5.4. Psychological Pressure
High leverage induces stress, emotional trading, and overconfidence.
Traders may exit positions prematurely or double down recklessly.
6. Strategies in Leveraged & Margin Trading
6.1. Trend Following
Use leverage to maximize profits in strong trending markets.
Combine technical analysis, moving averages, and momentum indicators.
6.2. Scalping and Intraday Trading
Small positions with tight stop-losses reduce exposure.
High-frequency trades magnified through margin can yield substantial intraday gains.
6.3. Hedging and Portfolio Protection
Leveraged instruments hedge existing investments.
Options and futures contracts allow downside protection.
6.4. Swing Trading
Capture medium-term price swings.
Leverage allows traders to scale positions while maintaining capital efficiency.
7. Risk Management in Leveraged Trading
7.1. Setting Stop-Loss Orders
Essential to limit downside.
Automated stop-losses prevent emotional decision-making.
7.2. Position Sizing
Calculate leverage based on volatility and account size.
Avoid risking more than a small percentage of total capital per trade.
7.3. Diversification
Spread exposure across multiple assets.
Reduces risk of catastrophic losses from a single position.
7.4. Monitoring Margin Levels
Keep track of maintenance margin requirements.
Avoid last-minute margin calls by maintaining buffer equity.
8. Regulatory and Ethical Considerations
Regulators impose limits on retail leverage to protect investors.
Brokers must disclose risks clearly.
Leveraged trading carries ethical responsibility—reckless use can lead to systemic market instability.
9. Practical Examples
9.1. Stock Margin Trade
Buy 500 shares at $50 each = $25,000
Own capital: $5,000
Borrowed: $20,000 (5:1 leverage)
Scenario A: Price rises 10% → $27,500 value
Profit = $2,500 → 50% return on own capital
Scenario B: Price falls 10% → $22,500 value
Loss = $2,500 → 50% loss on own capital, risk of margin call
9.2. Forex Leverage
EUR/USD position: $100,000
Own capital: $2,000 → 50:1 leverage
100 pips movement → profit/loss = $1,000 (50% of equity)
9.3. Futures Contracts
Oil futures: 1 contract = 1,000 barrels, $80/barrel → $80,000
Margin: 10% → $8,000 deposit
Price increase to $85 → $5,000 profit → 62.5% return on margin
10. Psychological Aspects
Leverage magnifies emotions: greed, fear, and overconfidence.
Discipline is crucial—traders must stick to pre-defined risk strategies.
Education and simulation trading can build confidence before risking real capital.
11. Leveraged ETFs
Exchange-Traded Funds designed to multiply returns of an underlying index.
Examples: 2x or 3x daily returns of S&P 500.
Ideal for short-term strategies; long-term holding can lead to compounding decay.
12. Leveraged Trading in Crypto Markets
Cryptocurrency exchanges offer extreme leverage (up to 100x).
High volatility makes margin calls frequent.
Traders must combine technical analysis, position sizing, and stop-losses rigorously.
13. Common Misconceptions
Leverage guarantees profit: False—losses are amplified too.
Higher leverage = better returns: False—risk management is more important than high leverage.
Margin trading is only for experts: False—but education is crucial.
14. Best Practices
Always calculate maximum potential loss before opening positions.
Use leverage conservatively, especially in volatile markets.
Diversify trades across assets and strategies.
Keep an emergency equity buffer to avoid forced liquidation.
Continuously review and adjust risk exposure.
15. Conclusion
Leveraged and margin trading are potent tools in modern financial markets. They provide opportunities to magnify returns, access sophisticated trading strategies, and enhance portfolio efficiency. However, they come with inherent risks: magnified losses, margin calls, psychological stress, and the potential for total capital erosion.
Success in leveraged trading depends on education, risk management, discipline, and strategic execution. Understanding the mechanics of margin accounts, leverage ratios, and market dynamics is essential. When used prudently, leverage can be a powerful ally; when mismanaged, it can become a trader’s downfall.
In essence, leveraged and margin trading are not merely about borrowing money—they are about amplifying strategic thinking, market insights, and disciplined execution. Traders who respect both the power and the peril of leverage are often those who succeed in the long run.
