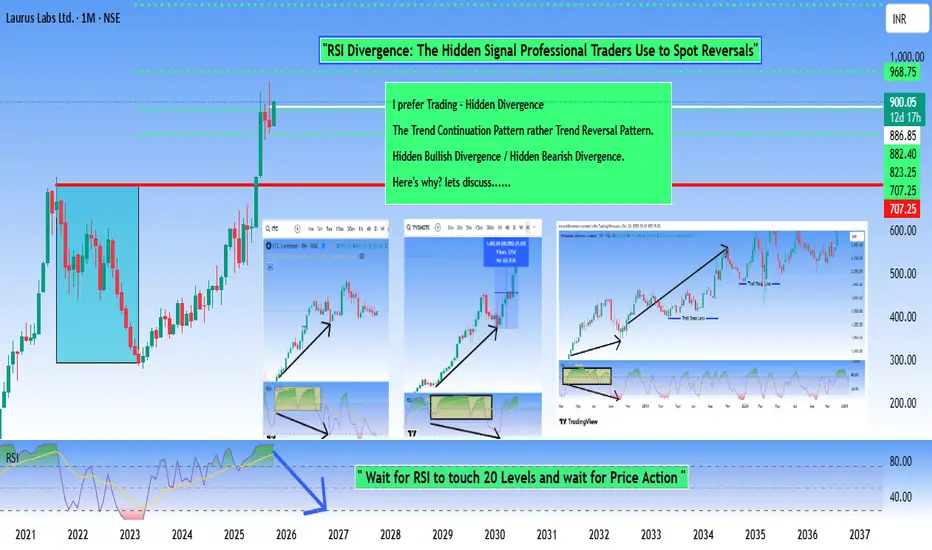
Hidden Signal Professional Traders Use to Spot ReversalsRSI divergence is a technical analysis tool used to identify potential reversals or weakening momentum in price trends.
Here's how it works:
RSI (Relative Strength Index) Divergence occurs when the price of an asset moves in one direction while the RSI indicator moves in the opposite direction.
This disconnect between Price action and Momentum is what traders find significant.
Bullish / Bearish Divergence - This Divergence occurs at the end of a trend, be it Bullish or Bearish Trend.
RSI Hidden Divergence is a more subtle and advanced form of divergence that occurs within trending markets. It's different from regular divergence because it suggests the trend will continue rather than reverse.
Why It's Called "Hidden" ?
Regular divergence is more "obvious" because Price and RSI move in completely opposite directions . Hidden divergence is subtler— It appears within the flow of an existing trend and is easy to miss, hence the name.
Reasons to Prefer Hidden Divergence Rather then Classic Divergence !!!
When we follow Classic Divergence, the possible results are....
False Signals
The biggest issue is that divergences frequently fail to produce reversals. A price may form a lower low while RSI forms a higher low, suggesting a reversal is coming, but the price continues in the original direction anyway. This can lead traders into losing trades if they act on divergence signals prematurely.
Lagging Nature
RSI divergence is a lagging indicator—by the time you spot it clearly, a significant portion of the move may already be complete. You're often trading what's already happened rather than predicting what's about to happen. The reversal might be weeks away, making it difficult for short-term traders.
Subjectivity in Identification
Identifying divergence requires drawing trend lines and choosing which highs and lows to compare. Different traders might draw these lines differently, leading to inconsistent identification of the same divergence. This subjectivity makes it harder to create reliable, mechanical trading rules.
Continuationpattern
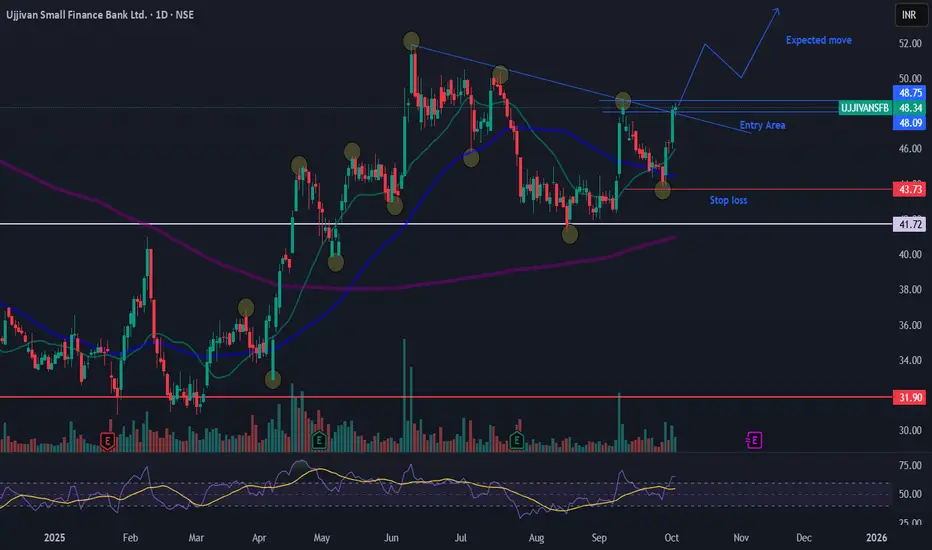
Ujjivan Small Finance Bank Ltd stage 2 continuation breakoutUjjivan Small Finance Bank Ltd stage 2 continuation breakout
Entry 48-49
SL 43.7
Only for journaling, not a trading/investing tip.
This post is for my personal use.
Note : only for learning, not a trading recommendation. i am posting as a trading journal for learning before and after breakout.
HWC - LongThis is a weekly candlestick chart of Hancock Whitney Corporation (HWC) listed on NASDAQ. The chart is showing a Cup and Handle pattern, which is a bullish continuation pattern often seen before an upward breakout. Let’s break it down step by step:
🔎 Pattern Analysis
Cup Formation (Left Side to April 2025)
The chart formed a large round bottom (cup), which reflects a gradual decline followed by a steady recovery. This signals accumulation by smart money (big investors quietly buying at lower levels).
Handle Formation (June–August 2025)
After the cup, prices consolidated slightly downward and sideways, forming the handle.
This is the last stage before a breakout, essentially a "pause" before buyers take full control.
Breakout Zone (63 level): The neckline (or breakout level) is around $63. Price has just broken above this neckline, confirming the bullish pattern.
🎯 Price Target Projection
The height of the cup is around $18.43 (41.73%). Adding this to the breakout point ($63) gives a target of around $81. This is marked on the chart as the Target zone.
📉 Stop Loss (Risk Management)
The suggested Stop Loss (SL) is set at $56.94. If prices fall below this, the bullish setup would be invalid, so risk needs to be controlled.
🔔 Key Takeaways for Members
✅ A bullish Cup and Handle breakout is visible.
✅ Breakout confirmed above $63.
🎯 Upside Target: $81
📉 Stop Loss: $56.94
⏳ This is a weekly timeframe, so it may take weeks/months for the target to be achieved. Patience is key.
⚠️ Disclaimer: This explanation is only for educational purposes, not financial advice. Always do your own research and manage risk before making trading decisions.

DCM Shriram - Continuation PatternA Continuation pattern is being formed. It may take some time to breakout, but it looks certain that when the breakout happens it could fly.
Strong ability to service debt as the company has a low Debt to EBITDA ratio of 0.09 times
The company has declared positive results in Dec'2024 after 3 consecutive negative quarters
PBT LESS OI(Q) At Rs 344.43 cr has Grown at 102.5 %
PAT(Q) At Rs 262.14 cr has Grown at 101.1 %
CASH AND CASH EQUIVALENTS(HY) Highest at Rs 1,756.50 cr
With ROE of 7.9, it has a Fair valuation with a 2.7 Price to Book Value
The stock is trading at a premium compared to its average historical valuations
While the stock has generated a return of 12.40%, its profits have risen by 5.3%
PEG ratio of the company is 6.26

Mastering the Flag Chart Pattern for Profitable BreakoutsFlag Chart Pattern: A Key to Successful Breakouts
Hello Traders!
I hope you’re all doing well! Today, we’ll be taking a deep dive into the Flag Chart Pattern . This continuation pattern is a favorite for traders looking for a strong trend to follow. If you want to spot reliable breakouts, the Flag pattern is something you’ll want to master. It can help you ride strong trends and get in at the right moment after a brief consolidation.
What is the Flag Pattern?
The Flag Chart Pattern forms after a sharp price movement (the Flagpole ), followed by a brief consolidation period. The consolidation forms a rectangular or parallelogram shape, which is the Flag . Once the price breaks out of this consolidation, it often continues in the same direction as the initial Flagpole .
In other words, the Flag Pattern signals that the market is taking a quick breather before continuing its strong momentum in the same direction.
Key Characteristics of the Flag Pattern
Flag Pole : The initial sharp price movement (either upward or downward), showing strong momentum.
Flag : The consolidation phase that follows the pole, typically characterized by parallel trendlines, forming a rectangular or parallelogram shape.
Breakout : The price breaks above (for a bullish pattern) or below (for a bearish pattern) the flag's upper or lower boundary, confirming the continuation of the trend.
Volume Confirmation : Volume usually decreases during the consolidation (flag) phase, followed by a surge in volume at the breakout, which confirms the strength of the move.
How to Trade the Flag Pattern Like a Pro
Entry Point : The best time to enter is after the price breaks above the flag’s upper boundary (for bullish setups).
Stop Loss : Place your stop loss just below the flag’s lower boundary or the most recent swing low, to minimize risk.
Profit Target : For setting targets, measure the height of the flagpole and project that distance from the breakout point to set your profit target.
Real-World Application: Dixon Technologies Case Study
Looking at the Dixon Technologies chart, we can see a clear Flag Chart Pattern forming. After a sharp price increase (the flagpole ), the stock consolidated, creating the flag . Once the price broke out above the flag’s upper trendline, the price continued to rise, confirming the continuation of the uptrend. The expected target can be calculated using the flagpole’s height, projecting it from the breakout point.
Conclusion
The Flag Chart Pattern is one of the most reliable continuation patterns in technical analysis. By recognizing the flagpole , waiting for the breakout, and managing your risk effectively, you can increase the chances of a successful trade.
Have you traded using the Flag pattern?
Share your experiences in the comments below! Let’s learn together and keep improving our trading strategies!

#ASTRAZEN - Potential All Time High BreakOut / Feb'25📊 Script: ASTRAZEN
Key highlights: 💡⚡
📈 Stock is in a Stage 2 Up Trend
📈 VCP under formation in DTF
📈 Wait for more consolidation
📈 BO with volume spike, then only enter
📈 MACD can give a Bounce
📈 RS Line is making 52WH
📈 EMA Rule in place
📈 Price consolidated for 73Days
📈 One can go for Swing Trade
⚠️ Over All Market condition is bad, Practice paper trading
🟢 If you have any questions regarding the setup, please feel free to leave your inquiries in the comments, and I will respond promptly.
BUY ONLY ABOVE 7955 DCB
⏱️ C.M.P 📑💰- 7498
🟢 Target 🎯🏆 – NA%
⚠️ Stoploss ☠️🚫 – NA%
⚠️ Important: Always Exit the trade before any Event.
⚠️ Important: Always maintain your Risk & Reward Ratio.
✅#Boost, #Like & #Follow to never miss a new idea! ✅
Disclaimer: I am not SEBI Registered Advisor. My posts are purely for training and educational purposes.
Eat🍜 Sleep😴 TradingView📈 Repeat 🔁
Happy learning with MMT. Cheers!🥂

Neat & Clean Cup and Handle Pattern Breakout seen in INOXWINDHello everyone i have brought a stock which has given a breakout of Continuation pattern which called Cup and Handle Chart Pattern. Stock name is INOXWIND.
Inox Wind Limited is a part of the Inox Group. The company is engaged in the business of manufacturing Wind Turbine Generators (WTGs) and is a wind energy solutions provider servicing IPPs, Utilities, PSUs, Corporates and Retail Investors. Inox Wind Ltd is a fully integrated player in the wind energy market and provides end-to-end turnkey solutions.
Note:- Technically chart is looking bullish as it has given breakout of Cup and Handle pattern but fundamentally i have not find that much attractive, so i am not advising this stock for long term type, my view here is only for short term. Please follow strictly stop loss in this.
Let's learn about this pattern (Cup and Handle)
Q:- What is Cup and Handle Pattern?
Ans:- It is a bullish continuation pattern that occurs in an uptrend and signals that the price of the stock will continue to trend higher on completion of the pattern. The pattern gets its name from its shape which resembles that of a conventional tea cup with a handle. It is one of the most occuring pattern used across the world to spot dominant uptrend for taking long positions.
Q:- How to take entry and exit and where to keep stop in this Chart pattern?
Ans:-Entry Point: Place the trade when the price rises above the handle created resistance level. This breakout confirms the pattern and indicates the resumption of the uptrend.
Stop Loss and Take Profit: Set a stop-loss order below the handle’s support level to limit potential losses. Determine a take-profit level by measuring the depth of the cup and adding it to the breakout point.
Volume Confirmation: Keep an eye on volume during the breakout. Higher trading volume should accompany the breakout, indicating strong buying interest and validating the pattern’s reliability.
Monitor Price Action: Continuously monitor the price action after entering the trade. Consider trailing your stop loss to protect profits and adjust your take-profit target if necessary.
Disclaimer:- Please always do your own analysis or consult with your financial advisor before taking any kind of trades.
Dear traders, If you like my work then do not forget to hit like and follow me, and guy's let me know what do you think about this idea in comment box, i would be love to reply all of you guy's.
Thankyou.

SJVN Analysis for Long Term!NSE:SJVN Analysis!
SJVN Analysis on a Daily Timeframe!
Triangle Pattern formation in SJVN!
Triangle Pattern Breakout in SJVN!
Analysis:
SJVN was trading in a Triangle pattern. Yesterday it gave a powerful breakout to its resistance line with significant amount of volume. Also consider the 20, 50, 100 period EMA as these are also acting as a Support and Resistance as the price is respecting them it is moving ahead with them. Rest of the Analysis is on the chart itself please study it thoroughly.
Trade Setup:
Entry = Current price level is good to Enter but always enter 0.50rs above the previous day high.
Target = 226.64
Stop Loss = Below 136.11 or as per your Risk to Reward
Disclaimer = Consider my analysis for Educational Purpose only.
Before entering into any trade -
1) Educate Yourself
2) Do your research and analysis
3) Define your Risk to Reward ratio
4) Don't trade with full capital

Retesting Triangle Pattern | Long Bias On 4h TF
GALA has broken out the pattern, now it's retesting support
The target around $0.15 for this bullish
Time will tell

HAL - Flag breakout...Nice and clear Flag pattern, breaking out for new highs, just to continue ongoing rally...

"No Pain No Gain" - Not the same with RATEGAIN.I see a Cup and Handle Pattern is formation.
Uptrend Continuation Pattern.
Initial target is the cup resistance.
We can review it again once that resistance is broken.


Bajaj finance chart dailywhere do bajaj finance go first ? What do you think ?
1. Bearish H&S is forming break below neckline. it will fall.
2. It will rise from Support zone.
3. It is forming a continuation pattern, it will rise after breakout above trendline.
4. it is making a bearish pattern descending triangle, it will fall.
Please do comment your answer.
my vote goes 2 option.
Note : only for learning, not a trading tip.

Uptrend Continuation- Triveni EngineeringHello all,
I am here again with one more strong stock. The purpose is not to give you any call but to make you learn how to analyze a stock:)
The stock after giving a good uprun, went into correction mode. Interestingly, it formed a rounding bottom during this price as well as time correction. The volumes as you can see were almost dead during the declining phase of the rounding bottom while the volumes shot up as the stock moved towards the completion of the pattern.
Today, it has finally broken the previous high created on 6th July with volumes. An entry at this point would give a good RR.
SL can be kept at previous pull back which is around 192 (see on line chart).
Takeaways:
1) Develop your eyes to see any pattern formation.
2) Keenly observe the price action. (in this case, the price correction from 6th July to 28th Sept was covered by just three green bars).
3) Focus on volumes as well with price.
4) Also observe the previous trend (in this case the stock is in a strong uptrend and is hence likely to continue it's journey)
I hope you will all reflect on this analysis and learn.
Do share your feedback/suggestions/advice with me in the comments section:)
Happy Trading!

Rest of this year belongs to PHARMA now!NSE:GLENMARK has upside to witness further after it broke all time high.
The 45MIN chart here shows support area to which it will test its fall and reverse from the "Box of Price Reversal"

INFY TRADE IDEA | 5/3/21All the reasons for the trade have been mentioned in the image.
----Happy Trading
