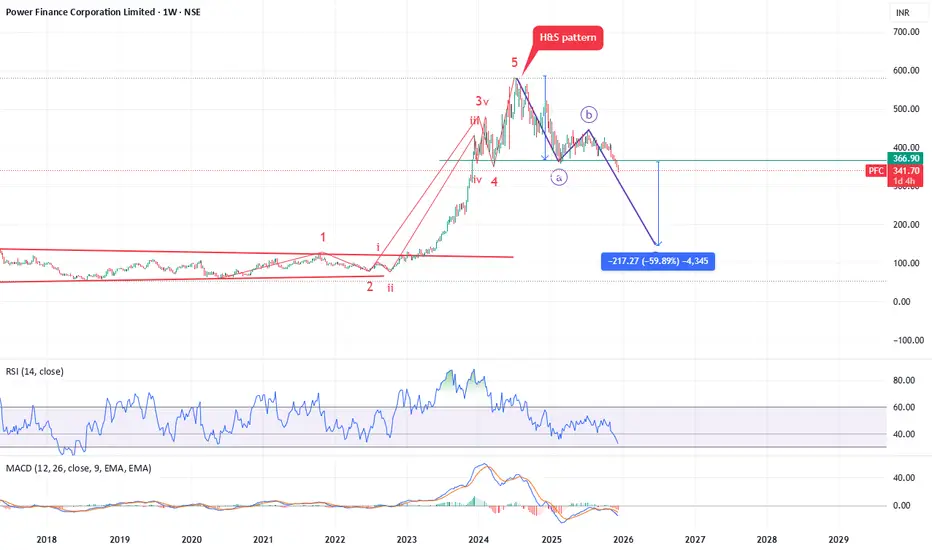
Elliott Wave Interpretation of PFC chart.Elliott Wave Interpretation of PFC chart.
Your chart shows a full 5-wave impulse completed on the weekly timeframe:
Wave 1 → 2 → 3 → 4 → 5 completed around mid-2024
Wave 5 shows exhaustion + RSI divergence → confirms top
A Head & Shoulders pattern formed near the Wave 5 top
After completion of the impulse, market entered a corrective ABC phase
Probability of ABC returning to Wave 1 region
✔ Because the prior 5 waves were extremely extended,
✔ and because the top created a Head & Shoulders reversal
Tentative Target for the ABC Pattern (Wave C Target)
🎯 ₹130 – ₹160 (High probability)
🎯 ₹100 – ₹130 (If selling accelerates)
Correction
GOLD: The Bigger Picture is Finally Getting Clearer !Gold finally showed some clarity after weeks of structure, and now the bigger picture is lining up perfectly across the daily and multi-year weekly charts. The rejection from the 4250–4350 zone triggered the first meaningful retracement after a parabolic rally, and price is now hovering right above the 4030–4060 daily support the only level holding back a much deeper corrective cycle. This entire region is critical because it marks the last breakout base, the liquidity origin, and the midpoint of the 3600-4300 vertical leg. As long as this shelf holds, gold will continue to move in a compressed range, but once a clean daily close breaks below it, the market naturally opens up a fast move toward the 3500–3550 target zone. All confluences measured move, channel midline, point to this same cluster, making it a high-confidence retracement level inside a long-term bullish trend.
On the upside, the structure is very clean. Only a sustained breakout above 4300–4350 invalidates the entire correction and flips the bias back to full-bull mode, where gold can easily run toward 4600–4800 as the next discovery leg. Anything below that zone still falls under the extended correction category, not a bullish continuation. This is why the invalidation level is drawn exactly where it is to protect from guessing the reversal too early.
On the weekly chart, gold has slipped back inside the multi-year ascending channel after briefly wicking above it. That wick was nothing but a classic blow-off extension followed by a reversion to mean. Now price is sitting comfortably inside the same long-term structure . The upper red band remains the multi-year resistance, the green midline is the structural backbone of the trend, and the purple lower band is the deep cycle accumulation zone. As long as gold stays inside this channel, the macro remains strongly bullish and corrections within this structure are normal and healthy. The mid-channel region around 3500 also aligns perfectly with the expected daily correction, which adds even more confirmation that this retracement is simply part of the long-term trend and not a trend reversal.
Commodity index on both daily and weekly frames is cooling off from extreme levels, which supports a deeper pullback rather than an immediate rally. No new bullish divergence has appeared yet, meaning momentum still favors a downside sweep before any major upside continuation. Combine that with the lack of fresh macro drivers and a stabilization in rate-cut expectations, this cooling phase was overdue.
In simple below daily support, gold continues the correction toward 3500-3650 above 4350, the correction thesis dies and the bull trend resumes aggressively. Until then, this is a textbook retracement inside a long-term uptrend nothing broken, nothing unexpected, just a parabolic market taking a breath. Trade safe !

GOLD@ 3890 : Bubble Peak or Just a Pit-Stop?Pullback vs. Correction The 100th-Idea Deep Dive !!
Gold has moved almost 88% in the last two years to new records. The main drivers are falling real yield expectations with an easing bias, persistent geopolitical risk, record central bank buying and the 2025 rebound in ETF demand.
Geopolitics is shifting as Washington pushes for a Gaza ceasefire. Headlines talk about partial acceptance and ultimatums but nothing is done yet. The war premium can fade step by step though headline shocks will still remain.
Key levels:-
Resistance 3890–4000
Pullback zone 3640–3650 (5%)
Correction zone 3475–3480 (11%)
Weekly RSI stretched into high 70s and 80s → risk of mean reversion before any bigger change.
Macro gears:-
Real yields and the dollar:-
Lower real yields = higher gold. That is the key lever. As rate cuts and softer real rates were priced into 2025, gold repriced hard.
Central bank sponsorship:-
Official demand has been consistent three years in a row. 2022 at 1082t, 2023 at 1037t, 2024 at 1045t. This is rare in modern data and explains why dips are shallow.
ETF flows:-
After outflows in 2024, 2025 turned. Three straight months of inflows into August, strongest since 2020, YTD around 588t. Pure fuel ✨
Geopolitics & the premium:-
From 2023 to 2025 Middle East risk kept term premia elevated. Now Gaza peace talks open a path for that premium to fade. But timelines and enforcement are unclear. Strikes still came even with peace headlines. Means the bleed can be gradual but headline spikes remain..
Pullback or true correction:-
3890–4000 is the confluence zone. Psychological milestone + vertical extension after 88% impulse. Bubble behavior meets supply.
Level 1 at 3640 → about -5% pullback. If bids hold, trend resumes.
Level 2 at 3470→ -10 to -12% wash into prior shelf. Would be first real reset in two years.
Weekly momentum overbought. Phases like this don’t end instantly but forward returns improve after reset.
Flows @ CBs rarely chase tops, they buy weakness across months. That softens drawdowns.
ETFs are flighty. Peace plus firmer yields can stall inflows. Any Fed pivot or growth wobble can flip them back fast.
Possible future paths :-
Continuation bubble :- Break 3900 → 4050–4200
Triggers dovish Fed, softer yields, failed peace, ETF flows
Tactic = only add above 3900 on daily/weekly close. No chasing wicks.
Shallow pullback :-Tag 3630–3660 then rotate
Triggers peace holds, modestly firm yields, demand returns
Tactic = scale in near 3640–3650 if H4 shows higher low + reclaim POC. First TP 3780–3820.
True correction :- flush 3520–3460
Triggers Gaza settlement + real yields higher + ETF stall
Tactic = let it wash. Look for capitulation + basing 3480–3460. Best R:R after failed bounce and reclaim.
Levels & invalidation:-
Bull continuation pivot 3890–3900. Opens 4050–4200.
Pullback buy zone 3630(Hvz)–3650 with confirmation. Invalidation H4 <3600.
Correction buy zone 3480 ±20 after basing. Invalidation weekly <3420 → opens 3300–3350.
If flat → stagger entries and size carefully.
If long from lower → trail under last daily HL, book partial 3880–3950.
Surprise risk (Imp) ETF squeeze higher – inflows still not at 2020 peak → late cycle melt-up possible.
Policy shock – faster cuts or fiscal noise sink yields = blow-off. Strong data → pop in yields = sharp air pocket.
Geopolitical whipsaw – peace unravels → $50–100 spike in thin tape!!
Bottom line:-
This is a two year vertical impulse meeting macro reality at 3890.
Level 1 = 3640–3650 pullback line.
Level 2 = 3480 correction line.
Until weekly breaks, dips are still opportunities not obituaries. But only with structure. No blind catching this high up.
Bubbles don’t end quietly – great trends reset then go again ✨
Fade euphoria into 39xx if momentum stalls. Buy fear into 348x if the market finally delivers the reset it owes.
Trade safe ⚡
Sparkrlight ♾️✨⚡

Smart Money Concepts1. Introduction: What is Smart Money Concepts?
Smart Money Concepts (SMC) is a modern price action trading methodology that focuses on how big players — institutions, hedge funds, banks, and market makers — move the market.
The core belief: price is manipulated by "smart money" to accumulate positions before large moves, and if you can track their footprints, you can ride their moves instead of getting trapped like retail traders.
In SMC, you don’t rely on indicators that lag behind price. Instead, you learn to read the raw story of price action: where liquidity lies, where stop hunts happen, and where imbalances push price.
Think of it like this:
Retail trading is reacting to price.
SMC trading is predicting what price will want to do, based on smart money’s needs.
2. Core Principles of SMC
SMC builds around a few non-negotiable principles:
2.1 Market Structure
Price moves in waves (higher highs, higher lows in an uptrend, or lower highs, lower lows in a downtrend).
Smart money manipulates these structures:
Break of Structure (BOS): When price breaks a significant swing point in the direction of the trend.
Change of Character (ChoCH): A shift in market bias — often the first sign of trend reversal.
Example:
If we’re in an uptrend and suddenly a major low is broken, this isn’t “random selling.” It’s likely a smart money signal that distribution has started.
2.2 Liquidity
Smart money hunts liquidity pools — areas where retail traders have stop-loss orders:
Above recent highs → stop-losses of short sellers.
Below recent lows → stop-losses of long traders.
Why? Because triggering these stops provides the volume big players need to enter large positions without causing huge slippage.
2.3 Order Blocks
An Order Block is the last opposite candle before a strong impulsive move.
For example:
In an uptrend: the last bearish candle before a strong bullish push.
In a downtrend: the last bullish candle before a strong bearish push.
Order blocks are institutional footprints — zones where smart money likely placed big orders.
2.4 Imbalance & Fair Value Gap (FVG)
Sometimes price moves so fast in one direction that it leaves a gap between candles’ wicks — meaning no trades happened in that range.
Price often revisits these Fair Value Gaps to “rebalance” the market before continuing.
2.5 Premium & Discount Zones
Using Fibonacci retracement, the 50% level divides the market into:
Premium (above 50%) → expensive zone for buying, better for selling.
Discount (below 50%) → cheap zone for buying, better for selling.
Smart money often buys at a discount and sells at a premium.
3. How Smart Money Operates
Retail traders believe price moves randomly — smart money knows better.
3.1 Accumulation & Distribution
Markets cycle through:
Accumulation → Smart money quietly builds positions at low prices.
Manipulation → Stop hunts and fake breakouts to mislead retail traders.
Distribution → Price moves explosively in their intended direction.
3.2 Stop Hunts
Smart money deliberately pushes price to known liquidity areas:
Looks like a breakout to retail traders → but reverses right after.
This traps breakout traders and activates their stops, providing liquidity.
3.3 Inducement
Before moving toward the main liquidity pool, smart money creates a “bait” level to attract retail orders. This induces traders to place stops exactly where smart money wants.
4. SMC Tools & Key Components
4.1 Market Structure Tools
Swing highs/lows
BOS (Break of Structure)
ChoCH (Change of Character)
4.2 Liquidity Identification
Equal highs/lows (double tops/bottoms)
Trendline liquidity (breakouts)
Session highs/lows (London, New York, Asia)
4.3 Order Blocks
Bullish OB → for buys
Bearish OB → for sells
Refined OB → using lower timeframes for precision
4.4 Fair Value Gaps
Look for large impulse moves leaving gaps between candle wicks.
4.5 Fibonacci Levels
Use 50% as a bias divider, 61.8% & 78.6% for sniper entries.
5. The SMC Trading Process
Here’s a step-by-step method to apply SMC:
Step 1: Higher Timeframe Bias
Start from daily (D1) or 4H charts.
Identify market structure (uptrend, downtrend, or range).
Mark major BOS and ChoCH points.
Step 2: Identify Liquidity Pools
Look for equal highs/lows, trendlines, swing points.
Mark where retail traders are likely trapped.
Step 3: Locate Order Blocks
Find the last opposite candle before a strong move.
Confirm it aligns with your higher timeframe bias.
Step 4: Watch for Imbalance
Mark Fair Value Gaps for potential retracements.
Step 5: Entry Execution
Drop to lower timeframes (5M, 1M) for refined entries.
Wait for a lower timeframe BOS in the direction of your trade.
Step 6: Risk Management
Stop-loss just beyond the order block or liquidity sweep point.
Risk 1–2% per trade.
6. Example Trade Setup
Imagine EUR/USD is in an uptrend on 4H:
4H BOS confirmed bullish bias.
Liquidity found below equal lows at 1.0750.
Bullish order block spotted just below 1.0750.
Fair Value Gap in that same area.
On 5M chart → price sweeps liquidity, taps OB, breaks minor high.
Entry after BOS → SL below OB → TP at previous high.
7. SMC vs Traditional Technical Analysis
Aspect Traditional TA SMC
Indicators Uses RSI, MACD, Moving Averages Pure price action
Focus Patterns (Head & Shoulders, etc.) Liquidity, order flow
Timing Often late entries Precision entries
Mindset Follow trend Follow smart money
8. Common Mistakes in SMC Trading
Over-marking charts → clutter leads to confusion.
Forcing trades without waiting for confirmation.
Ignoring higher timeframe bias.
Not managing risk — precision doesn’t mean perfection.
9. Psychology of SMC Trading
SMC can give very high RR trades (1:5, 1:10), but the patience required can be tough.
You need:
Discipline to wait for setups.
Emotional detachment from market noise.
Confidence to enter when it feels counterintuitive.
10. Final Thoughts: Why SMC Works
SMC works because it aligns your trading with the actual drivers of price — the big money.
Instead of being prey, you become a shadow of the predator.
Key takeaways:
Market is a liquidity game.
Learn where smart money is likely to act.
Trade less, but with sniper precision.

Keep an eye on #BandhanbankIt appears that Bandhan Bank is currently forming a corrective pattern, which may lead it to fall back to fresh lows.
Always trade with a protective stop.
**This is an educational market outlook, not investment advice. Please consult a SEBI-registered advisor before taking any investment decisions.**
Cheers,
PipVoyager

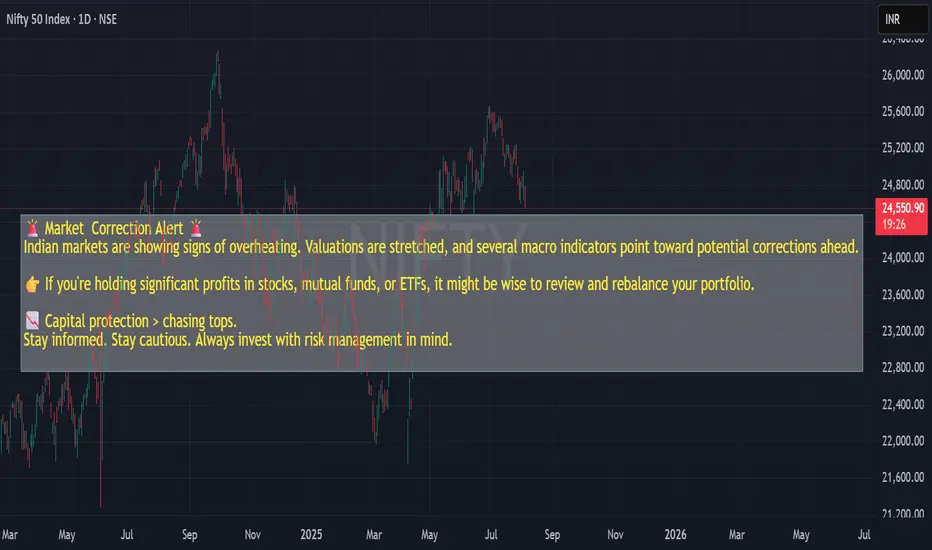
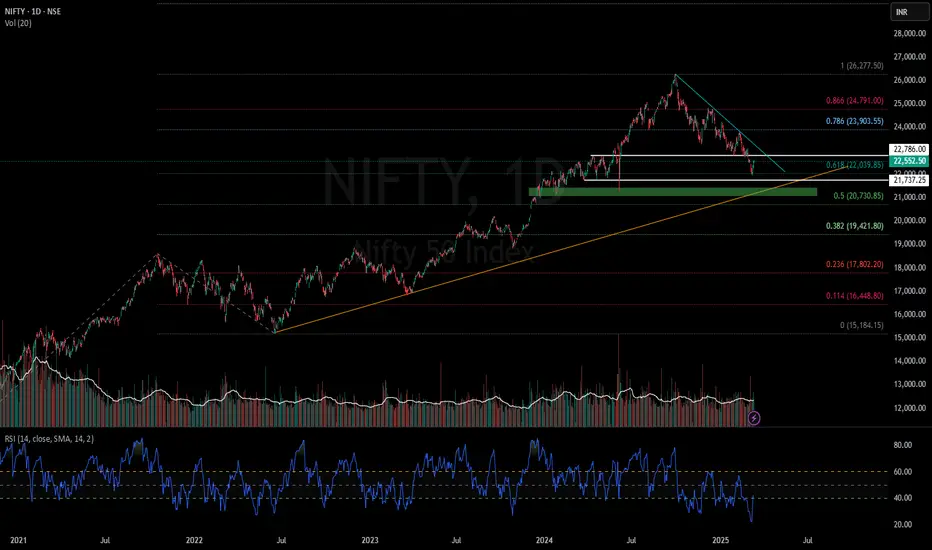
Nifty50-Macro Risk Update - shows Overheating - Correction Alert📊 Market Observation | August 1, 2025
This Nifty 50 daily chart highlights potential macro risks that may influence investor behavior.
🧠 Key Insights:
- Valuations appear stretched on multiple metrics.
- Price structure has formed lower highs post-peak.
- Macro indicators suggest possible correction ahead.
🟡 Educational Note:
If you're holding long-term positions, this may be a good time to revisit portfolio allocations with a focus on capital preservation.
📌 Risk Management Reminder:
Capital protection often outweighs return chasing near potential tops.
All observations are structure-based and educational. This is not financial advice.
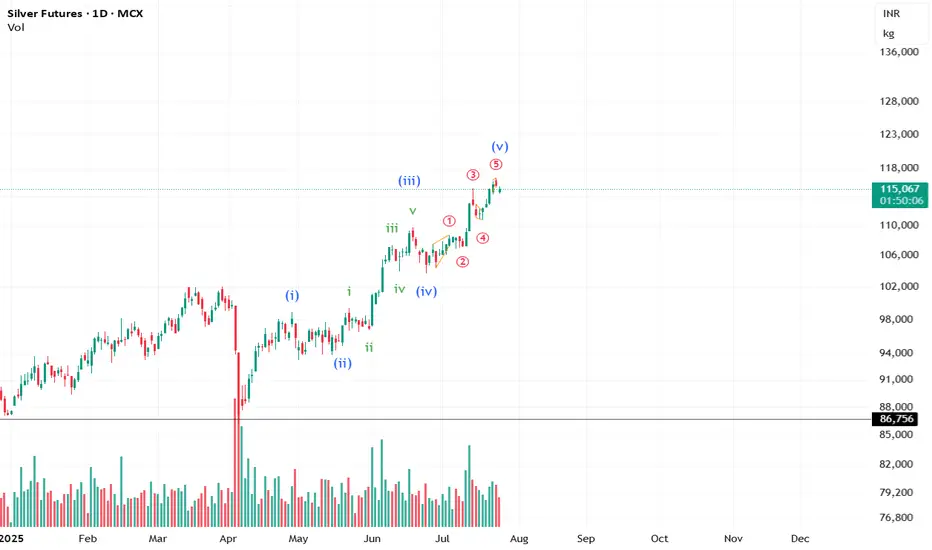
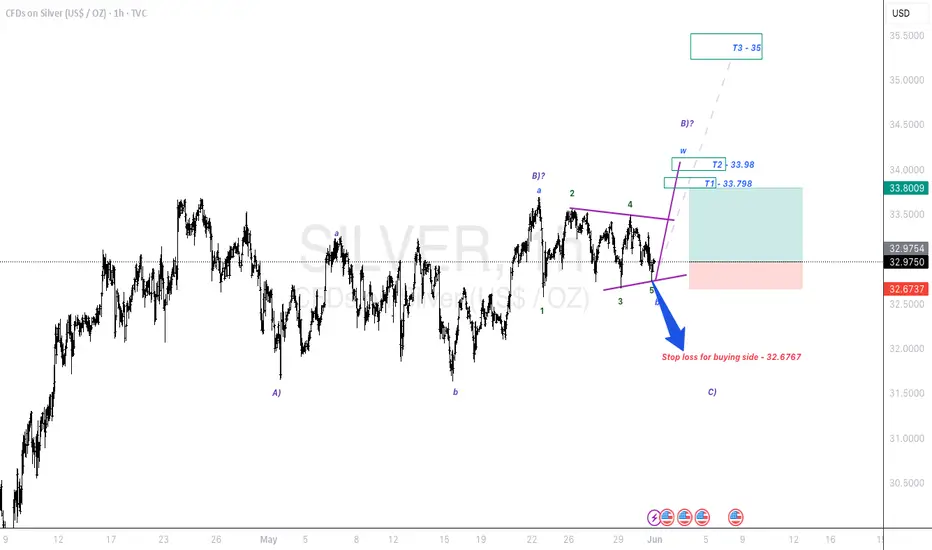
Is the move over for Silver? #CommodityIt looks like the impulse for Silver is about to end. However, we still need the price action to confirm the view.
**This analysis is based on the Elliott Wave Principle.
This analysis is for educational purposes only and not investment advice.
Please consult your SEBI-registered advisor before making any investment decisions. Markets are subject to risk.**
Institutional Option Trading Part -2Disadvantages
Regulatory scrutiny.
Complexity and need for highly skilled traders.
Potential market impact.
Institutional Investing
Institutional investing is the process of managing large-scale investment portfolios with long-term goals.
Investment Objectives
Capital Preservation: Maintaining the value of assets.
Capital Appreciation: Growing the portfolio over time.
Income Generation: Providing steady returns through dividends or interest.
Asset Classes Used
Equities: Shares of publicly traded companies.
Fixed Income: Bonds and other debt instruments.
Real Estate: Direct investments or REITs.
Commodities: Such as gold, oil, or agricultural products.
Derivatives: Options, futures, and swaps.

Institutions Option Database TradingDatabase Option Trading is a powerful blend of market logic and data science. With structured data, intelligent scanning, and strategic execution, traders gain a massive edge over emotional/manual decisions. This approach is ideal for traders aiming for consistent performance, lower drawdowns, and systematic growth. The more you code, automate, and analyze—the better you trade.
Sample Strategy - PCR + OI Spike
Strategy Logic:
If PCR > 1.3 and Call OI Spike at ATM > 15%, initiate a Put Sell.
Exit when PCR drops below 1.1 or OI unwinds.
Backtest Results (NIFTY Options):
Win Rate: 72%
Avg Profit per Trade: ₹4800
Max Drawdown: ₹9800

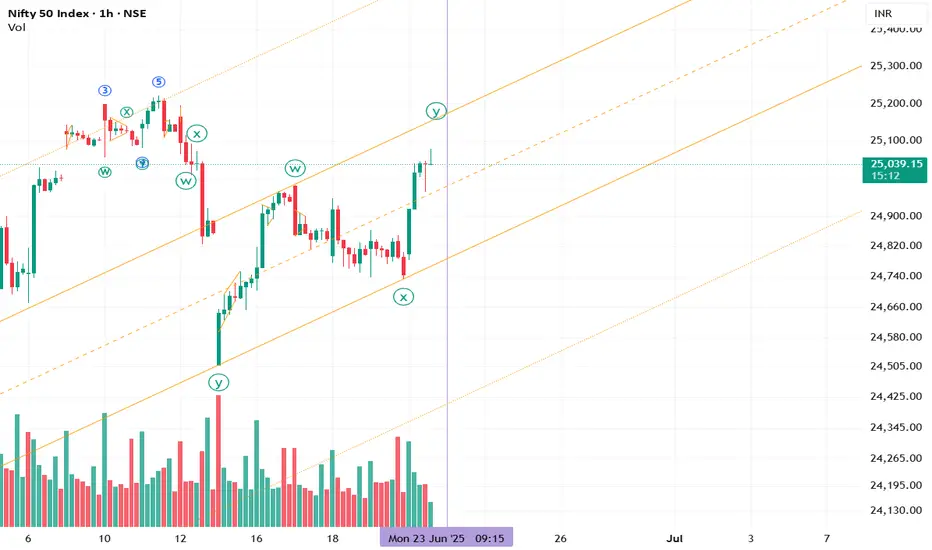
Not feeling good about this like me?Can it be called a possible complex correction? The move appears to be contained with a channel and the ratio analysis and Advance Decline is not supporting this upmove.
Option Trading How Institutions Operate:
Use Option Greeks (Delta, Gamma, Theta, Vega) for precise positioning
Follow OI (Open Interest) data for liquidity zones
Monitor FIIs/DII data from NSE reports
Combine options with futures arbitrage or cash segment hedging
🔹 Tools Used by Institutions:
Bloomberg Terminal
Custom-built Quant Models
NSE Option Chain + IV Analysis
Algo-driven trading based on volatility signals

Advanced Institutions Option Trading - Part 7Time Decay (Theta) Strategies
Options lose value over time due to Theta Decay.
Strategies to Take Advantage of Theta:
Selling options (Covered Calls, Naked Puts)
Calendar Spreads
Iron Butterflies
Caution:
Theta decay accelerates as expiry nears. Option sellers must hedge their deltas to stay safe.
Risk Management in Options
Institutions and pro traders always focus on capital protection.
🔐 Techniques:
Position sizing (no more than 2-3% risk per trade)
Hedging with opposite legs or underlying
Stop-loss on premium or delta exposure
Use of Greeks for real-time adjustment
Risk management > Strategy in the long run.

silver in triangle breakout. Two possibilities. one is impulisveElliott Wave Analysis:-
1st possibility:-
Silver is in a triangle breakout . if it is getting towards upside breakout then we have a nice opportunity of pullback and and we can add it if the pullback occurs. else we can enjoy this journey quietly.
2nd possibility:-
Silver had already made a pullback towards down side breakout. Once it start the way it will fly towards downside and then it will complete a C wave in whole B wave then upside C wave will be impulsive.
This type 2 will be discussed in next chart. I will post it as seperately chart for clear understanding .
I am not a SEBI registered advisor. Before taking a trade do your own analysis or consult a financial advisor. I share chart for education purpose only. I share my trade setup.
End of correction in Hinduja Global SolutionsElliott wave analysis:-
A long bear trend has been almost over and we may expect a slight fall from here or the Candle may rise to stars from here. if you wish to be cautious then wait for a pullback for almost 65% to 78%. keep the previous low as your stop loss go for a long ride.
i am not a SEBI registered advisor. Before taking a trade do your own analysis or consult a financial advisor. I share chart for education purpose only. I share my trade setup.

View on DCX Systems#DCX Systems is in sideways trend but will be bullish in upcoming days for entry one can wait for the correction till 240-220.
has a orderbook of 2000Cr only of Defence, company has specialized in PCB's. added new clients from USA, Lockheed martin is one of them. Also a Beneficial of Make in India, Indian government is in process of biggest deal for Defence around 22,000Cr, This company can benefit from the deal.

Nifty 50 - Mar 2025 view - Is the correction over?If you have followed my last 2 views of Nifty50, you would be smiling definitely only if you didn't have any swings open.
We have seen a good correction in market since September 2024.
It was much needed in market since 2022 , we have seen an extended move in Indian markets.
I know mid and smallcaps have corrected more than 20% but they were bound for it because of overvaluation. We are in a slowdown phase of economy and earnings of those company wont match expectations.
Coming back to Nifty50, is the correction over?
IAnswe is cant be sure but 1 thing is definite, 21800-22000 will act as strong demand zone as we have seen a quick 600 points jump from 22000.
However, I will suggest to wait for confirmation for any new swings.
What next?
Nifty might be retesting 22800 breakdown. It can fall again towards 21800 and if it breaks 21800 which looks very less probable, 21000-21200 is a very very strong demand zone which should be the last zone for correction.
If Nifty manages to jump from 22000, it will be formation of W pattern(double bottom) which will be a sign of reversal. That's when you can start accumulating.
Expecting March to be sideways to bearish again. We might see a selling due to people booking losses for tax harvesting.
If 21800-22000 holds in March, we can see buying in April which will take it to 23900.
Be patient. Start analyzing stocks for accumulating. Stay healthy and wealthy!
Advanced Option Trading with Professionals Let's review each part of the professional trader's mind to understand where you want to be, ideally as you develop as an online trader.
Discipline and Consistency. ...
Emotional Control. ...
Continuous Learning. ...
Fundamental Analysis. ...
Technical Analysis. ...
Sentiment Analysis. ...
Goal Setting. ...
Risk Management.
When options are better. Options can be a better choice when you want to limit risk to a certain amount. Options can allow you to earn a stock-like return while investing less money, so they can be a way to limit your risk within certain bounds. Options can be a useful strategy when you're an advanced investor.

Possible Wave Counts on Daily Time Frame Chart of DXYMost investors treat trading as a hobby because they have a full-time job doing something else.
However, If you treat trading like a business, it will pay you like a business.
If you treat like a hobby, hobbies don't pay, they cost you...!
In this study we used Elliott Wave Theory & Structures, here we have plotted possible wave counts on daily time frame chart of DXY Dollar Index, it involves multiple possibilities, and the analysis presented focuses on one potential scenario. The provided information is for educational purposes only, not trading advice. There's a risk of being completely wrong.
I am not Sebi registered analyst.
My studies are for educational purpose only.
Please Consult your financial advisor before trading or investing.
I am not responsible for any kinds of your profits and your losses.
Hope this post is helpful to community
Thanks
RK💕
Disclaimer and Risk Warning.
The analysis and discussion provided on in.tradingview.com/u/RK_Charts/ is intended for educational purposes only and should not be relied upon for trading decisions. RK_Charts is not an investment adviser and the information provided here should not be taken as professional investment advice. Before buying or selling any investments, securities, or precious metals, it is recommended that you conduct your own due diligence. RK_Charts does not share in your profits and will not take responsibility for any losses you may incur. So Please Consult your financial advisor before trading or investing.

CAN MARKETS SURPRISE US??? BANK NIFTYIndian markets are at an all-time high. Both Nifty and Bank Nifty are trading near their resistance levels.
Technically, a correction is due. I'm not expecting any big upside move in Indian indices.
I won't be surprised if Bank nifty corrects by 3000 points in the coming days.
This would correspond to the length of wave 3 as well as 0.618 Fibonacci retracement.
Trade with appropriate stop-loss.
PS: MARKET is always RIGHT!

High Probability of a NIFTY Correction!I've cloned the previous correction pattern (AB) and aligned it with the current top (C), which I am considering as the top of this bull run. Interestingly, the cloned correction aligns perfectly with key demand zones (highlighted as green boxes) and a trendline that has now converted from resistance to support.
Keep an eye on this. Could be an exciting time for Indian investors!

HDFC - Will it take U-Turn ? - Close from 1800 Disclaimer:
Trading in financial markets involves substantial risks. Consult your financial advisor before making decisions. This commentary is not a solicitation to buy or sell.
WaveTalks - Market Whispers! Can you hear them?...........
Will the Giant Take a U-Turn after achieving all the targets 1555 was the first in the series ....
Possible Reasons for Next Expected Move
Possible Double Top at 1794 ( Will be valid until holds below 1800)
Pattern Thrust from 1630's - Key level
Elliott Wave - Corrective Sequence could be completed from the support zone 1375 - 1390 to 1800 approx highs .or about to end .mentioned in the connecting 1st idea published on 27th Jan 2024 - The Bullish Gartley
Bullish Gartley Idea ( 1375 - 1800..) - 1st Idea of the Series in Jan 2024
Enjoying Target 1 - 1555 in April 2024
Nifty at 26000 - We are almost close to 27600's Target ...Can we achieve the dream run or we correct & later push towards
From WaveTalks
Good Night

RELIANCE Levels For Intraday or swing TradingChart Overview:
Current Price: ₹6,735.851.
Recent Performance:
1 day: +0.80%
5 days: +0.48%
1 month: +0.54%
6 months: +2.42%
Year to date: +16.29%
1 year: +21.40%
5 years: +165.58%
Support and Resistance Levels:
Pivot Points:
Resistance 1 (R1): ₹6,650.37
Resistance 2 (R2): ₹6,684.38
Resistance 3 (R3): ₹6,712.77
Pivot Point: ₹6,621.98
Support 1 (S1): ₹6,587.97
Support 2 (S2): ₹6,559.58
Support 3 (S3): ₹6,525.57

Nifty IT Levels For Long or swing TradingNifty IT Chart Overview:
Current Value: ₹24,7801.
Recent Performance:
1 day: +0.76%
5 days: +1.47%
1 month: +2.40%
6 months: +12.59%
Year to date: +15.11%
1 year: +29.61%
5 years: +127.45%
Key Data Points:
Volume: Not specified
Previous close: Not specified
Open: Not specified
Day’s range: Not specified
Recent Analyst Views (August 22nd):
Price was moving in a wide range for two days and broke out above the consolidation range.
Buy Above: ₹24,780
Stop Loss: ₹24,740
Targets: ₹24,820, ₹24,860, ₹24,890, and ₹24,920
Sell Below: ₹24,680
Stop Loss: ₹24,720
Targets: ₹24,640.
