Muthoot Finance Trade Setup !TREND ANALYSIS & TRADE SETUP
TRIANGLE CHART PATTERN !!
Follow Chart Instruction.
Do not be Hurry for entry.
Wait for Proper Entry Setup.
Buy/Sell with Best Risk Reward.
Educational Chart Only.
August Series Option can be traded.
Wait for entry setup, if available then Long/short.
Reward is 8-10 Times
Correctivewave

Bajaj Finance: Shifting Price LevelsBajaj Finance fell today post result declaration. A mega bull run has halted temporarily.
Much need correction in price has been started.
Scrip is following consolidation followed by a brief upmove strategy, Thus shifting price levels in a ladder-like structure.
It will retest the 3115-3130 levels on further correction( lower levels of Top-most rectangle). And can start its uptrend journey here to 3500 levels.
If broke the 3115 level, expected further correction till 3010.

EURUSD BUY @ 1.1050 Hi Friends,
EURUSD trading on final leg of complex corrective pattern on medium term. On short term price reached its monthly support levels and also as per wave count i am expecting EURUSD found minor bottom @ 1.1050 level. From here i am looking corrective upside upto 1.1130 level.We can clearly see wave 2 of this count took more sideways action so wave 4 we can expect sharp move.
ENTRY & EXIT LEVELS:
LONG @ 1.1050 -- SL @ 1.1000 --- TP @ 1.1130

NIFTY50NSE:NIFTY got stiff resistance around 11860 levels, moving above head of hypothetical pattern will make the pattern invalid and holding above it for sometime will only push stock towards 11935/65/00 levels. If the H&S pattern comes into action, index may fall towards neck line of the pattern and if breaks and hold below neckline may push further down towards 11450 levels.
SUMMARY-
Holding above 11860 ---> 11935 ---> 11965---> 12000
If H&S is valid then from current levels expect fall for targets 11725 ---> 11660 (neckline) --->11625
Consider 11625 as crucial support because --->
1. The first reversal pattern has failed from the same level.
2. It has gap up formed on 20th may (exit polls), which will act as support and the height(target) of the head of second continuation pattern.
3. Again, at the same level it may form double bottom or ugly triple bottom.
Holding below 11625 for sometime----> 11450
REGARDS,
SHARMA YOGESH


INFOSYS SHORTINFOSYS IS SELL FOR TARGETS OF 590-550.
REASONS:
1. IT IS AT A UPPER DIAGONAL OF A RISING WEDGE (BEARISH PATTERN).
2. 5TH WAVE OF DOMINANT WAVE IS COMPLETED. NOW CORRECTIVE WAVES WILL START.
STOPLOSS: "ABOVE SWING HIGH OR AS PER RISK BEARING CAPACITY"

EUR/USD Technical analysisEUR/USD pair has formed a full Elliott wave and it is currently forming a corrective ABC wave in the 4-hour chart.
We expect the counter to make a sharp bullish move once it reaches the point B. Traders can also look for cues in the shorter time frames to take long positions.

GBP/JPY Technical analysisThe chart clearly indicates the pair after completed 5 Elliot waves and currently is in Correction wave ABC
Buy after the B wave completion with the expected Target 148.067

GBP/JPY Technical analysisGBP/JPY has broken its bearish trend line. The price action has also created a higher low.
The price action indicates that it will move towards the next resistance placed at 148.092.
If it makes a bullish crossover above the resistance,then we can expect the price to move towards the major resistance of 149.967.

DXY Weekly analysisThe 4-hour chart of Dollar index has completed an (1-5) Elliot wave. It is due for an ABC corrective wave.
The price action indicates that it has broken the support of 94.18.
A small pullback up to the support level is expected.
Once the the support has been re-tested the index will move towards the next support level placed at 93.22.

EUR/USD Technical analysisThe EUR/USD pair has formed a wolfe wave. Now it has crossed the 5th wave. It has been also In the Elliot full wave correction So we expect a bullish movement up to the value @1.18500 which is also a good resistance zone.
Buy the pair once it crosses the trend line

DXY Technical analysisThe daily chart of the dollar index has formed a Full Elliot Wave.
It is due for a correctio n in the form of ABC Wave.
Also there is a possible double top pattern forming in the counter.
The pair has also formed a evening sta r pattern in the candlestick.
So as per the above analysis,we can expect a strong a downside in the Dollar index.

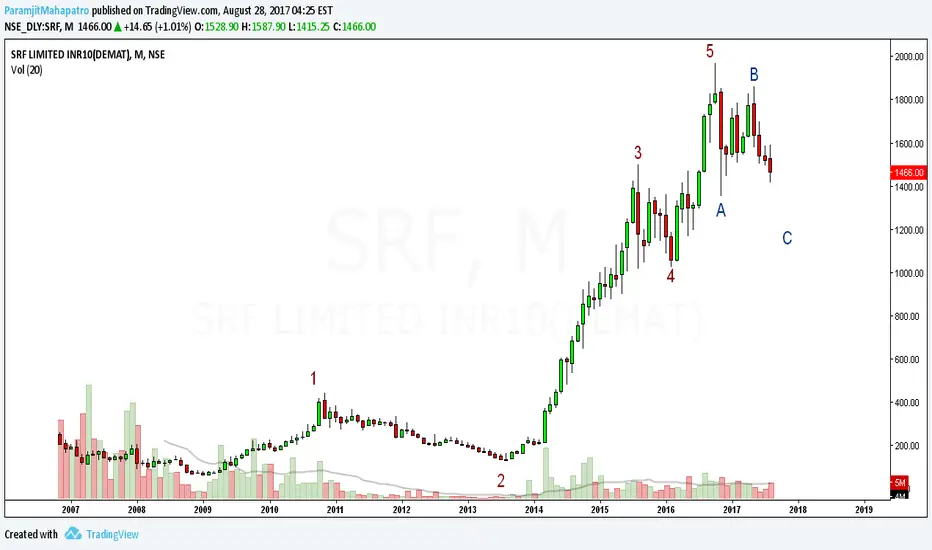
SRF EW analysis - sub wave C of wave (2) is going on here.In monthly, ew count shows that sub wave C of wave (2) is going on here.
Here are the fractals of wave (2) in daily,
fibo extension of sub wave C. . 1(1251), 1.272(1085) quite possible here.
fibo retracement levels for wave (2). .382(1235), .5(1000) quite possible here.
NIFTY ENTERS INTO SHORT TERM CORRECTIVE STRUCTUREHI EVERYONE, As per my last post i mentioned Nifty reaches its 3rd of 5th wave resistance level. Yesterday market hold on 8650 and confirms the nifty enters into short term corrective structure.
Wait and enter long on Next month. NIFTY Targets are 8737, 8975 and 9018
