The Case of Craftsman Automation Ltd : BreakoutUnderstanding Uptrends and Breakouts: The Case of Craftsman Automation Ltd
🔹 The Nature of an Uptrend
An uptrend in stock markets is characterized by a sequence of higher highs (HH) and higher lows (HL).
Higher Highs (HH): Each rally surpasses the previous peak.
Higher Lows (HL): Each correction bottoms above the prior low.
This pattern reflects sustained buying interest and investor confidence. Craftsman Automation Ltd has been in a continuous uptrend since its listing, consistently respecting this principle.
🔹 Breakout from Consolidation
Stocks often enter consolidation phases where prices move sideways, digesting prior gains.
Consolidation is healthy—it allows fundamentals and valuations to catch up.
A breakout above a previous high (like the September 2024 peak) signals renewed momentum.
When a stock breaks out after 1–2 years of consolidation, it often attracts fresh institutional and retail participation, as the breakout confirms strength and long-term demand.
🔹 Why Higher High Breakouts Matter
1. Psychological Barrier: Previous highs act as resistance. Breaching them signals buyers’ dominance.
2. Volume Confirmation: Breakouts with strong volume indicate conviction.
3. Trend Continuation: A higher high after a long pause suggests the uptrend is resuming with vigor.
For Craftsman Automation Ltd, crossing the September 2024 high at ₹7,079 is a technical milestone, reinforcing its bullish trajectory.
🔹 Current Opportunity
1. The breakout suggests potential for trend continuation.
2. Traders and investors often view such moves as opportunities to ride the next leg of the rally.
3. However, entry should be disciplined—not chasing blindly but aligning with risk management.
🔹 Risk Management & Stop Loss Awareness
Even strong uptrends can face pullbacks. Risk management is crucial:
Stop Loss Placement:
1. Below the breakout level (₹7,079) or
2. Below the most recent higher low.
Position Sizing: Never allocate more than a defined percentage of capital to one trade.
Avoid Emotional Trading: Breakouts can sometimes fail (false breakouts). Always respect stop losses.
A disciplined approach ensures that even if the trade doesn’t work, losses remain controlled.
🔹 Key Takeaways
Craftsman Automation Ltd is in a structural uptrend with consistent HH-HL patterns.
The breakout above September 2024 highs marks a renewed bullish phase.
Such long-term breakouts often present strong opportunities, but risk management is non-negotiable.
Traders should use stop losses and prudent position sizing to safeguard capital.
Craftsmanautomation

A Technical Perspective on Craftsman Automation LtdCraftsman Automation Ltd is showing strong bullish momentum, trading above its previous resistance and forming a classic higher high–higher low pattern. This technical setup suggests a potential breakout to new highs in the coming weeks or months.
Craftsman Automation Ltd has been on a steady upward trajectory, recently trading around ₹7,175. This price action is not just a number—it reflects a deeper technical story unfolding on the charts. Let’s break it down using simple yet powerful technical principles.
🔁 The Power of Higher Highs and Higher Lows
One of the most reliable patterns in technical analysis is the higher high–higher low sequence. It’s a hallmark of a sustained uptrend. Here’s what it means:
Higher Highs: Each new peak is higher than the previous one, showing increasing buying interest.
Higher Lows: Each pullback ends at a level higher than the last, indicating that sellers are unable to push the price down significantly.
Craftsman Automation has been consistently respecting this structure on the weekly chart, which adds more weight to the trend’s strength. Weekly patterns are more reliable than daily ones because they filter out short-term noise.
🔓 Breaking Past Resistance
The stock has now moved above its September 2024 resistance, which was also the previous swing high. This breakout is significant because:
It confirms the continuation of the uptrend.
It signals that the market has absorbed selling pressure at that level.
It opens the door for price discovery—where the stock can explore new highs without historical resistance.
This is often when momentum traders and institutional investors step in, adding fuel to the rally.
📊 RSI: Gauging Momentum, Not Overcomplicating It
The Relative Strength Index (RSI) is a simple yet effective momentum indicator. Currently, RSI is above 50 and approaching 70. Here’s why that matters:
Above 50: Indicates bullish momentum.
Approaching 70: Suggests increasing strength, but not yet overbought.
When RSI crosses 70 during an uptrend, it often signals strong bullish continuation, not necessarily a reversal—especially when supported by price structure like higher highs and higher lows.
🧠 Why This Setup Matters
This isn’t just about indicators—it’s about confluence. The alignment of price structure (higher highs/lows), breakout above resistance, and strengthening momentum (RSI) creates a compelling technical case. Traders often look for such confluence to increase the probability of success.
🛠️ Risk Management Still Rules
Even in strong setups, risk management is key. Traders might consider:
Trailing stop-losses below recent higher lows.
Scaling in rather than going all-in at once.
Watching for volume confirmation to validate the breakout.
In summary, Craftsman Automation Ltd is technically positioned for a potential breakout to new highs, supported by a textbook uptrend structure and strengthening momentum. For traders and investors who follow price action and trend-based strategies, this could be a high-probability opportunity worth watching.

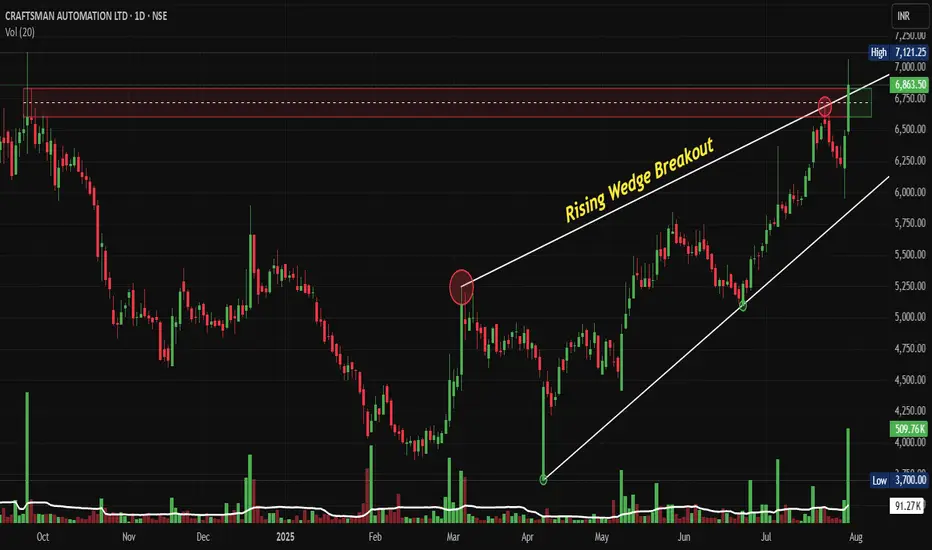
CRAFTSMAN: Rising Wedge Breakout Post Q1 FY26NSE:CRAFTSMAN Breaks Above Rising Wedge: A Bullish Technical Play Worth Watching Post Decent Q1 FY26 Results
Price Action Analysis:
Current Price Movement:
• Current Price: ₹6,863.50 (as of July 30, 2025)
• Day's Performance: +₹415.50 (+6.44%)
• Volume: 91.27K shares
• 52-Week Range: ₹3,700 - ₹7,121.25
Price Structure Analysis:
• Trend: Strong uptrend from March 2025 lows
• Higher Highs: Consistent formation since March 2025
• Higher Lows: Well-defined support levels during pullbacks
• Momentum: Acceleration post-breakout with gap-up opening
Volume Spread Analysis:
• Volume Patterns: Decreasing volume during the consolidation phase
• Breakout Volume: Significant surge indicating institutional participation
• Volume Profile: Above-average participation at key resistance levels
Key Price Levels:
• All-Time High: ₹7,121.25 (immediate target zone)
• Breakout Level: ₹6,500 (now acting as support)
• Previous Resistance: ₹6,200-6,300 (now support zone)
• Major Support: ₹5,800-6,000 (rising trendline confluence)
Base Formation:
• Primary Base: Extended consolidation between ₹4,800-6,500 from March to July 2025
• Duration: Approximately 4 months
• Depth: Shallow correction of 15-20% from previous highs
• Character: Healthy sideways movement with diminishing volatility
Key Support and Resistance Levels:
• Major Resistance: ₹7,121.25 (all-time high)
• Immediate Resistance: ₹6,900-7,000 zone
• Strong Support: ₹6,500 (breakout level)
• Major Support: ₹5,800-6,000 (rising wedge upper trendline)
• Critical Support: ₹5,200-5,300 (previous consolidation zone)
Technical Pattern:
Rising Wedge Breakout:
• Pattern: Bullish breakout from a rising wedge formation
• Formation Period: March 2025 to July 2025
• Breakout Level: ₹6,500 approximately
• Volume Confirmation: Strong volume spike on breakout day
Trade Setup:
Entry Strategy:
• Primary Entry: ₹6,850-6,900 (current levels on any minor dip)
• Aggressive Entry: ₹6,800-6,850 (immediate entry)
• Conservative Entry: ₹6,650-6,700 (on pullback to breakout level)
Target Levels:
• Target 1: ₹7,200-7,300 (immediate resistance zone)
• Target 2: ₹7,800-8,000 (measured move target)
• Target 3: ₹8,500-9,000 (cup and handle projection)
Stop-Loss Levels:
• Aggressive Stop: ₹6,400 (below breakout level)
• Conservative Stop: ₹6,200 (below rising wedge support)
• Trailing Stop: Move to breakeven once Target 1 is achieved
Position Sizing:
• Risk per trade: Maximum 2% of portfolio
• Position size calculation based on stop-loss distance
• For ₹6,850 entry with ₹6,400 stop: Risk = ₹450 per share
• Recommended allocation: 1-2% of equity portfolio
Risk Management:
Risk Factors:
• Market-wide correction could drag the stock down
• Sector rotation out of engineering/auto components
• Profit booking at all-time high levels
• Global economic headwinds affecting the auto sector
Risk Mitigation:
• Strict stop-loss adherence
• Partial profit booking at each target level
• Position size limiting to manage portfolio risk
• Monitoring broader market sentiment
Exit Strategy:
• Book 30% profits at Target 1
• Book another 40% at Target 2
• Trail remaining 30% with rising stop-loss
Sectoral and Fundamental Backdrop:
Business Overview:
• Diversified engineering company with vertically integrated manufacturing
• Three main segments: Automotive Powertrain (51%), Aluminium Products (21%), Industrial & Engineering (28%)
• Market capitalization: ₹16,357 crores
• Revenue: ₹6,323 crores with profit of ₹211 crores (TTM)
Recent Financial Performance(Q1 FY26):
• Q1 FY26 results: Revenue of ₹1,784 crores, profit of ₹70 crores
• PAT growth: 31% YoY in Q1 FY26
• Segment performance: Aluminium Products revenue up 102.82% YoY
• Powertrain revenue: ₹496.41 crores (up 19.23% YoY)
Sector Dynamics:
• Automotive sector recovery post-pandemic
• Increasing adoption of aluminium components for weight reduction
• Growing demand for powertrain components in commercial vehicles
• Beneficiary of the Make in India initiative
Key Clients and Market Position:
• Supplies to tier 1 OEMs including Tata Motors, Cummins, M&M, Royal Enfield
• Strong presence in commercial vehicles, two-wheelers, and tractor segments
• Established player in aluminium die-casting and machining
Growth Drivers:
• Capacity utilization improvements
• Focus on higher-margin aluminium products
• Expansion in industrial and engineering segments
• Increasing content per vehicle trends
Analyst Outlook after Q1 FY26:
• Average 1-year price target: ₹5,754 (though this appears conservative given current price)
• Price target range: ₹4,318 to ₹8,085
• Positive sentiment on aluminium business growth
• Capex guidance of ₹100-120 crores annually for maintenance and debottlenecking
My Take:
The technical setup for NSE:CRAFTSMAN presents a compelling bullish case with the successful breakout from a rising wedge pattern, supported by strong volume and a healthy fundamental backdrop. The stock is well-positioned to test new highs, though traders should remain disciplined with risk management given the proximity to all-time high levels. The diversified business model and strong sectoral tailwinds provide fundamental support to the technical breakout.
Keep in the Watchlist and DOYR.
NO RECO. For Buy/Sell.
📌Thank you for exploring my idea! I hope you found it valuable.
🙏FOLLOW for more
👍BOOST if you found it useful.
✍️COMMENT below with your views.
Meanwhile, check out my other stock ideas on the right side until this trade is activated. I would love your feedback.
Disclaimer: "I am not a SEBI REGISTERED RESEARCH ANALYST AND INVESTMENT ADVISER."
This analysis is intended solely for informational and educational purposes and should not be interpreted as financial advice. It is advisable to consult a qualified financial advisor or conduct thorough research before making investment decisions.
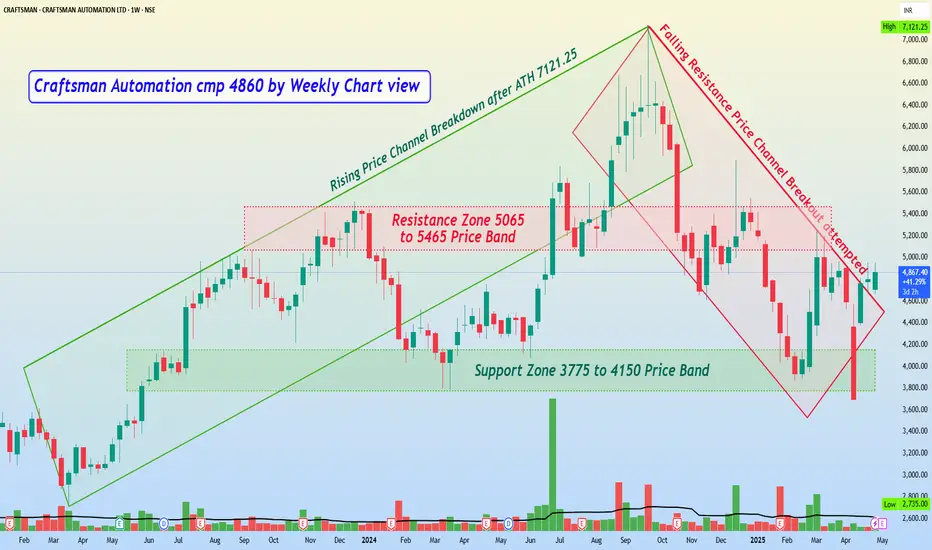
Craftsman Automation cmp 4860 by Weekly Chart viewCraftsman Automation cmp 4860 by Weekly Chart view
- Support Zone 3775 to 4150 Price Band
- Resistance Zone 5065 to 5465 Price Band
- Rising Price Channel Breakdown after ATH 7121.25
- Falling Resistance Price Channel Breakout attempted
- Volumes needed close in with avg traded qty for upside price momentum
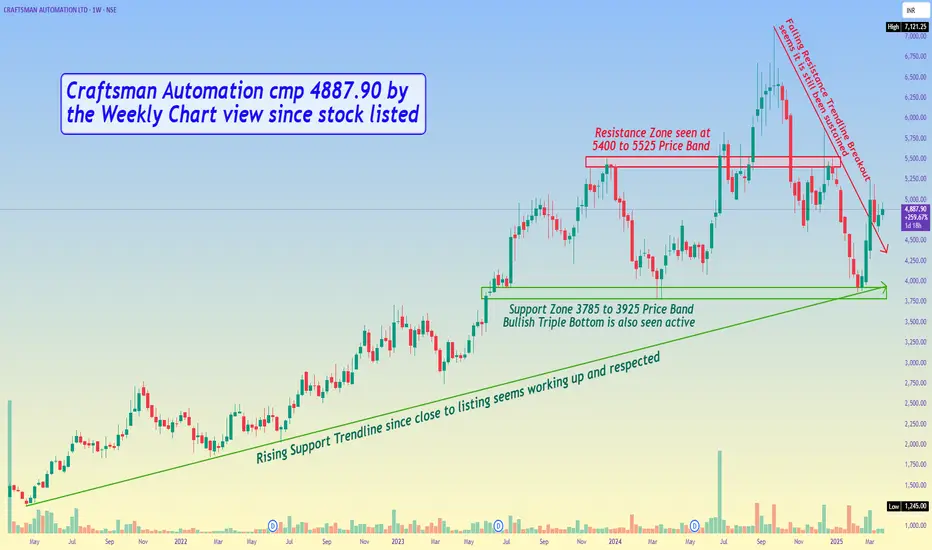
Craftsman Automation cmp 4887.90 Weekly Chart view since listed Craftsman Automation cmp 4887.90 by the Weekly Chart view since stock listed
- Support Zone 3785 to 3925 Price Band
- Bullish Triple Bottom is also seen active
- Resistance Zone seen at 5400 to 5525 Price Band
- Falling Resistance Trendline Breakout seems it is still been sustained
- Rising Support Trendline since close to listing seems working up and respected
CRAFTSMAN AUTOMATION - Swing Trade Analysis - 16th June #stocksCRAFTSMAN AUTOMATION (1W TF) - Swing Trade Analysis given on 16th June, 2024
Pattern: CUP & HANDLE
- Weekly Volume Buildup at Resistance - Done ✓
- Weekly Resistance Breakout - In Progress
- Demand Zone Retest & Consolidation - In Progress
* Disclaimer

CRAFTSMAN AUTOMATION - Price Reversal - 50% upside?Overview & Observation:
1. HH-HL formation implies bullish structure.
2. Perfect volume spike.
3. Strong candle formation and breakout of the channel.
4. Earnings are stable.
5. RSI above 75 means we can expect some consolidation or minor pullback before the next big move.
Trade Plan:
- Entry Point: 1st aggressive entry can be planned at CMP
- Stop Loss: 10%
- Target: 15-50% (ATH high resistance break is expected minimum...)
- Stay tuned for further insights, updates and trade safely!
- If you liked the analysis, don't forget to leave a comment and boost the post. Happy trading!
Disclaimer: This is NOT a buy/sell recommendation. This post is meant for learning purposes only. Please, do your due diligence before investing.
Thanks & Regards,
Anubrata Ray

Short Term Trading in Craftsman Automation for > 10% UpsideHi,
NSE:CRAFTSMAN has given a Bullish Flag Breakout on Daily charts with very good volume.
MACD is also on the bullish side on Daily time frame. RSI is also on the bullish side on daily and weekly time frames.
In the current market scenario, I am expecting that the bullish momentum will continue.
Complete price projection like entry, stop loss and targets mentioned on the charts for educational purpose.
Don't Forget to Follow me to get all the updates.
Please share your feedback or any queries on the study.
Disclaimer: Please consult your financial advisor before making any investment decision.

Series of Bullish Patterns in CRAFTSMANCRAFTSMAN stock chart has formed a series of bullish patterns. Let's break it down:
📈 Inverse Head and Shoulders Pattern 📈
➤ The inverse head and shoulders pattern formed from January 2023 to May 2023 at all-time high levels.
➤ Inverse Head and Shoulders is generally considered a bullish signal.
📈 Breakout and Retest 📈
➤ On May 31st, 2023, a breakout occurred for the inverse head and shoulders pattern with good volume, indicating a potential upward move.
➤ The next day, on June 1st, a retest of the breakout level occurred at the neckline of the inverse head and shoulders pattern, further strengthening the bullish case.
📈 Ascending Triangle Pattern 📈
➤ Following the retest, an ascending triangle pattern formed on the lower 15-minute time frame.
➤ An ascending triangle is a bullish continuation pattern, indicating potential upward momentum.
📈 Based on these patterns, the overall technical outlook appears positive. The inverse head and shoulders pattern followed by a breakout, retest, and subsequent formation of an ascending triangle suggests potential upward momentum in the stock's price. Consider planning a buy entry upon the breakout of the ascending pattern if you missed the entry at the retest of the neckline.
Disclaimer: This analysis is for educational purposes only and does not constitute financial advice. I am not a SEBI registered analyst. Always conduct your own research and consult a qualified professional before making any investment decisions.
💬 Feel free to share your observations and insights in the comments section. Your comments and feedback are greatly appreciated. Don't forget to like this analysis if you found it helpful!
🤝 Thank you for your continuous support, likes, follows, and comments. Your engagement keeps me motivated to consistently provide valuable content.
Follow me on TradingView for more articles and trade setups: in.tradingview.com
🚀🔥 Trading is a journey. Stay motivated and keep learning! 🔥🚀
Technical Terms Explained :
Inverse Head and Shoulders Pattern : A bullish reversal pattern characterized by three successive troughs, with the middle trough (the head) being lower than the other two (the shoulders). It indicates a potential trend reversal from bearish to bullish.
Breakout : When the price of an asset moves above a significant level of resistance, signaling a potential upward move.
Retest : After a breakout, when the price retraces back to the breakout level, acting as a test to validate the breakout's strength.
Ascending Triangle Pattern : A bullish continuation pattern characterized by a series of higher lows and a horizontal resistance line. It suggests potential upward momentum.

Craftsman Inverted head and shoulder trade ideaI daily make educational content videos for swing / positional trading

buybuy abv 3470.25 stop loss 3370.25 target 2.5 times of risk.
Disc : It's not an investment advise to buy or sell

Craftsman Auto -Cup & Handle Pattern Breakout...Craftsman Automation Ltd -Cup & Handle Pattern Breakout Weekly Time Frame. Entry Zone-3000/3100.Expect a Target-3900/3950.Stop Loss-2725.only Educational Purpose.

Craftsman automationBuying an uptrend stock at support is the best strategy i have found yet. Buy craftsmanauto at CMP tgt1 is 2600+, tgt 2 is 3000+. views are for 3-6 months.

Craftsman AutomationGood breakout
wait for a pullback to enter....
Above 1988 bulls in control
1800-1840 Good entry point...

Craftsman Automation - LongCRAFTSMAN - Long
Trade and Invest Wisely with your own knowledge! Good Luck!
You can also see my other stock analysis and the results in my profile ideas. Please follow me , If you would like to see more ideas on winning stocks.
**Disclaimer:
I am NOT a SEBI registered consultant/Advisor. It is completely my view and opinion.
My intention is not to provide any financial advice, training advice, or any type of advices or any recommendations on stock/Forex/Coin buying or selling.
Please do your own research and consult with your financial advisor before taking any action.
I am not responsible for any of your action on buying or selling or holding the above mentioned stock or/and index or/and Forex or/and coins .
***


Craftsman Automation- Daily charts
- IPO Play
- Breakout with volume+tightness+new RS High
- Looks good for swing/ Positional

Craftsman Automation is Bullish!NSE:CRAFTSMAN has formed rounding bottom, broke out of a pattern and now will keep rising.
Its a good fundamental stock for upcoming Electric Vehicle boom in this decade.
