CRISIL cmp 4322.10 by Weekly Chart viewCRISIL cmp 4322.10 by Weekly Chart view
- Support Zone 3960 to 4300 Price Band
- Resistance Zone 4600 to 4940 Price Band
- Support Zone tested retested for 3rd week now
- Rising Support Trendline seems to be well respected
- Volumes are keeping well above average traded quantity
- Continued Selling but Buying keeps Price above Support Band
- Price reversal from Support Zone maybe in making by Chart Status
CRISIL

Bullish Momentum with EMA200 and Volume Confirmation📈 CRISIL Technical Analysis | Bullish Momentum with EMA200 and Volume Confirmation
📅 Date: May 08, 2025
📈 Timeframe: Daily
🔍 Stock: CRISIL(NSE)
📊 Price Action Update (Today):
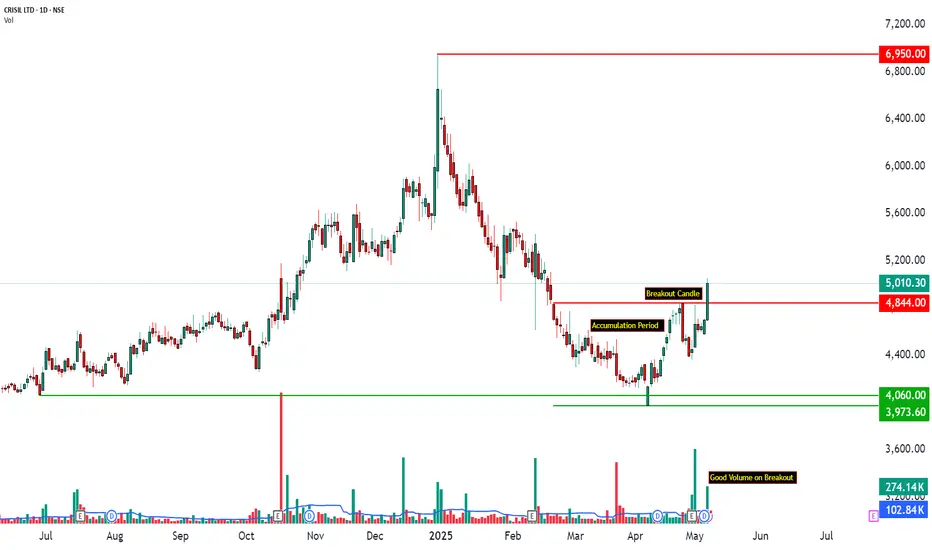
CRISIL surged by +6.59%, closing at 5,010.30, after trading in a range between 4,690.20 and 5,050.00. The stock formed a strong bullish candle, resembling a Marubozu, with a close near the day’s high — a clear sign of aggressive buying. This breakout comes after a tight consolidation phase, and is supported by heavy volume, indicating strong participation and conviction in the move.
🧠 Technical Overview:
CRISIL has shown a decisive shift in structure with today’s breakout above its 200-day EMA, signaling a potential trend reversal. The stock had been consolidating in a narrow range for several sessions, building energy for a directional move. Today's breakout is validated by a surge in volume (2.5x the 20-day average), along with supportive indicators like RSI crossing 60, Bollinger Band expansion, and the TTM Squeeze turning OFF. These combined signals suggest that the stock is entering a momentum phase, where further upside is likely if follow-through buying continues. Immediate attention should be on price behavior around the next resistance at 5,143.
🧩 Chart Pattern Insight:
The price action on the daily chart reveals a rectangle consolidation breakout. CRISIL had been trading within a well-defined horizontal range, forming a base between 4,600 and 4,800 for several sessions. This pattern represents a period of accumulation. Today’s strong breakout candle marks a range breakout with volume confirmation, turning the previous resistance zone into potential support. The structure resembles a base breakout pattern, often seen before the start of a new uptrend. A sustained move above the breakout zone may lead to a measured move towards the next resistance levels.
🧱 Support & Resistance Analysis:
Post-breakout, CRISIL has established a new support base around 4,784, which was previously a resistance level during consolidation. Below this, the next key supports lie at 4,557 and 4,423, providing a cushion in case of any pullbacks. On the upside, the immediate resistance to watch is 5,143, a level where price previously reacted. If the momentum continues, CRISIL may test 5,276 and 5,503 in the coming sessions. These levels will be crucial in determining whether the breakout evolves into a sustained trend or faces short-term profit booking.
🔍 Volume Analysis:
The recent price movement in CRISIL shows a noticeable increase in volume, with traded volume at 2.5 times the 20-day average, suggesting heightened market activity. The breakout candle, paired with this significant volume, indicates a potential shift in the market trend. Prior to this, volume was relatively lower during the consolidation phase, indicating a period of accumulation or base-building. This typical volume pattern — lower during consolidation and higher during a breakout — strengthens the case for a potential trend change.
The volume profile suggests a shift in market sentiment, with buying interest becoming more prominent in the 4,700–4,800 range. The breakout candle shows a notable volume exceeded 270K, indicating increased buyer participation. Additionally, selling pressure observed in the 4,500–4,700 zone seems to have been absorbed, which may indicate a potential for further price movement.
📌 Educational Insight:
The recent breakout in CRISIL Ltd is a strong example of a trend reversal confirmed by volume, offering valuable insights for those studying price action, trend shifts, and volume dynamics. This setup illustrates how multiple indicators — including trend, volume, and volatility — align to suggest the potential for a trend continuation. Traders often look for such setups to make risk-defined entries during pullbacks. The breakout is characterized by significant volume and a full-bodied green candle on the daily chart, supported by several technical factors, such as volume and delta support, an EMA 200 crossover, and volatility expansion after a squeeze.
The outlook for CRISIL Ltd remains bullish, driven by multiple technical confirmations. However, caution is advised as the price approaches Resistance Levels 1 and 2 (R1–R2), where profit booking may occur. Additionally, if the price falls below 4,783 with volume confirmation, traders should consider reevaluating their positions.
⚠️ Disclaimer:
This analysis is purely educational and not a buy/sell recommendation. Please consult your financial advisor before making investment decisions. This content complies with SEBI guidelines and is intended to promote learning and market awareness.
Crisil: The Credit Rating Agency is Set for Significant Growth!
The price is currently on an upward trajectory, characterized by a series of higher highs and higher lows.
After hitting resistance around the 3,740 level, the stock price pulled back but found strong support near the 2,700 level.
It then bounced back and surpassed its previous resistance.
This breakout was significant, as it emerged from the Rounding Bottom pattern that had formed during the consolidation phase.
Following the breakout, the stock price stabilized just above the breakout zone for a while.
Then, with a dramatic surge, the stock reached an all-time high of ₹6200.
However, a wave of selling pressure caused the price to drop back to its trendline support.
At present, the stock price is steadily climbing, indicating promising growth potential.


RATING COMPANY IS RE-RATING CANDIDATE.After reaching highs of 5000, NSE:CRISIL corrected well below 4000 levels but now forming inverted H&S pattern which will breakout at 4500 while another inverted H&S pattern on hourly is expected to take place. Stoploss at 3850.

CRISIL for 25% (approx..) GainCRISIL is showing a rounding bottom Breakout with good amount of Volume... This breakout has come after a long 19 week consolidation . fundamental is also very nice. ROE & ROCE also very nice. Operating Profit is in increasing order. But I am interested in its share holding pattern. DII and FII are increasing.
check the below link ( www.screener.in )
CMP : 4195
TG : 4830++
SL : Below 21 Daily EMA
Stock's selection based on 5 Point Analysis:
1: Idea : Breakout.
2: Support : Volume, Delivery & VWAP. ( To view this, click sedg.in )
3: Technical : 9/21/55/200-EMA, RS>0, MACD, RSI & Super trend up. ( To view this, click sedg.in )
4: Fundamental : PE, PAT, Industry & peer PE and sector performance. ( www.screener.in )
5: Timing : Entry Timing on 2 hour chart.
Disclaimer : It is my personal view as a trader and for educational purpose only. Equity market involves risk .
Please consult your financial adviser before taking any decision.

CRISIL - FROM 3500 TO 4450 NOW AGAIN READY FOR LONG ENTRYCRISIL AGAIN READY FOR LONG. HERE BELOW THE ANALYSIS :-
Volume:
Volume is greater than previous session by 233.06%.
Volatility:
ATR% of the stock is 3.49%
Moving Average Observations:
Price above 50-day, 100-day and 200-day Moving average.
Moving average alignment is bullish. It is an uptrend & a bullish setup.
RSI Observations:
The Daily RSI indicator has remained above 50. This is a bullish zone. Current Daily RSI reading is 57.81.
ADX Observations:
The Daily DMI position remains bullish.
The Daily ADX is above 20 that indicates strong trend. DMI Trend is bullish.
Donchian Channel Observations:
Price is above middle Donchian channel (Bullish).
Ichimoku Observations:
Price above Ichimoku clouds.
Clouds are bullish.
Bollinger Band Observations:
Price is above middle Bollinger band (Bullish).
Both bands are rising. It is a bullish setup.
WEAK BELOW 4115

CRISIL | Swing Trade📊 Details
CRISIL Ltd is a globally diversified analytical Company providing ratings, research, risk and policy advisory services. CRISIL is India’s leading ratings agency and the foremost provider of high-end research to large banks and leading corporations.
Disclaimer: This analysis is solely for educational purposes and does not make me a SEBI registered analyst.
If you found this analysis helpful, I encourage you to like and share it. Your observations and comments are also welcomed below. Your support, likes, follows, and comments motivate me to consistently share valuable insights with you.
🔍 More Analysis & Trade Setups 🔍
For more technical analysis and trade setups, make sure to follow me on TradingView: www.tradingview.com

CRISIL, Weekly BreakoutNSE:CRISIL gave breakout after consolidation above it previous highs in May, 2022.
Entry : 4200
Target : 5000
SL(Weekly Closing Basis) : 3750
RR : 1.8

Is CRISIL out of CRISIS ? Company has reduced debt.
Company is almost debt free.
Company has a good return on equity (ROE) track record: 3 Years ROE 30.4%
Company has been maintaining a healthy dividend payout of 67.2%
CRISIL Ltd is a globally diversified analytical Company providing ratings, research, risk and policy advisory services. CRISIL is India’s leading ratings agency and the foremost provider of high-end research to large banks and leading corporations.

BULLISH IDEA📈 Exciting Bullish Pattern Alert! 🐂
📊 Pattern: Expanding Wedge, Cup and Handle, inverted head & shoulder
📌 Symbol/Asset: CRISIL
🔍 Description: Stock with three bullish patterns.
👉 Remember: Technical patterns are just one piece of the puzzle. Consider conducting further research, consulting with a financial advisor, and managing your risks appropriately.

Crisil can do well from hereCrisil is in range from 7th jun, its consolidate breakout is on..looks like darvas breakout..keep on radar


CRISIL - DAILY TIME FRAME - CUP N HANDLECRISIL on daily time frame ready for CUP n Handle pattern.
3500 is important level to watch.

Crisil Ltd trend analysisBullish for short term.
Refer the support and resistance line for details.
Above 3075 looks strong. Trading View technical indicators are showing buy signal.
Only for educational purpose.
Target will be resistance line.

WAVE STUDY AND INDICATOR CONFIRMATIONCRISIL seems to have completed the correction at least for a shorter term. Wave counting is clearly mentioned on the chart. I request you not to get confused with Wave 2 as it is lower than the initiation point of Wave 1 but visible in Candlestick Chart. As the correction of Wave 2 have been really sharp ie. It was completed in 8 Days with 609 Points of Up move, that is why the Wave 4 is Sideways ie. It was completed in 64 Days with 438 Points of up move.
Wave 1 , 3 & 5 are in Fibonacci Time zone sequence. Wave 1 has taken approximately 13 days for completion, where as Wave 3 has taken 32 days and Wave 5 has taken 105 days. If the mathematics is done the ratio stands to be at 1:2:3 Approximately. Hence it is a well structured wave. Wave 5 for downside seems completed now. It comprises of 5 minor waves and the end is a Truncated Wave. Where the bottom of Wave (iii) & Wave (V) of Wave 5th are same .Explaining the reasons for the truncation will take longer, so let’s skip the theory.
Few key indicators that we should focus on are ROC, RSI & Candlestick Pattern .
ROC: ROC (21 Days, Close) has breached the EMA ( 21 Days, ROC) during the formation of the bottom of Wave (iii) of Wave 5th but has taken a good support over EMA ( 21 Days, ROC) during the formation of the bottom of Wave (V) of Wave 5th. This is a sign of bullishness that cannot be ignored.
RSI: RSI (14 Days, Close) on 9th Nov at the bottom of Wave (iii) of Wave 5th was 28.25 and on 7th Dec at the bottom of Wave (V) of Wave 5th the RSI (14 Days, Close) was 31. Hence such pattern is called Exaggerated Divergence as the bottom of Wave (iii) & Wave (V) of Wave 5th are same but in RSI a higher low is formed.
Candlestick Pattern: An upside reversal is better marked with a close above previous day high and a low above previous day low. Of course this happened on 8th Dec and last time when the same happened was on 10th Nov during initiation of Wave (iv) of Wave 5th .
If we take a conservative approach the first expected target should be 3138 as per Fibonacci Retracement basis. SL should be below 2800 on closing basis.
CHART & ANALYSIS
ADARSH DEY

Crisil weekly trend analysisCrisil weekly trend analysis.
> Falling wedge breakout
> 7 months downtrend break on weekly timeframe. (From may 2022)
> Size of the pattern is 890 rs.
> Forming an Inverted H&S Which is bullish pattern.
> Entry break and trade above 3100.
> Potential targets 3223,3424,3626,3840.
> keep will be 7-10% below entry price.
> position size : 10-20% of the trading capital.
> max risk : 1-2% of trading capital.
> time : 1-6 months.
> Happy swing/positional trading.
Note: only for educational purpose, trade at your own risk.

CRISIL - Swing TradeCRISIL
Reversing from strong trendline
support with good volumes.
A good RR ratio trade ;)

CRISIL - Ascending triangle patternChart is self explanatory, wait for the breakout and follow SL. When Stock is moving higher trail with a decent SL


CRISIL Looking bullish above 2935CRISIL Looking bullish above 2935 will touch 3000-3100-3200 in coming days
