SOLANA AT FIVE: The High-Speed Blockchain Revolutionizing Crypto📢 SOLANA AT FIVE: The High-Speed Blockchain Revolutionizing Crypto Transactions
What is Solana?
#Solana is a high-performance blockchain designed for speed, scalability, and ultra-low fees. It supports DeFi, NFTs, and Web3 applications with an impressive 65,000 transactions per second (TPS) at almost zero cost!
📌 Founded by: Anatoly Yakovenko
📌 Launched in: March 2020
📌 Market Position: Among the Top 10 Crypto's
Top 3 Highlights of Solana
✅ Ultra-Fast Transactions: Solana’s unique PoH + PoS hybrid model enoS hybrid model ensures high-speed processing.
✅ Low Transaction Fees: Sub-penny costs make it more affordable than Ethereum.
✅ Growing Ecosystem: Used in DeFi, NFT marketplaces, and GameFi, attracting global investors and developers.
How Does Solana Work?
🔹 Proof of History (PoH): A cryptographic clock that timestamps transactions, reducing validation time.
🔹 Delegated Proof of Stake (dPoS): Users stake SOL tokens to secure the network and earn rewards.
🔹 Sealevel: Allows parallel smart contract execallel smart contract execution for improved efficiency.
🔹 Turbine & Gulf Stream: Optimized data transfer and transaction propagation.
Why Use Solana?
✔ Speed: 65,000 TPS vs. Ethereum’s 15 TPS
✔ Low Fees: $0.00025 per transaction
✔ Scalability: No need for Layer-2 solutions like Polygon or Arbitrum
✔ Eco-Friendly: Energy-efficient blockchain
✔ Developer-Friendly: Supports Rust & C++ SDKs
Solana vs Ethereum – Key Differences
▶️Feature | Solana | Ethereum
▶️TPS (Speed) | 65,000+ | ~15
▶️Transaction Fees | <$0.01 | $5-$50
▶️Consensus Mechanism | PoH + dPoS | PoS
▶️Smart Contracts | Rust, C++ | Solidity
▶️Scalability | Built-in (No L2 required) | Requires Layer-2
#Ethereum dominates DeFi & NFTs, but Soires Layer-2Ethereum dominates DeFi & NFTs, but Solana’s high-speed, low-cost model is attracting new projects & users.
Key Use Cases of Solana
🔹 Decentralized Finance (DeFi): Used in Serum, Raydium, Mango Markets
🔹 NFTs & Gaming: Magic Eden, Solanart, Star Atlas, Aurory leverage Solana’s low-cost transactions.
🔹 Smart Contracts & Web3: DAOs, Social Networks, Tokenization projects.
🔹 Crypto Payments: Solana Pay enableay enables instant, fee-less USDC payments, compe comp payments, competing with Visa.
Challenges of the Solana Network
⛔ Network Outages: Several disruptions in 2021-2024 raised concerns.
⛔ Centralization Risks: Fewer validators make it less decentralized than Ethereum.
⛔ Security Issues: Past incidents like the 2022 wallet exploit highlighted risks.
✅ Solution: Firedancer Client Upgrade is expected to enhance network stability.
Solana’s Recent Milestones & Price Performance
📌 2021: SOL hit $260 ATH in the bull run.
📌 2022: Dropped to $9 after FTX collapse.
📌 2023: Massive 1000% rebound, surpassing $100 again.
📌 2024: From $80 to $264 in one year. Visa integrates Solana for stablecoin payments.
📌 2025: New ATH of $295.83, then correction to $110. Over 105M active monthly users in January.
Is Solana a Good Investment?
✅ Pros:
✔ Strong Technical Foundation (PoH + PoS scal Foundation (PoH + PoS scalability)
✔ Growing Adoption & Developer Interest
✔ Institutional Support (Visa, Google Cloud)
✔Support (Visa, Google Cloud)
✔ Active & Expanding Community
❌ Cons:
⚠ Regulatory Uncertainty
⚠ Past Network Downtime Issues
⚠ Strong Competition from Ethereum & Other L1s
📢 Always do your own research before investing in any cryptocurrency.
Final Thoughts – The Future of Solana continues to push the boundaries of blockchain scalability with its ultra-fast transactions and low fees. With growing institutional adoption and ecosystem expansion, CRYPTOCAP:SOL has the potential to compete with Ethereum and beyond.
Crypto

Ethereum Accumulation Alert! 🚀 Ethereum Accumulation Alert! 🔥
Ethereum is entering a potential spring accumulation zone, presenting a solid long-term opportunity.
📉 Buy Zone: $1,900 – $1,550
🎯 Targets: $5,000 / $7,500 / $10,000
🔹 Key Support: $1,550 – Holding above this level keeps the bullish structure intact.
🔹 Breakdown Risk: If ETH loses $1,550, expect further downside toward sub-$1,000, where the next strong entry lies.
📊 Smart money is accumulating—don’t miss the dip!
#Ethereum #CryptoTrading #Accumulation #ETH #NFA #DYOR

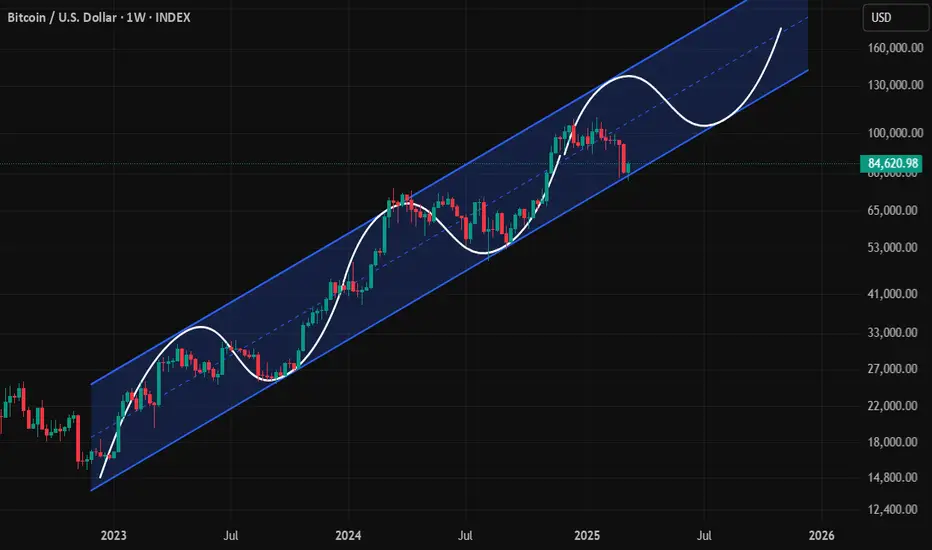
We might be facing some extremely big volatilityI've been sharing my method of tracking the crypto market through BTC uptrend channel that's been in place since late 2022. While it might seem rudimentary, I still believe it's worthwhile and continues to provide reliable signals.
Here's what I'd like to point out regarding the current volatility:
1. Good news: BTC price is still within its linear uptrend channel and receiving pretty solid support, today BTC price increase is proof of that. This allows us to continue observing the market with confidence and expect a new ATH.
2. Bad news: BTC is no longer fluctuating normally like it did in the previous 2 years. If it were fluctuating normally, BTC should be at a $140K peak right now instead of re-accumulating in the $80K price zone. This phase reversal could be an early signal of a trend reversal before we see BTC price in the 6x or 5x price zone.
So, what's gonna happen? I don't know, I can't say for sure. I can only point out 2 scenarios I'll be watching for confirmation:
1. Positive scenario: BTC price will surge to $140K in the short term to make up for the growth delay.
2. BTC price will fall out of the uptrend channel and plunge the whole market into chaos, similar to the May 2021 event, before recovering to the $150K-170K zone by year-end. I'm not hoping for this, I prefer stability and altseason having a chance to explode mid-year.
Anyway, we've got to be prepared for anything. At least, I have a few criteria like that to keep an eye on and act when needed.
BTC USD Trading & Investing [Status Update --- Not an Advise]BTC USD Trading & Investing
We get into the current status and take a look at what is happening in the Crypto world, especially BTC coin.
Checked on Weekly and Daily.

Raoul Pal’s Investment Edge: The Art of Predicting Market ShiftHello Traders! First of all, no, this is not about me! 😆 I am Rahul Pal , and this is about Raoul Pal , the legendary macro investor! But don’t worry— my time will come too! Until then, let’s take this opportunity to learn from one of the best in the game and explore his key investment principles and strategies that have made him a market icon.
Raoul Pal is not just another investor—he is a master of macro trends who has successfully predicted major shifts in financial markets, global liquidity cycles, and the rise of digital assets. From his early bets on Bitcoin and Ethereum to his deep understanding of monetary policies and their impact on financial markets , his approach has helped thousands of traders and investors navigate volatile conditions and stay ahead of the curve.
So, let’s break down his top investing lessons and see how we can apply them to build wealth, manage risks, and seize big market opportunities!
Raoul Pal’s Key Investment Strategies
Macro Investing Approach – Pal focuses on big-picture economic trends, analyzing global debt cycles, interest rates, and monetary policies to predict major market movements.
Early Crypto Adoption – He was one of the early institutional investors to bet big on Bitcoin and Ethereum, predicting their rise as alternative financial systems.
Liquidity Matters More Than Fundamentals – Pal believes that liquidity in financial markets drives asset prices more than just company fundamentals.
Bet on Big Trends Early – He identified major shifts in technology, crypto, and decentralized finance (DeFi) before mainstream adoption.
Understanding Market Cycles – He studies boom-and-bust cycles to anticipate major economic shifts and position himself accordingly.
Diversification with a Focus on Asymmetry – Pal emphasizes investments with high potential upside and limited downside risks, such as Bitcoin and tech stocks.
Raoul Pal’s Bold Market Predictions
Bitcoin to Reach $1M? – Pal has predicted massive upside potential for Bitcoin, citing global money printing and institutional adoption.
The Rise of Digital Assets – He believes that crypto, NFTs, and tokenized assets will be a major part of the financial future.
US Dollar Liquidity Crisis – Pal has warned about potential economic instability caused by excessive debt and monetary easing.
What Traders Can Learn from Raoul Pal
Follow the Macro Trends – Pay attention to global interest rates, central bank policies, and economic cycles to position yourself ahead of big moves.
Be Open to New Asset Classes – Consider crypto, technology, and emerging financial innovations for long-term wealth creation.
Risk Management is Key – Even with bold predictions, Pal manages risk and focuses on asymmetrical returns.
Adopt a Long-Term Perspective – Major trends don’t happen overnight, so patience is crucial when investing in macro shifts.
Conclusion
Raoul Pal’s macro investing strategies provide valuable insights into navigating global markets, identifying emerging trends, and managing risk effectively. His focus on big-picture thinking has helped him stay ahead of market shifts, making him a legend in the world of investing.
Do you follow macro trends in your trading? Let me know in the comments! 👇

BTC/USD TECHNICAL ANALYSIS – WHAT’S NEXT?📌 Timeframe: 2H
BTC/USD is currently trading within a symmetrical triangle pattern, signaling a phase of accumulation before a potential major breakout.
📈 TREND ANALYSIS & KEY PRICE LEVELS
1️⃣ Current Trend
BTC is trading around $86,301, moving within a narrowing price channel.
Price is caught between the ascending trendline support and the key resistance zone at $90,000 - $92,000.
A breakout above this zone could trigger a strong bullish move towards $98,000+.
Conversely, a failure to hold support may push BTC down to $82,764, with further downside potential towards $78,000 - $80,000.
2️⃣ Key Levels to Watch
🔺 Major Resistance Levels:
$90,000 - $92,000: Strong resistance; a breakout here could lead to a rally.
$98,000: The next target if BTC successfully breaks above resistance.
🔻 Major Support Levels:
$82,764: Closest support; a breakdown could trigger further downside.
$78,000 - $80,000: A strong demand zone that could provide a solid bounce if BTC dips further.
📉 POTENTIAL TRADING SCENARIOS
📌 Scenario 1 – Bullish Breakout 🟢
If BTC breaks above $90,000 - $92,000, it could confirm a bullish trend continuation toward $98,000+.
Watch for strong volume confirmation and a clear close above resistance.
📌 Scenario 2 – Bearish Rejection 🔴
If BTC fails to break $90,000 - $92,000, it could retrace to $82,764.
A further break below this level could send BTC down to $78,000 - $80,000 before finding strong support.
⏳ CONCLUSION – PREPARE FOR A BIG MOVE!
📊 BTC is in a critical accumulation phase, setting up for a major breakout soon.
📈 If BTC clears $90,000 resistance, the bullish trend will likely continue toward $98,000+.
📉 If BTC rejects and drops below $82,764, a deeper correction to $78,000 is possible.
⚠ Traders should wait for a clear breakout signal & manage risk carefully ahead of the big move!
📢 Do you think BTC will break out or correct further? Share your thoughts below! 🚀🔥

DOGE/USDT – Prime Accumulation Zone & Bullish OutlookDOGE/USDT – Prime Accumulation Zone & Bullish Outlook 🚀
Current Status : Trading at $0.15-$0.20 support zone, a strong accumulation area. DOGE is currently 64% down from its ATH, presenting an attractive risk-reward setup.
Key Levels:
Support: $0.15 - $0.20 (Accumulation Zone)
Targets: $0.60 / $1.50 / $2 / $2.50
Why Bullish?
Technical Perspective: DOGE is holding key support and could see a breakout on volume expansion.
Catalyst: Elon Musk’s continued backing makes it a strong contender for long-term gains.
Strategy: Any major dip is a buying opportunity for long-term holders. Keep an eye on volume surges and market sentiment!
Note: NFA & DYOR

Bitcoin Ready for $69000 ?#Bitcoin followed my chart PERFECTLY! 🚀🎯
I warned you, but some laughed. Who’s laughing now? 😏
From $108K to $79K—NEXT STOP: $75K-$70K (prime accumulation zone!) 🔥
Who’s buying this dip? 🤔👇

SOL Long OpportunityMarket Context:
SOL has seen a significant drop in recent weeks but has now entered a key support zone. This could present a potential bounce to test the next resistance levels.
Trade Details:
Entry Zone: $132 - $144
Take Profit Targets:
$168
$195
Stop Loss: Just below $130
This setup aims to capture a potential recovery as SOL stabilizes at support and looks for upside continuation. 🔥

BTCUSDT retracing back from the first fall legToday we witnessed a substantial fall in BTCUSDT as it broke down and sustained below the 15 Min 200 EMA, currently the price is retracing back and it is highly likely to retrace back to the 50% fib levels before we see any further fall in its price.

What is the role of timeframes in trading?A general rule is that the longer the time frame, the more reliable the signals being given. As you drill down in time frames, the charts become more polluted with false moves and noise. Ideally, traders should use a longer time frame to define the primary trend of whatever they are trading
The 5-3-1 strategy is especially helpful for new traders who may be overwhelmed by the dozens of currency pairs available and the 24-7 nature of the market. The numbers five, three, and one stand for: Five currency pairs to learn and trade. Three strategies to become an expert on and use with your trades.

how to do analysis of banknifty?Check Bank Nifty's average daily movement by tracking historical volatility, examining daily price changes, and considering derivative indicators such as option open interest, call/put ratios, and cost-of-carry movements
Technical indicators are key to analysing Bank Nifty movements. Investors can keep an eye on moving averages, option activity, and PCR to analyse Bank Nifty movements. High put-call ratios or short build-up may be signs of a bearish trend, while positive derivative indicators may signal a bullish trend.
To predict the trend of Bank Nifty, traders often combine indicators like Moving Averages, MACD, and RSI. Analysing these indicators together provides insights into potential trend directions.

How to use Option-Chain in stock market???An option chain has two sections: calls and puts. A call option gives the right to buy a stock while a put gives the right to sell a stock. The price of an options contract is called the premium, which is the upfront fee that an investor pays for purchasing the option.An option chain has two sections: calls and puts. A call option gives the right to buy a stock while a put gives the right to sell a stock. The price of an options contract is called the premium, which is the upfront fee that an investor pays for purchasing the option.

Schneider Electric Infrastructure Ltd.#schneider double bottom pattern formed
target - 800 £
entry - 630 £
stop loss - 590 £
time frame - 2 months
technicals - bullish
this is not any financial advise

Tata consumer products ltdTata Consumer Products Ltd. has an average target of 1152.17. The consensus estimate represents an upside of 12.83% from the last price of 1021.20. View 22 reports from 7 analysts offering long-term price targets for Tata Consumer Products Ltd..
For the quarter, Revenue from operations grew by 9% (8% in constant currency) as compared to corresponding quarter of the previous year, with strong performance in India business, which grew 10%. Profit before exceptional items and tax at Rs 509 Crores is higher by12%.

EPL Ltd# Swing Trade Alert
# Stock Name - EPL
# CUP Break out possible and stock moving to previous support
# sustain above 250 will go for buy
EPL Limited (formerly Essel Propack Limited) is a global tube-packaging company owned by The Blackstone Group headquartered in Mumbai. It is a specialty packaging manufacturer of laminated plastic tubes for the FMCG and Pharma space.

How to use RSI in technical analysis ???To use the RSI indicator, check if the value is above 70 to show an asset is overbought, or below 30 to show it is oversold. Traders can use these signals to find possible trading opportunities.
Low RSI levels, typically below 30 (red line), indicate oversold conditions—generating a potential buy signal. Conversely, high RSI levels, typically above 70 (green line), indicate overbought conditions—generating a potential sell signal
Successful trades often occur when the RSI crosses above 30 (indicating a buy signal) or below 70 (indicating a sell signal). Adjusting the RSI period to 9 can make it more sensitive to price changes and be suitable for more active trading strategies

Tech Mahindra Ltd.#TECHM on a breakout.
Entry: 1160
SL: 1120
Target: 1315/ 1425/1570/1700/1800
Check BIO for any help.
Comment stocks below for review.
Happy Trading!!!
Tech Mahindra is forecast to grow earnings and revenue by 23.9% and 7.7% per annum respectively. EPS is expected to grow by 23.8% per annum. Return on equity is forecast to be 29.3% in 3 years

UltraTech Cement Ltd."#ULTRACEMCO - Building Up Strength!
Entry: 11600
Stop-Loss: 11300
Target: 12000
Support solid as concrete-next stop, sky!
UltraTech Cement Ltd. has an average target of 12000.The consensus estimate represents an upside of 9.46% from the last price of 11640.60. View 43 reports from 12 analysts offering long-term price targets for UltraTech Cement Ltd..

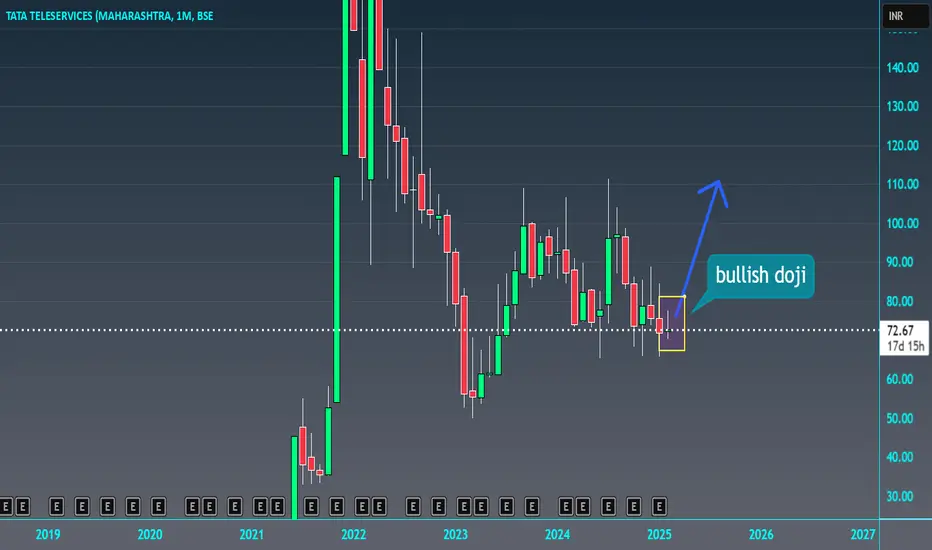
Tata Teleservices (Maharashtra) Ltd#TTML PERFECT REVERSAL CANDIDATE
TARGET - 82
ENTRY - 72
STOP LOSS - 70
TIME FRAME - MONTHLY
TECHNICALS - BULLISH DOJI CANDLE FORMED
THIS IS NOT ANY FINANCIAL ADVISE
As on 7th Feb 2025 TTML SHARE Price closed @ 72.04 and we RECOMMEND Strong Sell for LONG-TERM with Stoploss of 80.87 & Sell for SHORT-TERM with Stoploss of 76.08 we also expect STOCK to react on Following IMPORTANT LEVELS.
Mahamaya Steel Industries Ltd#MAHASTEEL
Daily chart..
Resistance at 225
Support at 180
Keep on Radar..
Shri Ramanand Agrawal
The Company has been promoted by Shri Ramanand Agrawal and his family members. Agrawal family is a well-known industrialist family from Raipur. The Company came out with a public issue in the year 1994 which was oversubscribed. MSIL is a profit making and dividend paying Company.

Transrail Lighting Limited#TRANSRAILL Buy near IPO price and hold it for 1:2.5 Profit.
Entry: 605
SL: 565
Target: 700
Check BIO for any help.
Comment stocks for review below.
Happy Trading!!!
Transrail Lighting IPO represents an opportunity to invest in a well-established company with robust financials, a diverse service portfolio, and a strong presence in a high-growth sector. Its strategic expansion plans and proven operational efficiency position it as a strong contender for long-term growth

Gulf Oil Lubricants India Ltd#GULFOILLUB
Daily chart..
Resistance at 1270
Support at 950
Keep an eye on it..
Market cap: $0.65 Billion USD
As of February 2025 Gulf Oil Lubricants has a market cap of $0.65 Billion USD. This makes Gulf Oil Lubricants the world's 6383th most valuable company by market cap according to our data.
OIL's Net Zero commitment encompasses a range of initiatives, including adopting cleaner energy sources, investing in renewable energy projects and implementing advanced technologies to minimize greenhouse gas emissions for which about Rs. 25,000 Cr is envisaged to be invested by 2040.
