EPL Ltd# Swing Trade Alert
# Stock Name - EPL
# CUP Break out possible and stock moving to previous support
# sustain above 250 will go for buy
EPL Limited (formerly Essel Propack Limited) is a global tube-packaging company owned by The Blackstone Group headquartered in Mumbai. It is a specialty packaging manufacturer of laminated plastic tubes for the FMCG and Pharma space.
Crypto

How to use RSI in technical analysis ???To use the RSI indicator, check if the value is above 70 to show an asset is overbought, or below 30 to show it is oversold. Traders can use these signals to find possible trading opportunities.
Low RSI levels, typically below 30 (red line), indicate oversold conditions—generating a potential buy signal. Conversely, high RSI levels, typically above 70 (green line), indicate overbought conditions—generating a potential sell signal
Successful trades often occur when the RSI crosses above 30 (indicating a buy signal) or below 70 (indicating a sell signal). Adjusting the RSI period to 9 can make it more sensitive to price changes and be suitable for more active trading strategies

Tech Mahindra Ltd.#TECHM on a breakout.
Entry: 1160
SL: 1120
Target: 1315/ 1425/1570/1700/1800
Check BIO for any help.
Comment stocks below for review.
Happy Trading!!!
Tech Mahindra is forecast to grow earnings and revenue by 23.9% and 7.7% per annum respectively. EPS is expected to grow by 23.8% per annum. Return on equity is forecast to be 29.3% in 3 years

UltraTech Cement Ltd."#ULTRACEMCO - Building Up Strength!
Entry: 11600
Stop-Loss: 11300
Target: 12000
Support solid as concrete-next stop, sky!
UltraTech Cement Ltd. has an average target of 12000.The consensus estimate represents an upside of 9.46% from the last price of 11640.60. View 43 reports from 12 analysts offering long-term price targets for UltraTech Cement Ltd..

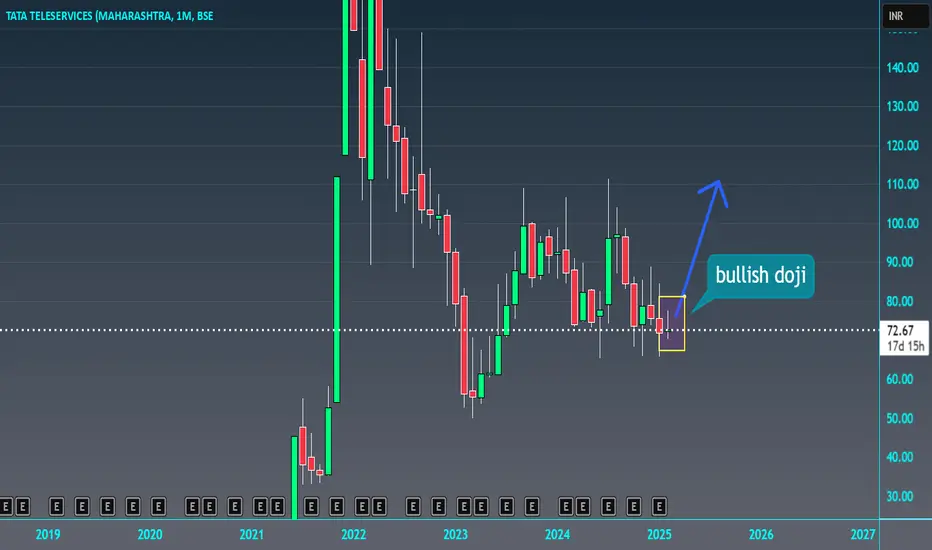
Tata Teleservices (Maharashtra) Ltd#TTML PERFECT REVERSAL CANDIDATE
TARGET - 82
ENTRY - 72
STOP LOSS - 70
TIME FRAME - MONTHLY
TECHNICALS - BULLISH DOJI CANDLE FORMED
THIS IS NOT ANY FINANCIAL ADVISE
As on 7th Feb 2025 TTML SHARE Price closed @ 72.04 and we RECOMMEND Strong Sell for LONG-TERM with Stoploss of 80.87 & Sell for SHORT-TERM with Stoploss of 76.08 we also expect STOCK to react on Following IMPORTANT LEVELS.
Mahamaya Steel Industries Ltd#MAHASTEEL
Daily chart..
Resistance at 225
Support at 180
Keep on Radar..
Shri Ramanand Agrawal
The Company has been promoted by Shri Ramanand Agrawal and his family members. Agrawal family is a well-known industrialist family from Raipur. The Company came out with a public issue in the year 1994 which was oversubscribed. MSIL is a profit making and dividend paying Company.

Transrail Lighting Limited#TRANSRAILL Buy near IPO price and hold it for 1:2.5 Profit.
Entry: 605
SL: 565
Target: 700
Check BIO for any help.
Comment stocks for review below.
Happy Trading!!!
Transrail Lighting IPO represents an opportunity to invest in a well-established company with robust financials, a diverse service portfolio, and a strong presence in a high-growth sector. Its strategic expansion plans and proven operational efficiency position it as a strong contender for long-term growth

Gulf Oil Lubricants India Ltd#GULFOILLUB
Daily chart..
Resistance at 1270
Support at 950
Keep an eye on it..
Market cap: $0.65 Billion USD
As of February 2025 Gulf Oil Lubricants has a market cap of $0.65 Billion USD. This makes Gulf Oil Lubricants the world's 6383th most valuable company by market cap according to our data.
OIL's Net Zero commitment encompasses a range of initiatives, including adopting cleaner energy sources, investing in renewable energy projects and implementing advanced technologies to minimize greenhouse gas emissions for which about Rs. 25,000 Cr is envisaged to be invested by 2040.

#TATA Consumer ltdTata Consumer
Structure break+ trend continuation are the sign of bullish reversal.
Perfect chart
1107/1234
Im waiting for entry point
as of February 6, 2025, Tata Consumer Products Limited (TATACONSUM) is trading at ₹1,069.85.
echnical indicators suggest a bullish trend for the stock.nalysts have set a median target price of ₹1,190.32 over the next 12 months, indicating potential upside.citeturn0search3
he company has demonstrated consistent financial performance, with a consolidated total income of ₹4,495.16 crore for the quarter ending December 31, 2024, reflecting a 5.51% increase from the previous quarter and a 16.35% rise compared to the same quarter the previous year.
given these factors, the stock's outlook appears positive.
*Please note that this information is for educational purposes only and should not be considered financial advice. Always consult with a qualified financial advisor before making investment decisions.*

How to draw support and resistance?Drawing **support and resistance** levels is a key aspect of technical analysis. These levels represent areas where the price tends to reverse or stall, providing key insights into market behavior. Here's how to draw them in brief:
### 1. **Support**
- **Definition**: A price level where a downtrend is expected to pause or reverse as demand increases. It's the floor of the price action.
- **How to Draw**:
- Look for areas where the price has bounced higher multiple times in the past. These are points where buyers have stepped in.
- Draw a horizontal line at the lowest price points in these areas.
- Strong support is confirmed when the price touches the same level multiple times without breaking it.
### 2. **Resistance**
- **Definition**: A price level where an uptrend is expected to pause or reverse as selling pressure increases. It's the ceiling of the price action.
- **How to Draw**:
- Identify areas where the price has consistently faced downward pressure or reversed. This is where sellers have entered the market.
- Draw a horizontal line at the highest price points in these areas.
- Strong resistance is confirmed when the price fails to break above it multiple times.
### 3. **Key Points to Remember**
- **Multiple Touches**: The more times the price touches a level without breaking through, the stronger the support or resistance.
- **Broken Levels**: Once a support level is broken, it often becomes resistance (and vice versa).
- **Use Trendlines**: In addition to horizontal levels, you can also draw diagonal trendlines to connect higher lows (support) or lower highs (resistance) in trending markets.
These levels help traders anticipate potential price reversals or continuations, making them essential for developing trading strategies.

How to do Database Trading Part 5 ?Database trading, often referred to as *algorithmic trading* or *quantitative trading*, involves using computer algorithms to make automated trading decisions based on a large amount of data. This type of trading is heavily reliant on databases to store, analyze, and retrieve historical data, trading signals, market conditions, and other relevant information for decision-making. Here's a step-by-step breakdown of how to get started:
### 1. **Understand the Basics of Trading**
Before diving into database trading, you should have a good understanding of:
- **Financial Markets:** Understanding how different markets (stocks, forex, crypto, etc.) work.
- **Trading Strategies:** Familiarize yourself with common strategies like trend following, mean reversion, or arbitrage.
- **Technical Indicators:** Learn how technical analysis indicators (moving averages, RSI, MACD) can be used to generate trading signals.
### 2. **Learn About Algorithmic Trading**
- **Quantitative Analysis:** Database trading relies on quantitative analysis, where you analyze large amounts of historical data to find patterns, trends, and correlations that can guide decision-making.
- **Programming Skills:** Most algorithmic trading is done using programming languages such as Python, C++, or Java. Python is especially popular because of its data science libraries (like Pandas, NumPy, and Scikit-learn) and ease of use.
- **Backtesting:** Backtesting is a crucial part of database trading, where you test your algorithm on historical data to see how it would have performed in the past.
### 3. **Setting Up a Database**
- **Data Collection:** You'll need access to a database of historical market data (price, volume, order book, etc.). Common sources include Yahoo Finance, Alpha Vantage, Quandl, or APIs from brokers like Interactive Brokers or Alpaca.
- **Database Management Systems (DBMS):** You can store your data in relational databases like MySQL, PostgreSQL, or use NoSQL databases like MongoDB. It's essential that your database can handle large volumes of data quickly, especially if you're processing real-time data.
- **Data Types:** Store various data types like:
- **Historical Market Data:** This includes open, high, low, close prices, and volume for the assets you wish to trade.
- **Economic Indicators:** Things like interest rates, GDP growth, unemployment rate, etc.
- **Alternative Data:** News sentiment, social media analysis, etc.
### 4. **Data Processing and Analysis**
- **Preprocessing Data:** Clean and organize your data. This step might involve dealing with missing values, outliers, and adjusting for corporate actions (like stock splits).
- **Feature Engineering:** Extract useful features from the raw data that will be used in your trading model. For example, moving averages, RSI, or volatility can be used as features to generate signals.
- **Modeling:** Use statistical or machine learning models to analyze the data and predict future price movements or trends. Common techniques include:
- **Time Series Analysis:** ARIMA, GARCH, etc.
- **Machine Learning:** Linear regression, decision trees, neural networks, etc.
### 5. **Developing the Trading Algorithm**
- **Algorithm Design:** Based on your data and models, design an algorithm that automatically generates trading signals. This might be a simple rule-based system (e.g., buy if the price crosses above the moving average) or a more complex machine learning model.
- **Execution Logic:** Design how your algorithm will execute trades. Some systems are direct market access (DMA), while others might use broker APIs to place orders on the market.
- **Risk Management:** Incorporate risk management techniques like stop-loss, take-profit, and position sizing to protect your portfolio.
### 6. **Backtesting**
- **Simulate Trades:** Before you go live, run your algorithm against historical data to evaluate its performance. Backtesting should be done on out-of-sample data to get a more realistic picture of how the strategy might perform.
- **Metrics:** Use performance metrics such as Sharpe Ratio, Maximum Drawdown, and Win Rate to evaluate the quality of your strategy.
### 7. **Paper Trading**
- **Paper Trading:** This involves running your algorithm on live data, but without real money. It's a crucial step to ensure the algorithm works correctly in a real-time environment and that it can handle market slippage, transaction costs, etc.
### 8. **Deploying to Live Trading**
- **Execution Platform:** Once you're confident your algorithm works, deploy it to a trading platform that supports algorithmic trading. Popular platforms include Interactive Brokers, MetaTrader, QuantConnect, and Alpaca.
- **Monitoring:** Even though the algorithm trades automatically, you must still monitor its performance and intervene in case of unexpected market conditions or errors in the system.
### 9. **Optimization and Maintenance**
- **Continuous Improvement:** Constantly optimize your trading algorithm by refining your model, adjusting risk management rules, and adapting to market changes.
- **Real-time Data:** Stay on top of real-time data and news. For instance, changes in interest rates or earnings reports can heavily impact financial markets.
- **System Maintenance:** Ensure that your database and trading systems are running smoothly, handling failures, and scaling with large amounts of data.
### Tools and Resources:
- **Trading Platforms:** Interactive Brokers, MetaTrader, Alpaca, Tradestation.
- **Data Providers:** Alpha Vantage, Quandl, Yahoo Finance, FRED.
- **Programming Languages:** Python (Pandas, NumPy, scikit-learn, TensorFlow), C++, Java.
- **Databases:** MySQL, PostgreSQL, MongoDB.
- **Backtesting Tools:** Backtrader, Zipline, QuantConnect.
### Key Considerations:
- **Market Risk:** Even the best algorithms can’t predict every market movement. There’s always inherent risk.
- **Data Quality:** Bad data can lead to poor trading outcomes. Ensure your data is clean and accurate.
- **Latency:** In high-frequency trading, speed matters. Having low-latency systems and database access is crucial.

Technical analysis part 1Technical analysis is a means of examining and predicting price movements in the financial markets, by using historical price charts and market statistics. It is based on the idea that if a trader can identify previous market patterns, they can form a fairly accurate prediction of future price trajectories.
Some traders follow something called the "10 a.m. rule." The stock market opens for trading at 9:30 a.m., and there's often a lot of trading between 9:30 a.m. and 10 a.m. Traders that follow the 10 a.m. rule think a stock's price trajectory is relatively set for the day by the end of that half-hour.
How to perform technical analysis
Identifying the trend. This is the first step in technical analysis for traders because trading strategies can either follow the trend or go against the trend. ...
Drawing support and resistance levels. ...
Establishing entry and exit points. ...
Position sizing and risk management.

Use of RSI in Advance TradingRSI values are typically used to identify overbought and oversold conditions. A reading above 70 suggests that the asset may be overbought and could be due for a downward correction. On the other hand, a reading below 30 indicates that the asset may be oversold, signalling a potential upward reversal.
The best RSI settings are typically a 14-period timeframe with 70 as the overbought level and 30 as the oversold level. These settings can be adjusted based on specific trading strategies.
The RSI provides technical traders with signals about bullish and bearish price momentum, and is often plotted below the graph of an asset's price. An asset is usually considered overbought when the RSI is above 70 and oversold when it is below 30.

Option Chain AnalysisOption chain analysis is the process of evaluating the information provided in the option chain to identify potential trading opportunities. Traders use option chain analysis to evaluate the market's expectations of an asset's future price movements and make informed decisions about their investments.
OI stands for Open Interest, which is the total number of outstanding option contracts that have not yet been settled. OI helps to gauge market trends and shows how many options contracts are still open. Higher open interest generally indicates higher liquidity and market activity for that contract.
Use Graphs and Charts: You can plot the option chain data on graphs and charts. It will help understand the trends associated with different components of the option chain. Technical and Fundamental Analysis: Investors must analyse technical factors (associated with price) to make informed decisions.

Option Chain AnalysisUnderstanding Option Chain Analysis
An option chain is a matrix consisting of all available contracts for investors. Option chains are available for individual stocks and market indices like NIFTY 50 and NIFTY 500. You can select a stock or a market index and find all available options through an option chain.
The 9.20 short straddle strategy involves selling a call and a put option at the same strike price at 9:20 AM in Indian markets, aiming to capitalize on time decay and volatility.

Database trading Part 5Database trading is a method of using data to make better decisions in the market. It involves using data analysis to improve profits and avoid costly mistakes
Algo trading, also known as algorithmic trading, is a method of executing orders by providing a predefined set of rules to a computer program. When the predefined conditions are met, orders are placed at a speed and frequency that is impossible for a human trader.
Line charts are one of the most commonly used charts in intraday trading. The line charts only display the closing price.

Advanced Level Pcr tradingThe Put-Call Ratio (PCR) is a popular technical indicator used by investors to assess market sentiment. It is calculated by dividing the volume or open interest of put options by call options over a specific time period. A higher PCR suggests bearish sentiment, while a lower PCR indicates bullish sentiment.
However, no PCR can be considered ideal, but usually, a PCR below 0.7 is typically viewed as a strong bullish sentiment while a PCR more than 1 is usually considered as a strong bearish sentiment.
If PCR is above 1, it would mean that more puts are being traded and since more puts are being traded by the retail traders (option buyers) this could mean that markets might do the opposite which is go up. Higher than 1 the PCR is, higher the chances of the market going up.

Why RSI is Important in Trading???The relative strength index (RSI) is a momentum indicator that measures recent price changes as it moves between 0 and 100. The RSI provides short-term buy and sell signals and is used to track the overbought and oversold levels of an asset.
To use the RSI indicator, check if the value is above 70 to show an asset is overbought, or below 30 to show it is oversold. Traders can use these signals to find possible trading opportunities.
Successful trades often occur when the RSI crosses above 30 (indicating a buy signal) or below 70 (indicating a sell signal). Adjusting the RSI period to 9 can make it more sensitive to price changes and be suitable for more active trading strategies

Divergence Based TradingDivergence is when the asset price moves in the direction opposite to what a technical indicator indicates. When a stock is diverging, it signals weaker price trends and the beginning of a reversal. The two types of divergence are: Positive: A positive divergence is a sign of higher price movement in the asset.
Divergence signals tend to be more accurate on the longer time frames. You get fewer false signals. This means fewer trades but if you structure your trade well, then your profit potential can be huge. Divergences on shorter time frames will occur more frequently but are less reliable.
Divergences are a powerful trading concept and the trader who understands how to trade divergences in the right market context with the correct signals can create a robust method and effective way of looking at price.

Database Trading Part 4Database trading is a method of using data to make better decisions in the market. It involves using data analysis to improve profits and avoid costly mistakes.
Trading data is a sub-category of financial market data. It provides real-time information about stock and market prices as well as historical trends for assets such as equities, fixed-income products, currencies and derivatives.
A database is an electronically stored, systematic collection of data. It can contain any type of data, including words, numbers, images, videos, and files. You can use software called a database management system (DBMS) to store, retrieve, and edit data.

Database Trading Part 2Database trading is a method of using data to make better decisions in the market. It involves using data analysis to improve profits and avoid costly mistakes.
How does database trading work?
Data collection: Data is collected from various sources, such as stock exchanges, third-party financial data vendors, investment banks, and hedge funds
Data analysis: The data is analyzed to identify patterns and trends
Decision making: The data analysis is used to make decisions about trading, such as when to buy or sell
Execution: The decisions are executed by machines or humans
Benefits of database trading Helps improve profits, Helps avoid costly mistakes, and Helps navigate the markets.
Examples of trading strategies
Day trading
Involves making many trades in a single day to profit from short-term price changes
Algorithmic trading
Involves using computer programs to execute trades based on predefined rules
Event trading
Involves profiting from short-term price movements triggered by specific events
Position trading
Involves holding positions for an extended period to profit from price movements

Database Trading Part 1Database trading is a method of using data to make better decisions in the market. It involves using data analysis to improve profits and avoid costly mistakes.
How does database trading work?
Data collection: Data is collected from various sources, such as stock exchanges, third-party financial data vendors, investment banks, and hedge funds
Data analysis: The data is analyzed to identify patterns and trends
Decision making: The data analysis is used to make decisions about trading, such as when to buy or sell
Execution: The decisions are executed by machines or humans
Benefits of database trading Helps improve profits, Helps avoid costly mistakes, and Helps navigate the markets.
Examples of trading strategies
Day trading
Involves making many trades in a single day to profit from short-term price changes
Algorithmic trading
Involves using computer programs to execute trades based on predefined rules
Event trading
Involves profiting from short-term price movements triggered by specific events
Position trading
Involves holding positions for an extended period to profit from price movements

Use of RSI in tradingThe Relative Strength Index (RSI) is a technical indicator that helps traders assess the momentum of an asset's price. It's used to identify overbought and oversold market conditions, and to provide buy and sell signals
How to use RSI
Identify overbought and oversold conditions
RSI values above 70 indicate overbought conditions, while values below 30 indicate oversold conditions.
Confirm trends
Use the RSI to validate trends and trend reversals. For example, a downward trend is confirmed when the RSI crosses from above 50 to below 50.
Provide buy and sell signals
Use the RSI to determine when to enter and exit positions. For example, low RSI levels indicate oversold conditions, which may generate a potential buy signal.
Combine with other indicators
Use the RSI with other technical indicators to identify market trends and confirm signals. For example, you can combine RSI with moving averages to identify strong assets in uptrends
