$FLOW CRASH ALERT – WHAT JUST HAPPENED?AMEX:FLOW just got destroyed, dropping over 52% in 24 hours.
Price action
High: $0.174
Low: $0.079
Current: ~$0.10
Major Red Flags Today:
🔹 Upbit & Bithumb Suspended Deposits and Withdrawals
🔹 South Korea’s DAXA Issued a Trading Risk Warning
🔹 Flow Foundation confirmed they are investigating a potential security incident on the Flow network
What On-Chain Data Shows:
🔹 Top 100 holders Reduced Holdings by ~2.79M FLOW
🔹 No Smart Money Accumulation signal
🔹 Heavy Selling by Public Wallets During Peak Hours
🔹 ~1.69M FLOW moved to Exchanges (Selling Pressure)
🔹 Late buyers Jumped in During the Crash, Not Before
Market Behavior:
🔹 Panic selling dominated
🔹 Whales appear to have distributed near highs
🔹 Some wallets aggressively bought the dip amid fear
🔹 Reports of a large whale dumping on DEXs
Uncertainty Remains:
🔹 Cause of the “security incident” is still unclear
🔹 CEX suspensions increase fear and volatility
🔹 Short-term sentiment remains extremely bearish
This Move Was Driven by Fear, Uncertainty, and Heavy Selling Pressure. Until Clarity Comes from the Flow Foundation, Risk Remains Very high.
Investors are Waiting for clear Answers from Flow Blockchain
Trade Carefully. Volatility is Brutal Right Now.
NFA & DYOR
Crypto

$VELO IS ONE OF THE MOST MISPRICED TOKENS IN CRYPTONASDAQ:VELO IS ONE OF THE MOST MISPRICED TOKENS IN CRYPTO
$120M mcap.
BlackRock-backed stablecoin.
1M+ real users.
Backed by CP Group (7-Eleven Thailand) + Stellar.
Down 99.7% from ATH while building real PayFi rails in SE Asia’s $396B Cross-Border Market.
IEO: $0.05 → ATH: $2.07 (40x)
Now at $0.0067 🤯
High inflation? Yes.
High risk? Absolutely.
If RWA + PayFi runs and a Binance Main Listing Lands… This Won’t Stay at $120M.
⚠️ Disclaimer: Not financial advice. Do your own research. Crypto is volatile & You Can Lose Everything.

Everyone Asking Why $PIPPIN Did a 30x in a Few Days Is Already LEveryone Asking Why CRYPTOCAP:PIPPIN Did a 30x in a Few Days Is Already Late (Read Before You Trade)
CRYPTOCAP:PIPPIN did not rally 30x because of innovation.
It rallied because market structure allowed it to.
No presale.
No venture capital.
No team allocation.
From Pump.fun to $300M+ market cap in days.
Here is the reality 👇
1️⃣ Separate narrative from mechanics
Markets do not move on stories.
They move on liquidity, positioning, and leverage.
CRYPTOCAP:PIPPIN ’s move was structural, not fundamental.
Anyone telling you otherwise is selling a narrative.
2️⃣ Launch mechanics defined tradability
CRYPTOCAP:PIPPIN launched on Pump.fun via a fair-launch bonding curve.
🔹 No private allocations
🔹 No insider inventory
🔹 Uniform market access
This removed early insider dumping,
It did not remove downside risk.
3️⃣ Tokenomics were neutral, not bullish
▪️ 1B fixed supply
▪️ 100% circulating
▪️ No future unlocks
▪️ No inflation
Clean structure reduces uncertainty.
It does not create demand.
Demand came from positioning, not supply math.
4️⃣ AI credibility acted as a filter, not a driver
Association with BabyAGI’s creator improved narrative quality.
It did not justify valuation.
It lowered skepticism.
Narratives don’t need depth,
They need acceptance and distribution.
5️⃣ Pre-breakout behavior followed a known pattern
Before expansion, we observed:
🔸 Tight consolidation
🔸 Low public attention
🔸 Increasing large-wallet activity
This is where asymmetric risk is formed.
Retail reacts later.
6️⃣ Expansion phase was mechanical
Once volume accelerated:
🔹 Leverage increased
🔹 Shorts were liquidated
🔹 Exchanges amplified liquidity
🔹 Momentum systems engaged
From this point, price discovery becomes reflexive.
7️⃣ Risk concentration is non-trivial
On-chain data indicates significant supply concentration.
A small group of wallets controls a meaningful share of float.
This introduces binary risk:
🔹 Support continuation
🔹 Or rapid distribution
Liquidity disappears faster than it appears.
8️⃣ This asset class demands precision
CRYPTOCAP:PIPPIN is best described as:
👉 A high-beta momentum instrument
👉 A narrative-driven liquidity event
It is not:
❌ A long-term investment vehicle
❌ A fundamentals-based AI allocation
❌ Capital-preservation oriented
Volatility is a feature, not a flaw.
9️⃣ Where participants fail
Most losses occur when traders confuse:
🔹 Narrative with valuation
🔹 Momentum with durability
🔹 Fair launch with safety
Markets punish conceptual errors quickly.
1️⃣0️⃣ Final assessment
CRYPTOCAP:PIPPIN is not a forecast.
It is a case study in modern crypto market behavior.
Success in this market comes from understanding:
👉 Structure
👉 Liquidity
👉 Timing
👉 Risk
Not belief.
This is a high-risk memecoin environment.
Position sizing and discipline are mandatory.
Follow for institutional-grade crypto analysis.
NFA & DYOR

$BTC: Technical Breakdown (High-Probability Bearish Setup)CRYPTOCAP:BTC : Technical Breakdown (High-Probability Bearish Setup)
Market Structure Shift
Bitcoin has Already lost $107000 major bullish support and is sustaining below it, confirming a bearish market phase.
The Head & Shoulders distribution pattern is fully validated.
Head & Shoulders Measurement
As per classical H&S rules, the 162% extension target of the pattern has already been achieved on the downside, indicating:
🔹 Pattern completion
🔹 Cycle top likely formed
🔹 Transition from bull to bear phase
Fibonacci Retracement (Macro Bear Framework)
Measured from bear-market low → cycle top, Fibonacci levels project:
0.382 Fib: ~$56,700
0.5 Fib: ~$44,000 → key bear market acceptance zone
0.618 Fib: ~$35,000 → strongest macro support / worst-case scenario
Current price action still reflects a healthy macro retracement, not capitulation.
Liquidity & Imbalance
Despite the bearish structure, a Fair Value Gap (FVG) remains unmitigated in the $98,000–$100,000 range.
This level may act as a liquidity magnet before the next impulsive leg down.
Bias & Scenarios
Primary bias: Bearish
Relief rally possibility: $98K–$100K (FVG fill)
Next downside leg: $70K–$60K, then deeper Fib supports
Conclusion
With H&S 162% target completed and structure broken, BTC remains bearish by technical definition.
Trade only with confirmation, manage risk, and respect all valid scenarios.
NFa & DYOR

$LUNA Finally Catching a breath After Brutal Red Days VIE:LUNA Finally Catching a breath After Brutal Red Days 😮💨
From Bloodbath to Bounce:
🔴 -99.88% massacre (RIP portfolios)
🟢 Now +286% relief at $0.23 From $0.06415 within 21 Days
▶️Major Downtrend line overhead
Major resistance at $0.30-0.38 ahead.
Potential bottom formation or dead cat bounce?
Recovery or bull trap? Time will tell 🤔
EXTREMELY HIGH RISK asset - trade with caution
Not financial advice | DYOR

BTC: Liquidity Sweep SetupBTC: Liquidity Sweep Setup
Bitcoin continues to operate inside a broad equilibrium zone after completing a prolonged downward phase earlier in the month. The decline lost momentum as price entered a high-participation area, where trading activity became increasingly balanced and rotational. Since then, the market has developed a wide consolidation band, signaling a temporary standoff between directional conviction and liquidity accumulation.
Recent sessions show price repeatedly rotating through the center of this zone, forming alternating impulses that lack continuation. This pattern reflects a market focused on collecting orders rather than trending. Each short-lived push quickly transitions back into the range, indicating absorption on both sides and limited willingness from participants to sustain directional movement.
The lower portion of the range has begun attracting more activity, suggesting interest from larger players seeking efficient fill zones before any expansion. Price behaviour here is characterized by controlled sweeps, shallow recoveries, and frequent re-tests of the mid-band — signs of liquidity harvesting rather than aggressive distribution.
Forward behaviour on the chart implies that the market may first dip into the lower liquidity pocket to finalize order collection. Once this pocket is satisfied, conditions become favourable for a transition into an expansion phase targeting the upper boundary of the current equilibrium. This type of structure is common before major repricing, as it reflects the buildup of untriggered positions awaiting execution.
Overall, Bitcoin is in a preparation phase where energy is being stored, volatility is compressing, and liquidity is reorganizing. The next significant development is likely to emerge once the market completes its sweep of inefficient areas inside the range and finds a stable base for expansion.

LINKUSDT – Trendline Rejection Short Setup (1H)Price has tapped the major descending trendline and is showing rejection signs.
Market structure is still bearish, and price is reacting exactly at the trendline + previous supply zone.
🔎 Trade Idea
Bias: Short
Reason: Price retests descending trendline → shows rejection → aligns with bearish structure
Entry Zone: Current rejection area
Stop-Loss: Above the trendline + previous swing high
Target: Next liquidity zone / previous demand area
🧠 Why This Setup Makes Sense
Trendline is respected multiple times → strong dynamic resistance
Price failed to break structure convincingly
Clean risk–reward setup
Lower highs still intact
Overall market sentiment is neutral-to-bearish
⚠️ Risk Note
This idea is for educational purposes only.
Market conditions can change quickly—manage your risk carefully.

$BNB: Key HTF Decision Zone AheadCRYPTOCAP:BNB : Key HTF Decision Zone Ahead
#BNB is still holding above the critical $700–$550 demand zone, the same area that defines the continuation or breakdown of the current macro trend. As long as price maintains this support, HTF structure stays bullish and the next expansion wave targets $1500 → $2000 → $2500 → $3000.
A weekly close below $550 would flip structure bearish and open a deeper correction toward $250–$170.
Key Levels
Accumulation Zone: $700–$550
Upside Targets: $1500 / $2000 / $2500 / $3000
Invalidation: Weekly close < $550
BNB is at a major decision point: Hold the zone and bullish momentum accelerates; lose it and trend resets.
NFA & DYOR

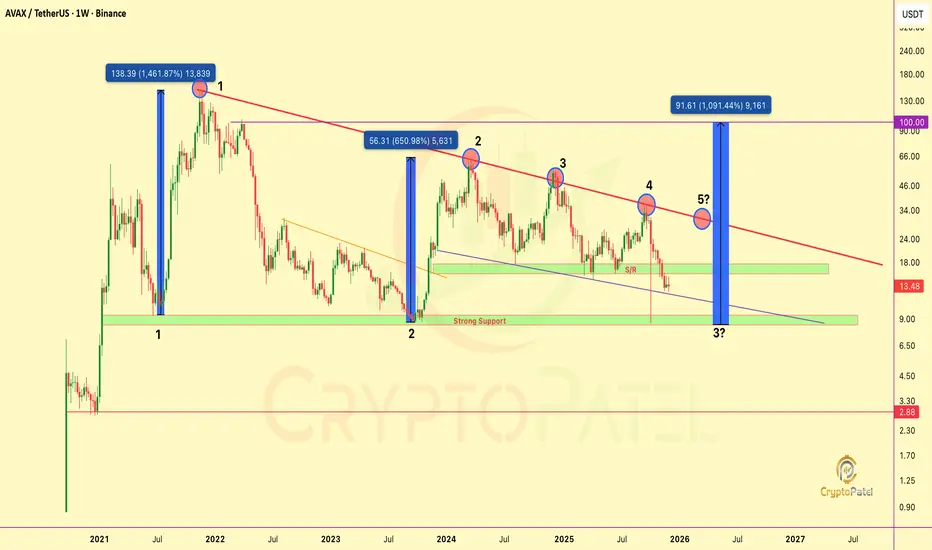
$AVAX on the Edge — $100 Breakout or $3 Crash?CRYPTOCAP:AVAX Is Approaching a Critical Technical Turning Point: Here’s What the Chart Really Shows
#AVAX is currently trading in a bearish market structure, but the chart is setting up for a major decision zone that could define its long-term trajectory.
Major Resistance Pressure Building
AVAX has tapped the Red trendline resistance 4 times, creating a historically strong barrier.
However, repeated tests have weakened the level, and the next approach, the 5th attempt near the $30 region, carries a significantly higher probability of a breakout.
A confirmed breakout here could shift momentum aggressively, opening the path toward the $100 zone.
Bearish Structure Still Dominant
Price has already lost key support and continues to trade below the $16–$17 zone, which has now flipped into resistance.
This is the first structure level bulls must reclaim to regain momentum.
High-Probability Accumulation Zone
The $10–$8 support zone remains the most critical area on the chart:
👉 June 2021: +1461% rally from this zone.
👉 September 2023: +650% rally within six months.
If AVAX revisits this zone again, it would represent the 3rd historical test, which has previously acted as a powerful accumulation region and could offer strong long-term upside potential.
Critical Breakdown Level
A loss of the $8 support would invalidate the bullish structure and expose AVAX to a potential freefall toward $3–$2, where no major historical support exists.
This is a pure technical-analysis view. Not financial advice. Always DYOR.
BTCUSDBitcoin is in a downtrend.
Currently falling off the supply zone, @106 lvl.
Will be monitoring closely the demand, other then that first low is logical target.

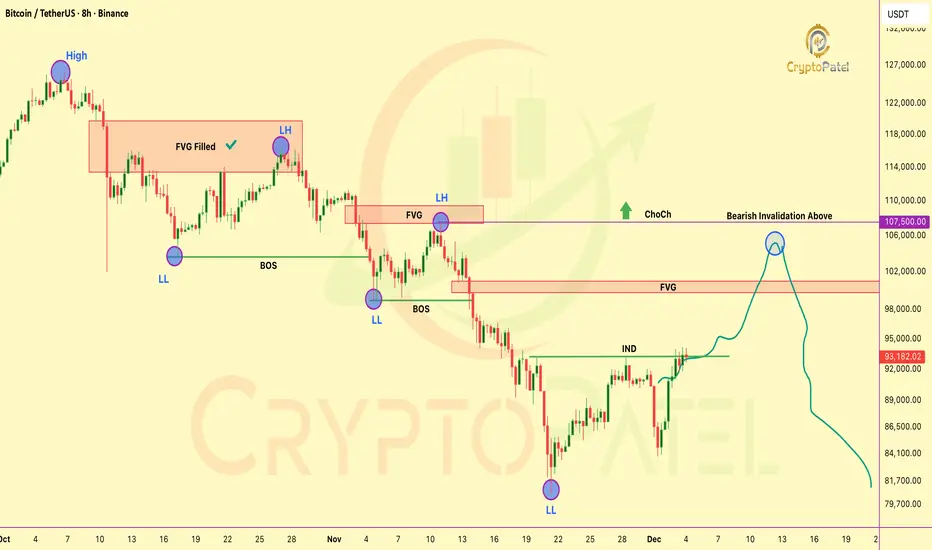
HTF ChoCH Alert: BTC’s Macro Bias Is Still BearishHTF ChoCH Alert: BTC’s Macro Bias Is Still Bearish
BTC is still following clean HTF bearish order-flow (LH → LL → BOS).
The current push up is just a premium retracement, driven by internal liquidity grabs.
Price is reaching for the premium FVG at 99,866–101,184, the next clear draw on liquidity and a prime reversal zone.
Below 107,500 bias stays bearish (Bearish Invalidation / HTF ChoCH)
Expect: BSL sweep → FVG fill → mitigation → sell-side continuation.
ICT view:
Market is simply rebalancing inefficiency before delivering lower.
NFA & DYOR
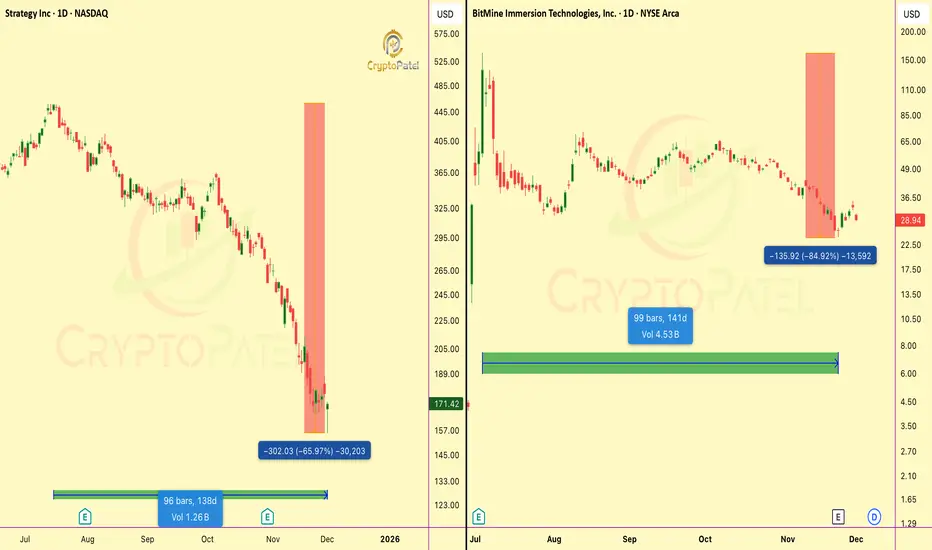
TOP TREASURY COMPANIES BLOODBATHTOP TREASURY COMPANIES BLOODBATH
👉 NASDAQ:MSTR : -64% from ATH ($457→$156) ( BITCOIN TOP HOLDER)
👉 AMEX:BMNR : -82% from peak ($161→$25) (ETHEREUM TOP HOLDER)
Is this capitulation or just the beginning?
NFA & DYOR
BTCUSD — extending the declineThe most likely scenario I see is a move to the 70k area or slightly lower. From that level we can then look for the next move.

$TRUMP TOKEN: A 92% MASSACRE IN JUST 316 DAYS$TRUMP TOKEN: A 92% MASSACRE IN JUST 316 DAYS: WHAT THE HELL JUST HAPPENED? 😡
Let’s talk about the BRUTAL reality of celebrity/president tokens:
THE NUMBERS DON’T LIE:
🔹 ATH: $79.70 (January 19, 2025)
🔹 TODAY: $5.69 (December 1, 2025)
🔹 DOWN 92.58% IN LESS THAN A YEAR
316 DAYS: Not even a full year and your portfolio is DESTROYED.
THE REALITY CHECK:
If you bought $1,000 at ATH → Your bag is worth only ~$71 TODAY 💀
WHO PROFITED?
✅ Early insiders who dumped on retail
✅ VCs who got free or discounted tokens
✅ Influencers who promoted and then silently exited
WHO GOT REKT?
❌ Retail investors who FOMO’d at the top
❌ Newbies who trusted the hype
❌ Anyone who didn’t take profits
MY REPEATED WARNING:
NEVER INVEST IN INFLUENCER/PRESIDENT TOKENS!
This is exactly why I keep saying:
🔹 Don’t chase celebrity coins
🔹 Your money is HARD-EARNED
🔹 These are pump & dump schemes disguised as “movements”
Is this crypto or a 3rd class memecoin casino? YOU DECIDE.
LESSON: Hype doesn’t pay bills. Due diligence does.
STAY SAFE. TRADE SMART. PROTECT YOUR CAPITAL.
NFA & DYOR

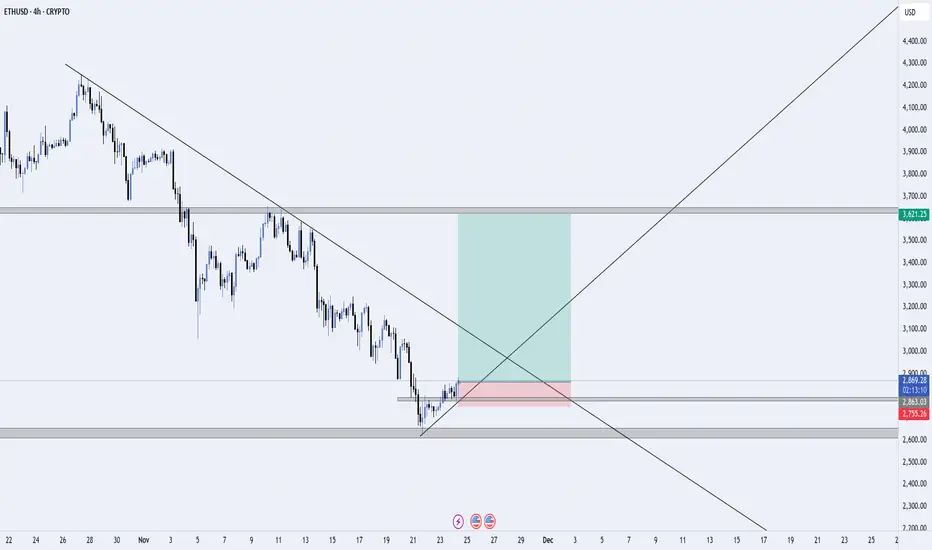
ETH/USD – Trendline Breakout Attempt from Higher-Timeframe DemanETH/USD is reacting strongly from a major 4H demand zone after an extended downtrend. Price has tapped into a high-volume area between $2,760–$2,800, showing the first signs of bullish strength with a clean internal structure shift.
📌 Setup Overview
Price respected a long-term descending trendline, but buyers stepped in strongly at the higher-timeframe demand zone.
A short-term structure break (BOS) suggests a potential reversal beginning to form.
Market is now retesting the broken structure + mini demand zone, where buyers are likely to defend.
🎯 Trade Plan
Entry: After the retest confirmation of the minor demand zone.
Stop-loss: Below the demand area to protect against liquidity sweeps.
Target: The next major supply zone around $3,600, aligning with the larger structure and trendline interaction.
📈 Bias
Bullish short-term — expecting continuation to the upside if price holds above the retest zone.
Structure suggests a potential mid-term trend reversal if buyers maintain control.
❌ Invalidation
Idea becomes invalid if price closes below the demand zone and breaks structure to the downside.
XRPUSDT – 4H | Channel Rejection + Re-Test | High RR Long SetupXRP is respecting a long-term descending channel, and the recent price action shows a strong bullish reaction from the lower boundary of the channel. After sweeping liquidity at the lows, price has broken back above the inner trendline and is now retesting it as support.
🔍 Key Technical Points
Price bounced from the channel bottom, showing buyer strength.
Clear break and retest of the minor descending trendline.
Price holding above the retest zone (grey demand area).
Targeting the upper channel resistance + higher-timeframe supply zone.
Attractive Risk-to-Reward setup if the retest holds.
📈 Long Setup
Entry: Around 2.20 – 2.22
SL: Below 2.06 (structure invalidation)
TP: 2.65 – 2.70 zone
R:R: ~4.5R (High reward potential)
📌 Why I Like This Setup
This setup aligns with:
Trendline confluence
Demand zone reaction
Clear momentum shift
Liquidity grab at the lows
Room to move higher towards channel top
If bulls hold the retest, XRP could push toward the 2.65–2.70 target area.
⚠️ Disclaimer
This is only my personal analysis and not financial advice. Always trade with proper risk management.

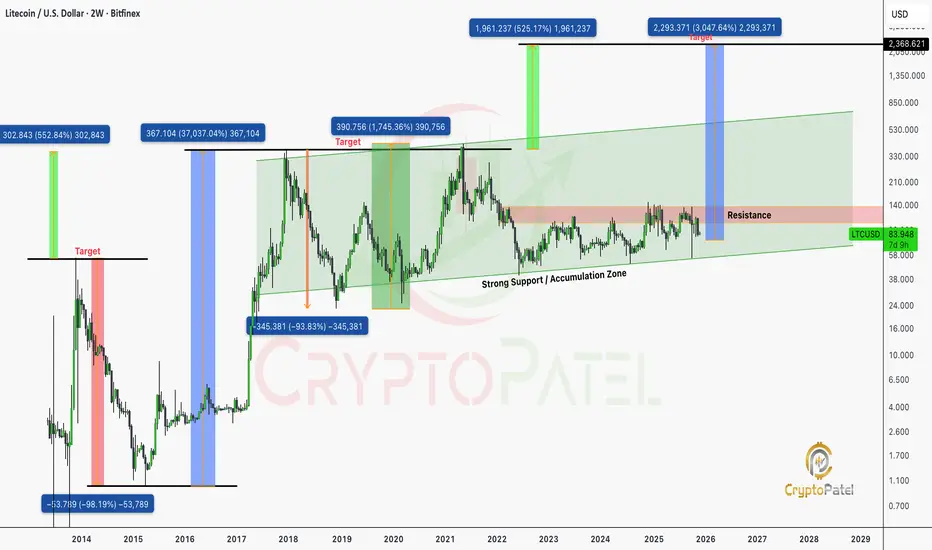
Is $LTC Dead? The Same Question Asked Before Every Major Rally…Is CRYPTOCAP:LTC Dead? The Same Question Asked Before Every Major Rally…
When markets forget history, they repeat it. Litecoin has gone through multiple full-cycle Retracements, Each time followed by explosive multi-X expansions. Let’s walk through the data:
🔰 2013–2015 Cycle: “LTC is Dead” #1
🔹 LTC hit an ATH of $55 from $1.
🔹 Retraced ~98%, bottoming at $0.985 within 16 months.
🔹 Retail sentiment: “LTC is dead.”
🔹 Smart money quietly accumulated.
Result?
$0.985 → $9 in 4 months (≈ +900%)
Eventually: $0.985 → $370 in 3 years (≈ +37,000%)
🔰 2017–2018 Cycle: “LTC is Dead” #2
🔹 New ATH: $370
🔹 Retracement: 92%, down to $23
🔹 Again: retail capitulation.
Result?
$23 → $146 in 6 months
$23 → $413 by May 2021 (≈ +1700%)
🔰 Current Market Structure (2021–2025)
🔹 Previous ATH: $413 (May 2021)
🔹 Current price: ~$84
🔹 Drawdown: 80%
Retail narrative: “LTC is dead.”
TA narrative: This is historically the accumulation zone.
Technical Outlook (Cycle-Based TA Projection)
Every prior deep-cycle retracement (80–98%) has led to:
🔹 Fresh multi-year impulse waves
🔹 New macro highs
🔹 Massive ROI expansion for accumulator wallets
Based strictly on historical cycle symmetry, volatility bands, and LTC’s halving-driven structure:
LTC Bull-Run Projection:
$600 – $1,000 is a reasonable and technically sound target range for the current macro cycle.
This would represent:
🔹 Breaking the 2021 high
🔹 Completing a full 5-wave macro structure
🔹 Returning to historical expansion ratios seen in every prior cycle
So You Already Know What Happens Next.
Litecoin’s entire history is built on max pain → max gain cycles.
Every 80–98% retracement has delivered its largest multi-X rallies after retail gave up.
Smart investors accumulate when the chart says accumulate, not when the crowd screams “dead.”
FINAL MESSAGE
LTC is not dead. It is in the same deep-value zone where every previous mega-cycle began.
If the market delivers another historical impulse, the $600–$1000 range remains a technically justified target.
Accumulate dips.
Ignore noise.
Let the chart speak.
Not Financial Advice so Always Do your Own Research Before Any Investments.
Is $LTC Dead? The Same Question Asked Before Every Major Rally…Is NYSE:LTC Dead? The Same Question Asked Before Every Major Rally…
When markets forget history, they repeat it. Litecoin has gone through multiple full-cycle Retracements, Each time followed by explosive multi-X expansions. Let’s walk through the data:
🔰 2013–2015 Cycle: “LTC is Dead” #1
🔹 LTC hit an ATH of $55 from $1.
🔹 Retraced ~98%, bottoming at $0.985 within 16 months.
🔹 Retail sentiment: “LTC is dead.”
🔹 Smart money quietly accumulated.
Result?
$0.985 → $9 in 4 months (≈ +900%)
Eventually: $0.985 → $370 in 3 years (≈ +37,000%)
🔰 2017–2018 Cycle: “LTC is Dead” #2
🔹 New ATH: $370
🔹 Retracement: 92%, down to $23
🔹 Again: retail capitulation.
Result?
$23 → $146 in 6 months
$23 → $413 by May 2021 (≈ +1700%)
🔰 Current Market Structure (2021–2025)
🔹 Previous ATH: $413 (May 2021)
🔹 Current price: ~$84
🔹 Drawdown: 80%
Retail narrative: “LTC is dead.”
TA narrative: This is historically the accumulation zone.
Technical Outlook (Cycle-Based TA Projection)
Every prior deep-cycle retracement (80–98%) has led to:
🔹 Fresh multi-year impulse waves
🔹 New macro highs
🔹 Massive ROI expansion for accumulator wallets
Based strictly on historical cycle symmetry, volatility bands, and LTC’s halving-driven structure:
LTC Bull-Run Projection:
$600 – $1,000 is a reasonable and technically sound target range for the current macro cycle.
This would represent:
🔹 Breaking the 2021 high
🔹 Completing a full 5-wave macro structure
🔹 Returning to historical expansion ratios seen in every prior cycle
So You Already Know What Happens Next.
Litecoin’s entire history is built on max pain → max gain cycles.
Every 80–98% retracement has delivered its largest multi-X rallies after retail gave up.
Smart investors accumulate when the chart says accumulate, not when the crowd screams “dead.”
FINAL MESSAGE
LTC is not dead. It is in the same deep-value zone where every previous mega-cycle began.
If the market delivers another historical impulse, the $600–$1000 range remains a technically justified target.
Accumulate dips.
Ignore noise.
Let the chart speak.
Not Financial Advice so Always Do your Own Research Before Any Investments.

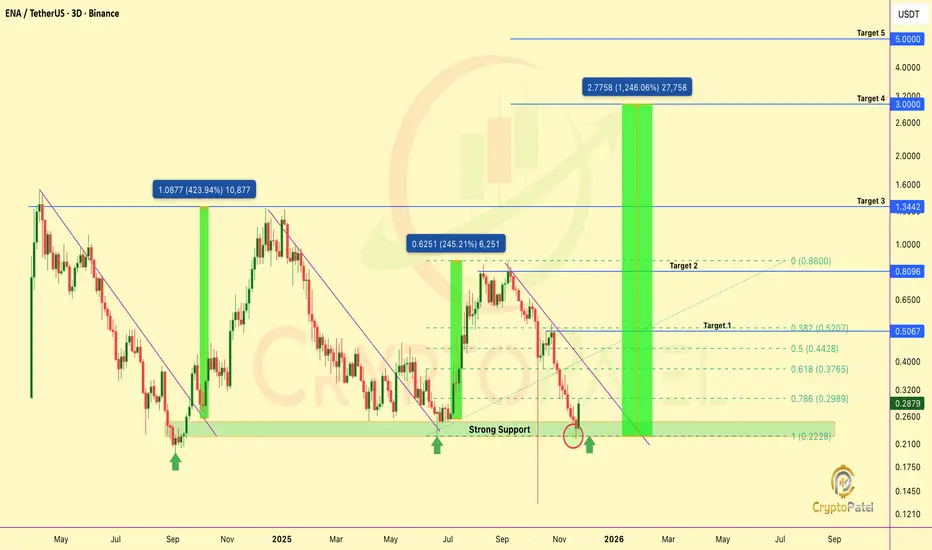
$ENA Technical Outlook: Major Reversal Signal TriggeredMIL:ENA Technical Outlook: Major Reversal Signal Triggered
ENA has cleanly rebounded from its structural support at $0.24–$0.22, a zone that has historically defined trend inflection. As long as price holds above this base, the bullish probability sharply increases, with a potential multi-fold expansion ahead.
Accumulation Zone: $0.28–$0.24
Targets: $0.50 / $0.80 / $1.34 / $3 / $5
Invalidation: HTF close below $0.19
Notably, ENA has now completed a full 0.0 Fibonacci retracement, an event that rarely occurs and often precedes a fresh all-time high breakout in structurally strong assets.
$0.50–$0.80 remain conservative upside targets; the higher projections depend on investor risk profile and time horizon.
Risk remains limited, while the asymmetry is exceptionally high.
NFA & DYOR
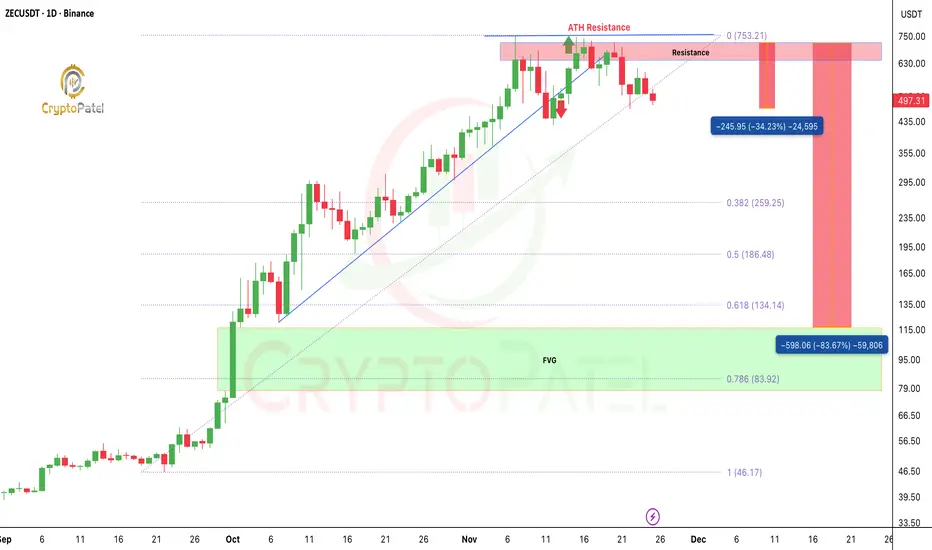
UPDATE: $ZEC Playing Out EXACTLY As WarnedUPDATE: CRYPTOCAP:ZEC Playing Out EXACTLY As Warned
ZEC tagged the $700 HTF resistance and dumped 35%+ right from the level I highlighted earlier.
The move toward the $100 zone is unfolding step-by-step, exactly what the HTF structure hinted at.
I’m not saying ZEC can’t reclaim $700 and even squeeze toward $1,000 again…
But the risk is extremely elevated up here. Smart money enters where risk is low + reward is high, not at euphoric tops.
This is NOT a short signal.
This is awareness analysis, don’t jump into high-leverage longs blindly in a corrective environment.
My Radar Levels: $259 / $186 / $134
Invalidation : Any HTF candle closing above $760
Stay disciplined. Protect capital. Market always rewards the patient, not the emotional. NFA.
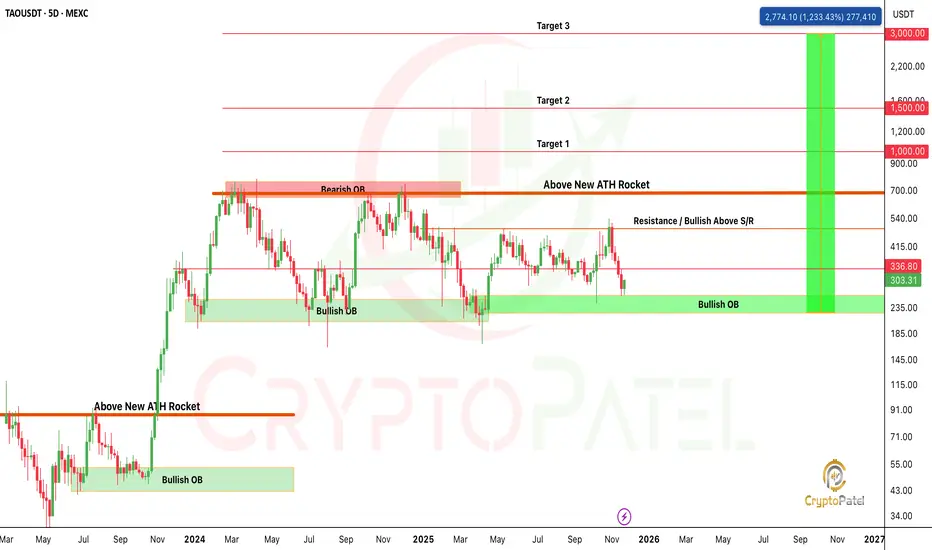
$TAO HTF SMC: Who’s Ready for the $1,000+ Expansion?GETTEX:TAO HTF SMC: Who’s Ready for the $1,000+ Expansion?
Price continues to respect the HTF Bullish Order Block (OB) at $235–$185, which remains the primary demand zone maintaining bullish order flow. Each mitigation of this OB has previously generated strong displacement to the upside, confirming active institutional interest.
The current range is defined by:
🔹 HTF Demand (Bullish OB): $235–$185
🔹 Mid-Range S/R: $540
🔹 HTF Supply (Bearish OB): $640–$700
A decisive close above $540 S/R will shift the internal structure bullish and validate a premium re-pricing phase targeting the HTF Supply at $640–$700.
A clean break of structure (BOS) above $700, combined with a displacement candle, will confirm HTF trend continuation and open up extended liquidity targets:
Target 1: $1,000
Target 2: $1,500
Target 3: $3,000
As long as price maintains the $235 Bullish OB, the HTF narrative remains bullish, with expectation of a sweep of upper-side liquidity and expansion toward unmitigated supply zones.
NFA & DYOR
BTCUSD Liquidity Sweep Setup Before Bearish ContinuationBTCUSD Liquidity Sweep Setup Before Bearish Continuation
Overview
BTCUSD continues to display persistent downside pressure across the mid-term structure. Price action on the 3H timeframe shows a sequence of lower highs and lower lows, reflecting sustained bearish control. Despite short periods of stabilization, the overall market environment remains distribution-driven.
Market Structure
Recent price behavior confirms multiple break-of-structure (BOS) events, each reinforcing the broader downward momentum. Every attempt at upward expansion has been met with supply absorption, indicating that buyers are failing to regain initiative. The consolidation developing in the current region suggests an accumulation of short-term liquidity, but without structural evidence of reversal.
Supply & Liquidity Context
Price is positioned directly beneath a key supply zone highlighted on the chart. This zone remains unmitigated and acts as the primary area where counter-trend reactions are likely to be absorbed. The tightening range beneath this level indicates liquidity buildup, commonly preceding engineered sweeps by institutional players.
The current model suggests that the market may execute a short-term liquidity run above local highs before resuming its downward trajectory. Such a move would align with previous behavior in this trend cycle, where short-term rallies were primarily used to deliver liquidity into higher-timeframe supply.
Downside Expansion Risk
Should the market complete a liquidity sweep into the supply zone, the next phase of downside continuation becomes probable. The structural projection on the chart anticipates a revisiting of the lower demand region around 74,300 – 75,000, an area aligning with previous inefficiencies and untested demand.
This target supports the continuation of the broader bearish structure unless a significant shift in order flow emerges.
Summary
BTCUSD remains positioned within a well-defined bearish cycle, characterized by repeated structure breaks and unmitigated supply zones controlling price. Current compression suggests the market is preparing for another liquidity-driven move. Unless buyers regain structure above the key supply region, the market retains a high probability of extending toward lower demand zones.

BITCOIN JUST DID EXACTLY WHAT WE DISCUSSED: CURRENT UPDATEBITCOIN JUST DID EXACTLY WHAT WE DISCUSSED: CURRENT UPDATE
CRYPTOCAP:BTC bounced perfectly from the 0.786 Fib ($83,308), The FINAL bullish support.
Now trading above $86,500, already +5–6% up from the exact level I alerted.
As long as BTC holds $83,308, upside relief rally remains active:
$88,000 (FVG)
$93,000 (Bearish OB)
$98,000 (FVG inefficiency)
But… if BTC loses $83,000, say hello to the $66,000 demand zone, The next real bullish orderflow.
For now: Structure is bullish above 0.786, cautious below it.
(NFA / DYOR)
