BTC Crashes to 3-Week Low: A True Nerve Test for TradersHello fellow traders, Bitcoin has entered an extremely tense phase!
BTC has slipped below 109,000 USD, marking its lowest point in three weeks. The main pressure comes from the looming expiry of a massive 22-billion-USD options contract at the end of the month, which is driving strong short-term selling.
On the daily chart, prices keep getting rejected at the downtrend line and the Ichimoku cloud, confirming that bears still hold the upper hand.
The current scenario points to further downside, with key support zones at 104,000 USD (TP1) and 98,900 USD (TP2).
These are the critical “do-or-die” levels to watch closely — only if BTC manages to hold above them can we expect a recovery once the options-driven selling pressure eases.
In short: Bitcoin is at a make-or-break moment. Traders, keep your stops tight and stay alert!
Crypto

ETHUSDT: Strong Uptrend with Solid SupportETHUSDT is currently experiencing a strong uptrend driven by the stability of the cryptocurrency market and strong fundamental factors. Despite some recent pullbacks, the primary trend remains bullish, supported by a solid foundation and positive investor sentiment.
Technical Analysis: ETHUSDT is currently testing a key support level at 3,985. If this level holds, there is a high probability of a rebound and continued upward momentum. The next resistance level is expected at 4,215.
Trading Strategy: If the price stays above the support level at 3,985, ETH is likely to continue rising towards the next resistance levels.
Outlook: Given the current fundamentals and technical indicators, ETHUSDT is likely to maintain its upward trajectory and target the 4,215 resistance level in the near future.

Gold Neowave Stuctural UpdateNamaskaram Everyone
Welcome to intelligent investor, we provide market insights by synchronising and combining all the price action waves from different time frames and gives you single trend.
How To Read My Charts...Click Below
FX:XAUUSD FX:XAUUSD OANDA:XAUUSD MCX:GOLD1!

BTC/USD: Bearish Trend After Flash Crash and Key NewsThe BTC/USD chart shows a strong bearish trend following the "flash crash" event and contract liquidations. Currently, BTC is moving within a downward channel with support levels at 110,300 USD and 108,000 USD.
News Impact:
Morgan Stanley to Offer Crypto Trading: Morgan Stanley’s partnership with Zerohash to provide crypto trading on E*Trade could boost cryptocurrency acceptance, but it's not enough to reverse the bearish trend in BTC.
Fed Chairman Jerome Powell on Interest Rates: Jerome Powell's statements regarding the possibility of maintaining high interest rates have increased uncertainty, negatively impacting the cryptocurrency market.
Conclusion: The bearish trend of BTC/USD may continue. Traders should pay attention to support levels and stay updated with economic news to make informed trading decisions.

BTC/USDT Outlook – Volatility Rises After Sharp DeclineBTC/USDT Market Report
Bitcoin recently faced heavy selling pressure, pushing the market into a sharp decline. This drop reflects a shift in sentiment where earlier stability has been replaced by increased volatility and downside momentum.
Price action shows signs of exhaustion after the fall, suggesting the possibility of a short-term rebound attempt. However, broader behavior still reflects uncertainty, with buyers needing stronger participation to shift momentum back in their favor.
If downward pressure continues, deeper corrections could emerge before any meaningful recovery. In the near term, traders should expect sharp swings as the market tries to stabilize.

Bitcoin Market Report – Liquidity Grabs Before Next ExpansionThe market is showing clear signs of engineered volatility, with strong impulsive moves followed by rapid retracements. This behavior reflects liquidity targeting, where price sweeps both sides before resuming its broader path.
Current conditions suggest Bitcoin is in a redistribution stage, with momentum alternating to trap short-term participants. The repeated liquidity grabs signal that larger players are accumulating positions while clearing out weaker hands.
The overall structure points to continued testing of lower liquidity pools before any major directional expansion. Once this phase is complete, the market is likely to enter a more decisive trend, supported by the buildup of institutional flow and reduced volatility pockets.
In short, Bitcoin is cycling through liquidity collection and preparation, positioning itself for a larger move as market balance shifts.

Solana Price Forecast | SOLUSDT Market OutlookSOLUSDT has completed a strong upward cycle and is now unwinding through a structured retracement. This phase is not showing disorderly selling but rather a controlled reset, where liquidity is being cleared to prepare for the next expansion.
The chart reflects a market that is cycling through accumulation, breakout, and pullback phases with consistency. Current downside movement is shaping a foundation zone that could serve as the springboard for renewed upward momentum.
Overall, the asset is displaying a constructive trajectory: corrections are functioning as fuel rather than weakness, pointing toward continuation of its broader growth path once this reset stabilizes.

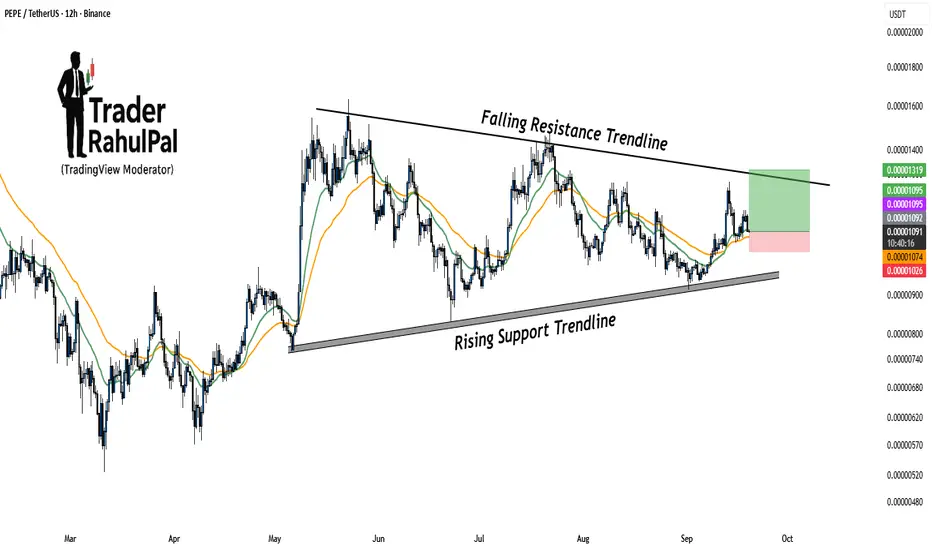
PEPE Getting Ready for a Big Move – Breakout Loading!PEPE is trading within a well-structured range, bounded by a rising support trendline and a falling resistance trendline . This setup indicates that the price is getting squeezed, and a decisive breakout move may be coming soon.
Currently, the price is holding above key moving averages, which adds strength to the bullish bias. As long as the rising support trendline remains intact, buyers will continue to defend dips. A breakout above the falling resistance could trigger a sharp move higher, targeting the next resistance levels near 0.00001319 .
On the downside, if price fails to hold above the rising support, we may see a deeper pullback toward 0.00001074–0.00001026 levels. Traders should closely watch how PEPE reacts near the falling resistance line in the coming sessions.
Disclaimer: This analysis is for educational purposes only and should not be taken as financial advice. Please do your own research or consult your financial advisor before investing.
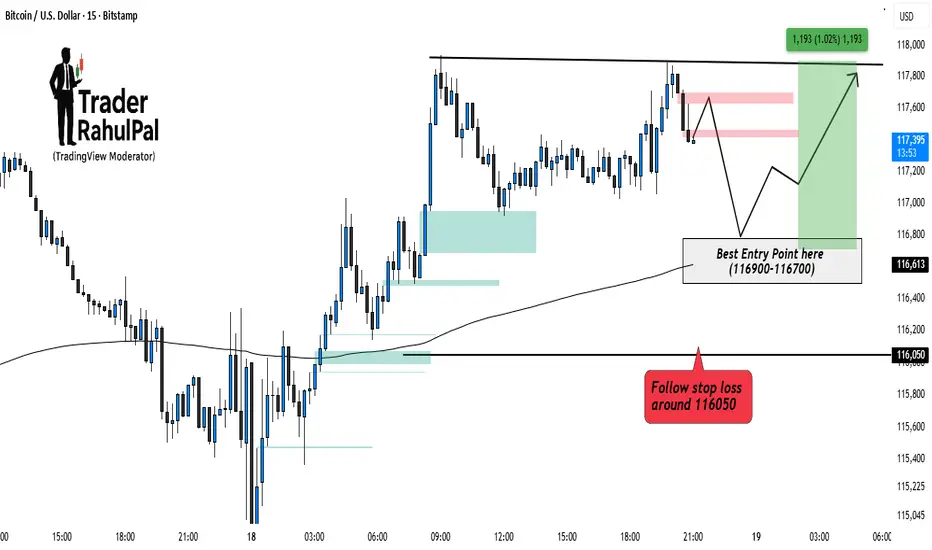
Bitcoin Bullish side Entry Setup Intraday – Key Levels to Watch!Bitcoin is consolidating near its upper resistance zone after a recent bounce. Price action suggests that a pullback into the 116900–116700 range can offer a high-probability entry for buyers. Maintaining a stop loss around 116050 helps to protect against deeper downside risk. As long as this zone holds, the bias remains bullish, with potential upside toward 117800–118000 . Intraday traders should closely watch how price reacts around the entry zone before positioning.
Disclaimer: This analysis is for educational purposes only and should not be taken as financial advice. Please do your own research or consult your financial advisor before investing.
BTC Price Action: Bulls vs BearsBTC Price Action: Bulls vs Bears
Bitcoin has shown a gradual recovery after a prolonged corrective phase, with market structure leaning toward a constructive buildup. Fundamentally, sentiment is influenced by global macro conditions—investors are watching U.S. monetary policy signals, while stable demand from institutions and long-term holders continues to provide a supportive backdrop. On-chain activity remains steady, with balanced exchange inflows and outflows suggesting no extreme directional pressure in the near term.
From a technical perspective, the market has shifted momentum from bearish flows into a developing bullish sequence. The recent break of structure on the 4H timeframe highlights strengthening upside intent, though price is still moving within a broader accumulation phase. Current flows suggest the possibility of a short-term dip for liquidity before continuation to higher levels, aligning with the overall constructive weekly outlook.

BCH Great Risk Reward Trade 15Septmber2025Hi Folks,
Technically BCH is Strong and ready for upward move!
My indicator has given a good entry and price is still in range so I have entered. Will post trade result in comments section later!
Stay Tuned

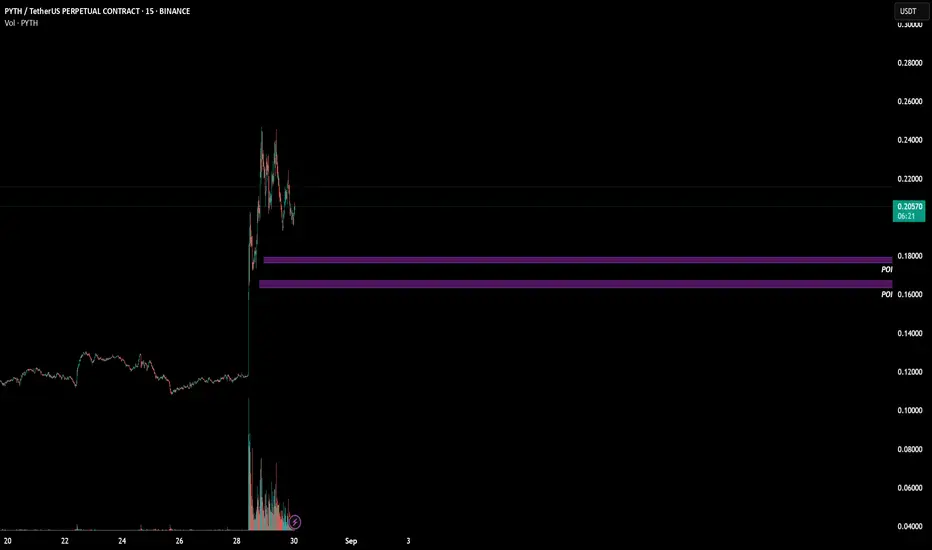
PYTH/USDT LONG IDEA
Long Idea to follow the impulsive trend of PYTH.
I personally like the 1st POI better - 0.1770 area.
This one also I am looking for at least double digit move.
Good luck everyone and happy trading!
BTCUSD Long Setup – Trend Continuation Play📌 Trade Details
Entry: 113,256.5
Target: 115,317.7
Stop Loss: 111,874.4
📊 Trade Rationale
✅ Trend Continuation: Price has respected the ascending trendline multiple times, indicating strong buyer interest.
✅ Break of Structure: Recent higher highs and higher lows confirm bullish momentum.
✅ Support Flip: Zone around 113,050 acted as resistance earlier and is now being retested as support.
✅ Volume Confirmation: Rising volume supports the bullish continuation bias.
✅ Clean Risk–Reward: With SL below structure and TP near major resistance, this setup offers a favorable RRR.
🎯 Target Zone
The target aligns with the next strong supply zone at 115,300+, where sellers may re-enter.
⚠️ Risk Management
Always size positions wisely, as crypto remains highly volatile. Protect your capital first.
Disclaimer:
This idea is for educational purposes only and not financial advice. Do your own research before entering any trade.

BNB/USDT – Bullish Breakout Trade Idea✅ Entry: 871.564
🎯 Target: 890.455
⛔ Stop Loss: 862.304
🔎 Trade Rationale:
Ascending Triangle Breakout – Price has respected the rising trendline and finally broken above the neckline resistance, signaling bullish continuation.
Volume Confirmation – A notable increase in buying volume supports the breakout strength.
Resistance Flip – The previous supply zone around 870 has turned into support, adding confluence.
📊 With a strong bullish structure and favorable RRR, this setup aims to capture the next push towards 890 zone.
⚠️ Disclaimer: This is not financial advice. Always do your own research and manage risk before trading.

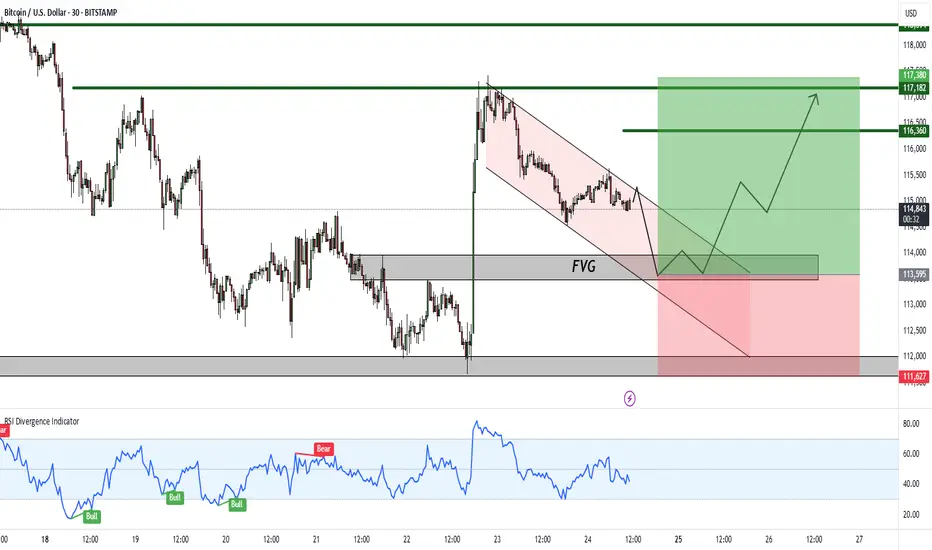
Bitcoin – Bullish Setup Forming After FVG Retest!Hello Traders!
Bitcoin is currently showing signs of forming a bullish setup after rejecting lower levels. The price has created a clean FVG (Fair Value Gap) zone and is moving within a falling channel, suggesting a possible accumulation before the next leg up.
Key Observations:
FVG Support: Price is likely to retest the FVG zone before a strong upward move.
Falling Channel: The structure indicates potential breakout to the upside.
RSI Divergence: Momentum indicators are showing signs of strength, supporting a bullish reversal case.
Targets: The upside targets are marked at 116,360 – 117,380 – 118,394 levels.
Invalidation: A breakdown below 111,627 would negate this bullish setup.
Rahul’s Tip:
Always wait for confirmation around the FVG zone. Entering too early may expose you to false breakouts. Risk management is crucial, especially in volatile assets like Bitcoin.
Disclaimer:
This analysis is for educational purposes only and not financial advice. Please do your own research before making any trading decisions.
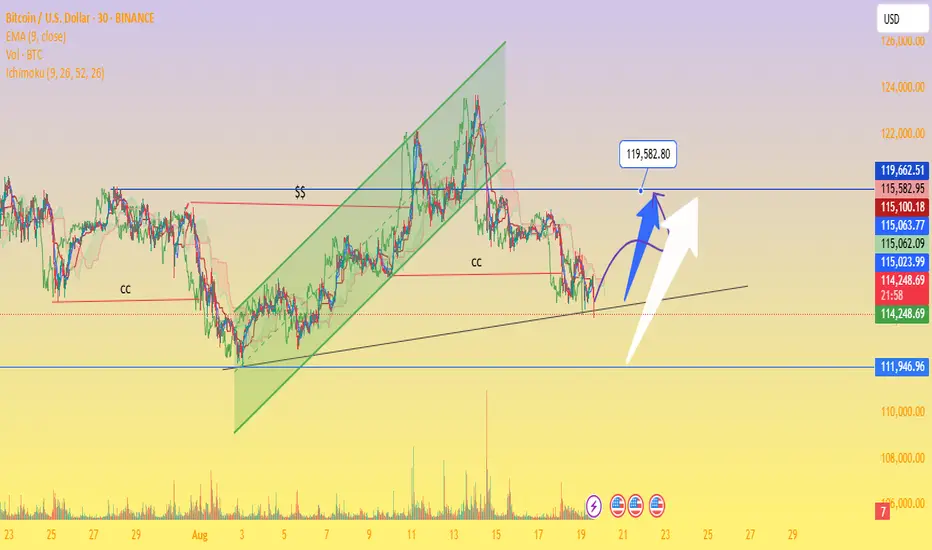
Bitcoin at a Critical Support – Breakout Toward $119K or ?Ascending Channel Breakdown – Price previously respected a rising green channel but broke below, showing weakness.
Critical Support Zone: Around $111,946 – $114,000 (black trendline + yellow support area).
Resistance Levels:
Near-term: $115,100 – $115,582
Strong: $119,582 (highlighted as major upside target)
Volume Profile: Declining volume with recent dip → signals possible accumulation before the next move.
Ichimoku Cloud: Price is slightly below cloud, indicating short-term bearish bias but with potential rebound if reclaimed.
Scenarios:
Bullish Case (Blue/White Arrows): If BTC holds above $114,000 support and breaks $115,500, a rally toward $119,500+ is possible.
Bearish Case: Failure to hold $114,000 may trigger a drop toward $111,946 (major demand zone).
ILV Setup – Consolidation at Major SupportAfter a strong rally, ILV has pulled back and is now consolidating within a major support zone — setting the stage for a potential next leg higher.
Trade Setup:
• Entry Zone: $17.00 – $18.00
• Take Profit Targets:
🥇 $20.00 – $24.00
🥈 $29.00 – $35.00
• Stop Loss: Just below $16.00

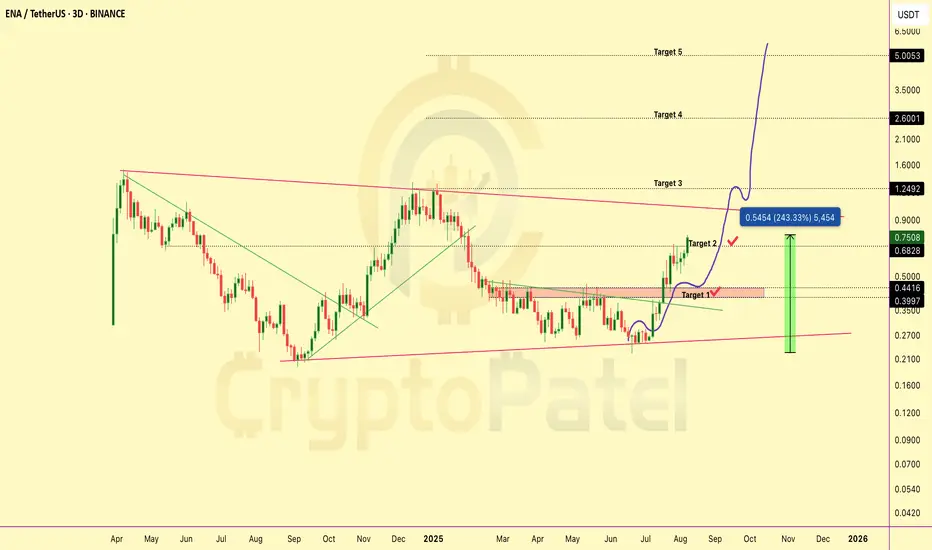
$ENA Up 243% From My $0.25 Entry And I’m Still BullishMIL:ENA Up 243% From My $0.25 Entry And I’m Still Bullish
Now MIL:ENA is trading at $0.75 and up 243% from our $0.25 entry ✅
TP1 and TP2 hit ✅ and I’m still super bullish, eyeing $1 / $2 / $5 next.
But remember, Greed has no limits.
Smart traders book partial profits and ride the rest with house money.
NFA & DYOR
Will Dogecoin hit $2 in Coming rally ?DOGE/USDT – Technical Analysis Update
CRYPTOCAP:DOGE is maintaining a solid structural support above the $0.150 key demand zone, with price action showing consistent defense of this level. As long as this zone remains protected on higher timeframes, bullish market structure remains intact for the current bull cycle and altseason.
Accumulation Zone: $0.230 – $0.180
This range aligns with prior demand imbalances and marks an optimal spot entry zone for long-term positioning.
A sustained hold and breakout from this accumulation range could open the path toward higher liquidity targets.
Upside Targets:
Target 1: $0.50 (mid-cycle resistance & liquidity pool)
Target 2: $1.00 (psychological level)
Target 3: $2.00 (macro cycle extension)
Bias: Bullish – Favoring spot accumulation within range
Invalidation: Daily close below $0.150 would shift bias to neutral/bearish
Price structure suggests CRYPTOCAP:DOGE is coiling for a high-momentum breakout once key liquidity levels are breached.
NFA & DYOR

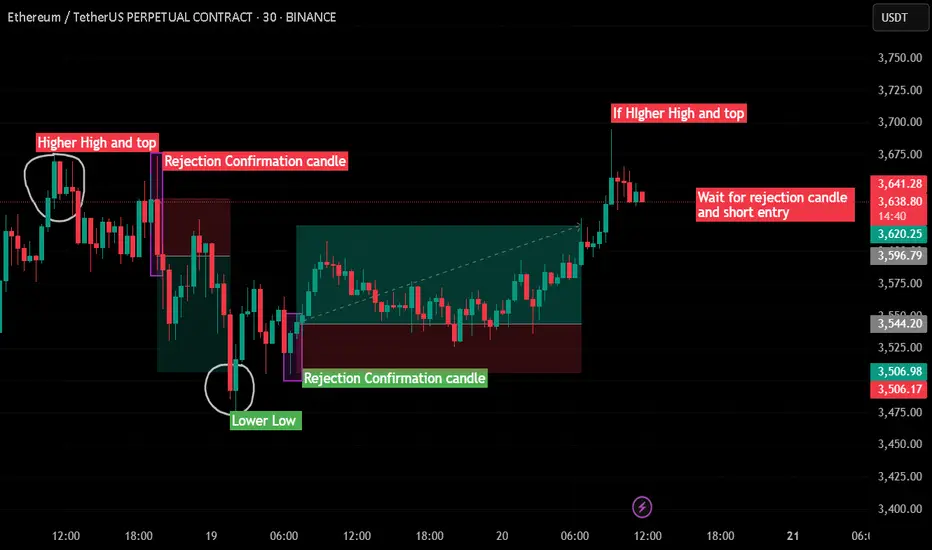
Trend Reversal Rejection Strategy | Higher High + Candle Confirm🔍 Idea Summary:
This strategy focuses on identifying trend reversal zones using classic Higher High (HH) and Lower Low (LL) structures followed by rejection confirmation candles.
🔻 Short Setup:
Price forms a Higher High.
Wait for a rejection candle (long wick, body closes inside previous range).
Confirm structure break and take short entry on confirmation.
✅ Example: On the left side of the chart, price printed a HH, followed by a strong rejection candle. That led to a clean move downward.
🔺 Long Setup:
Price forms a Lower Low.
Watch for a rejection candle near key support.
Enter long trade after confirmation.
✅ Example: Mid-chart shows price breaking to LL, then instantly rejecting with a strong bullish candle. Followed by a sustained move up.
🔴 Current Price Action:
Price is testing a potential new Higher High.
📌 Strategy suggests: Wait for a bearish rejection candle before shorting!
📈 Strategy Benefits:
Avoids impulsive entries
Combines structure with candle logic
Great for reversal traders and range scalpers
🔥 Like & follow for more real-time trading ideas!
💬 Drop your thoughts or questions below – let’s grow together, traders! 💪
#ETHUSDT #PriceAction #RejectionCandle #TrendReversal #SupportResistance #Scalping #TradingStrategy #Crypto #ChartPatterns #TechnicalAnalysis
Algo-Based Options Trading & AutomationIn the modern trading landscape, technology is not just a supporting tool—it’s the central force reshaping how markets function. Nowhere is this more visible than in options trading, where algorithmic trading (or “algo trading”) is taking over traditional manual strategies. With increased speed, accuracy, and scalability, automation in options trading is transforming retail and institutional participation alike.
This guide breaks down everything you need to know about algo-based options trading: what it is, how it works, what strategies are used, its pros and cons, and how automation is practically implemented in today's markets.
1. What is Algo-Based Options Trading?
Algo-based options trading involves using computer programs to execute options trades based on pre-defined rules and mathematical models. These programs analyze market data, identify trading signals, and place orders automatically—often much faster and more accurately than humans can.
The key components include:
Predefined logic or strategy (e.g., "Buy a call option when RSI < 30 and price is above 50-DMA")
Real-time market data feed
Execution engines that place and manage orders without manual intervention
Risk management modules to monitor exposure, margin, and stop-losses
2. Why Use Algo Trading in Options Instead of Manual Trading?
Options are complex instruments. Their prices are influenced by multiple variables like time decay, implied volatility, strike price, delta, gamma, and more.
Humans can’t always process this data fast enough, especially during high-volatility events. Here’s where algos shine:
Manual Trading Algo Trading
Emotion-driven Emotionless and consistent
Slower execution Millisecond-level speed
Prone to fatigue Runs 24/7 without breaks
Hard to backtest Easily backtested and optimized
Limited scalability Can manage thousands of trades simultaneously
3. Core Components of an Options Algo Trading System
To build or understand an automated options trading system, it’s essential to know its primary components:
A. Strategy Engine
This is the brain of the system. It defines:
Entry/Exit conditions (based on indicators like RSI, MACD, IV percentile, etc.)
Type of options to trade (call, put, spreads, straddles, etc.)
Timeframe (intraday, weekly, monthly)
Underlying asset and strike price selection logic
B. Data Feed & Market Scanner
Live option chain data from exchanges like NSE or brokers like Zerodha, Upstox
IV, OI, delta, gamma, theta, vega data
Historical data for backtesting
C. Order Management System (OMS)
This handles:
Order placement
Modifications (e.g., SL changes)
Cancel/re-entry logic
Smart order routing (SOR)
D. Risk Management Module
Risk management is critical. The automation should enforce:
Maximum daily loss limits
Exposure per trade
Position sizing based on capital
Portfolio hedging logic
E. Logging and Monitoring
Every trade, price, and action is logged for audit and improvement. Some systems send alerts via Telegram, email, or SMS.
4. Common Algo Strategies Used in Options Trading
1. Delta-Neutral Strategies
Goal: Profit from volatility while maintaining a neutral directional view.
Examples: Straddle, Strangle, Iron Condor
How Algos Help: Adjust delta automatically by hedging with futures or adding more legs
2. Trend Following with Options
Algos can detect breakouts and directional momentum and buy/sell options accordingly.
Example: Buy call when price crosses above 20-DMA and volume spikes
Add-ons: Use trailing SLs, exit when RSI > 70
3. Option Scalping
Used in very short timeframes (1m, 5m candles). Algo enters/exits trades rapidly to capture small moves.
Needs: Super-fast execution and co-location
Popular in: Weekly expiry trading
4. IV-Based Mean Reversion
Buy when Implied Volatility (IV) is abnormally low or sell when it’s high.
Algos monitor: IV percentile, skew, vega exposure
5. Open Interest & Volume Based Strategies
Breakout Strategy: Detect long buildup or short covering using OI change + price movement
Algo filters trades: Where volume > 2x average and OI shows new positions being created
5. Platforms and Tools for Algo Options Trading
Even retail traders can now access automation tools without knowing how to code.
No-Code Platforms:
Tradetron
Streak by Zerodha
AlgoTest
Quantiply
These platforms offer:
Drag-and-drop strategy builders
Live market connections
Backtesting features
Broker integrations
Custom Python/C++ Based Systems
Used by advanced retail or prop firms. These offer:
Full control and flexibility
Integration with APIs like:
Zerodha Kite Connect
Upstox API
Interactive Brokers
Summary and Final Thoughts
Algo-based options trading is not just for hedge funds anymore. With accessible platforms, cloud computing, and APIs, even retail traders can build, test, and deploy automated strategies.
However, success in algo trading depends on:
Solid strategy design (math + market logic)
Risk management above all
Continuous monitoring and iteration
Avoiding over-reliance on backtests
Staying compliant with broker and SEBI norms
BTCUSD-Eyes 120000 after Liquidity Sweep & Support RetestPrice action on the 15-min chart shows Bitcoin forming a potential bullish continuation after a liquidity sweep below short-term support. Here’s what stands out:
🔹 Triple Tap Support: Price respected a key zone multiple times, hinting at strong buyer interest.
🔹 Post-Sweep Reaction: Sharp recovery followed by consolidation suggests demand re-entered the market.
🔹 SignalPro Context: Leola Lens™ SignalPro highlighted key zones (yellow + orange), offering caution and trend context.
🔹 Projected Path: With price stabilizing above the reclaimed zone, potential upside target aligns with the 120000 region.
📌 Educational Note:
This setup highlights how liquidity collection below support and subsequent recovery can offer clues to short-term directional intent. Always manage risk based on volatility and session context.

DOGE Long Swing Setup – Institutional Narrative Heating UpThe Dogecoin narrative is back in focus! Bit Origin ( NASDAQ:BTOG ) is raising $500M to build one of the world’s largest DOGE treasuries—becoming the first U.S.-listed company to treat CRYPTOCAP:DOGE as a core asset. With institutional interest rising, DOGE could see renewed momentum. Our last trade surged 50%—here’s the next entry:
📌 Trade Setup:
• Entry Zone: $0.20 – $0.21
• Take Profit Targets:
o 🥇 $0.23 – $0.24
o 🥈 $0.27 – $0.28
• Stop Loss: Daily close below $0.18
#crypto #DOGE #BTOG
