Relief Rally or Trap Before the Next Big Drop? BTC/USD PLAN – MAY 24 | Relief Rally or Trap Before the Next Big Drop?
Bitcoin is showing signs of a technical rebound after rejecting from the 111k region. However, macroeconomic factors and investor sentiment are sending mixed signals that require caution moving forward.
🌍 MACRO OVERVIEW:
The US Dollar remains strong, supported by persistent high Treasury yields — putting pressure on risk assets like crypto.
New tariff tensions between the U.S. and China are shaking markets and tightening global liquidity, which may weigh on speculative assets including Bitcoin.
BTC ETF inflows have declined for the second week in a row, suggesting institutions are becoming more cautious after the recent rally.
📈 TECHNICAL OUTLOOK (H1 Chart):
After bouncing from the key support around 106,800, BTC has initiated a mild retracement toward the 0.5 Fibo at 109,300.
Short-term bullish target lies at the 110,000–111,947 area — a heavy confluence zone of supply, trendline resistance, and previous bull trap zone.
A failure to break 111,900 may lead to a strong correction back to 106,800, and if that fails, a deeper drop toward 102,567 is likely — a high-liquidity demand zone.
📌 TRADE SETUPS:
🔵 SHORT-TERM BUY SCALP:
Entry: 108,300 – 108,500
Stop Loss: Below 107,900
Take Profit: 109,300 – 110,000 – 111,947
Look for bullish reaction if BTC forms a higher low and stays inside the channel.
🔻 MAJOR SELL SCENARIO:
Entry: 111,800 – 112,000
Stop Loss: Above 112,300
Take Profit: 110,000 – 108,500 – 106,800 – 102,500
Favor short setups if price fails at resistance and shows rejection with lower volume or bearish candles.
⚠️ Caution:
Bitcoin is at a critical resistance zone. A breakout may trap late longs before a deep correction. If price breaks and holds above 112k, the bullish trend may resume toward new highs.
🎯 Stick to your zones. Don’t chase price. Use proper risk control.
Crypto

When Altcoins Bounce From 99% Down... They Don’t Just Recover, When Altcoins Bounce From 99% Down... They Don’t Just Recover, They Moon
Structure Analysis:
SEED_DONKEYDAN_MARKET_CAP:ILV has been in a multi-year downtrend but is now showing signs of a potential macro reversal.
Accumulation Zone:
Price has been consolidating between $9.63 – $13.75, forming a strong base. Multiple rejections from this zone suggest heavy demand and smart money accumulation.
Downtrend Break Incoming:
A breakout above the descending resistance trendline would confirm a trend reversal and open the gates for a major rally.
Key Resistance Levels Ahead: $71.32/$185.56/$322.15/$672.19 (Previous ATH)
Major Resistance Zone: $31.74 – $37 (expect some sell pressure here on the way up)
Trade Setup Idea (Mid to Long Term):
Entry Range: $11 – $14
Stop Loss: $9.63
Target: $31.74/$71.32/$185.56/$322.15/$672.19
Potential Gains:
▶️ 10x looks highly possible if momentum builds.
▶️ If ILV reclaims its previous ATH, returns could reach up to 180x
▶️ Already down ~99.5% from ATH — this makes it a high-risk, high-reward setup.
Yes, 180x sounds insane, and it nearly is—but this is crypto. Anything can happen. That said, high reward comes with high risk. Always DYOR (Do Your Own Research), manage your risk, and remember: This is not financial advice.

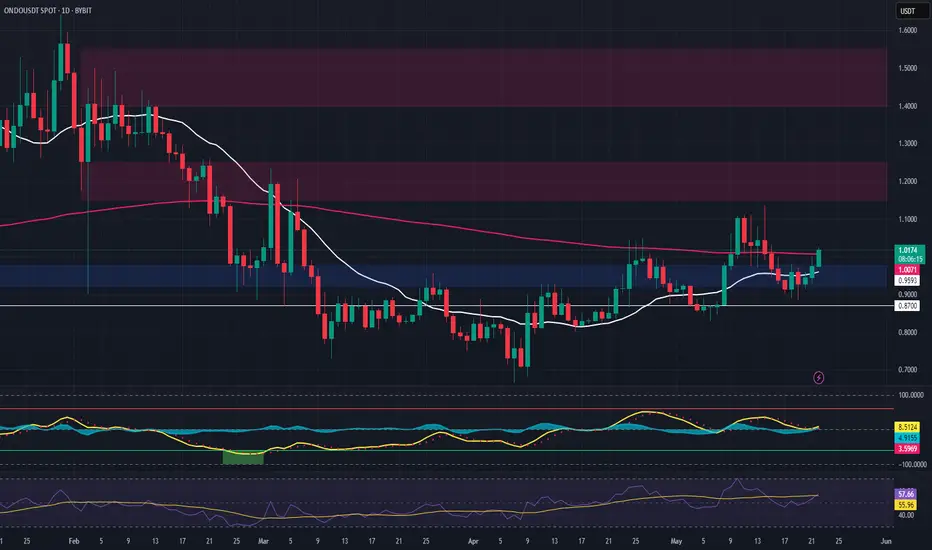
ONDO – Long Spot Trade Setup from 20-Day SMA ReclaimONDO is showing early signs of strength by reclaiming the 20-day SMA following a successful retest of both the SMA and key horizontal support. This confluence signals a potential continuation of the uptrend and presents an attractive long spot opportunity.
🔹 Entry Zone:
$0.92 – $0.97 (support + 20-day SMA confluence)
🎯 Take Profit Targets:
🥇 $1.15 – $1.25 (recent high & resistance cluster)
🥈 $1.40 – $1.55 (macro target zone, possible extension if trend strengthens)
🛑 Stop Loss:
Just below $0.87 (tight invalidation if price breaks below local structure and SMA)
ETH Technicals Hint at Breakout — All Eyes on the 2588 Level📊 Cycle Structure:
HWC (Higher Wave Cycle): Bullish 🔼
MWC (Middle Wave Cycle): Ranging 🔁
LWC (Lower Wave Cycle): Bullish 🔼
The overall market structure leans bullish. With both HWC and LWC pointing upward, the directional pressure favors long setups.
❗️If you're looking for a short position, this analysis isn't for you.
🔍 Price Action Structure & Entry Scenario:
A strong resistance zone at 2588 has already been tested four times.
A fifth touch often increases the probability of a breakout — especially in a bullish-biased environment.
A 1H ascending trendline sits right below the resistance, acting as dynamic support.
📌 My Strategy: Pre-Breakout Entry
My approach focuses on entering before a confirmed breakout — riding the early wave toward resistance.
This includes watching for compression, weak selling volume, and bullish candlestick structures.
⚠️ This method is inherently riskier, and the chance of getting stopped out is higher, so solid risk management is essential.
👥 Based on trading style, here’s how different traders might approach this:
🔁 Reactive traders can wait to see how price reacts at the trendline.
🔓 Breakout traders should wait for a confirmed 15min or 1H close above 2588.
🐳 Those expecting a sharp whale-driven move may consider placing a Buy Stop Order above resistance.
🎯 Entry Levels & Risk Management:
Aggressive Entry: Pre-breakout trigger near 2588 (riskier).
Conservative Entry: Wait for a confirmed breakout candle above 2588.
Stop-loss idea: Below the 1H trendline, acting as a dynamic support.
📉 Invalidation Level:
My bullish outlook holds as long as we’re above 2387.
If price closes below that, I’ll re-evaluate for a possible short — but until then, the focus remains on the long side.
💬 Want me to analyze a specific coin?
Drop it in the comments — I’ll review and pick one for the next post.
⚠️ Without proper risk management, you're just a ticking time bomb.
— PXA 📊

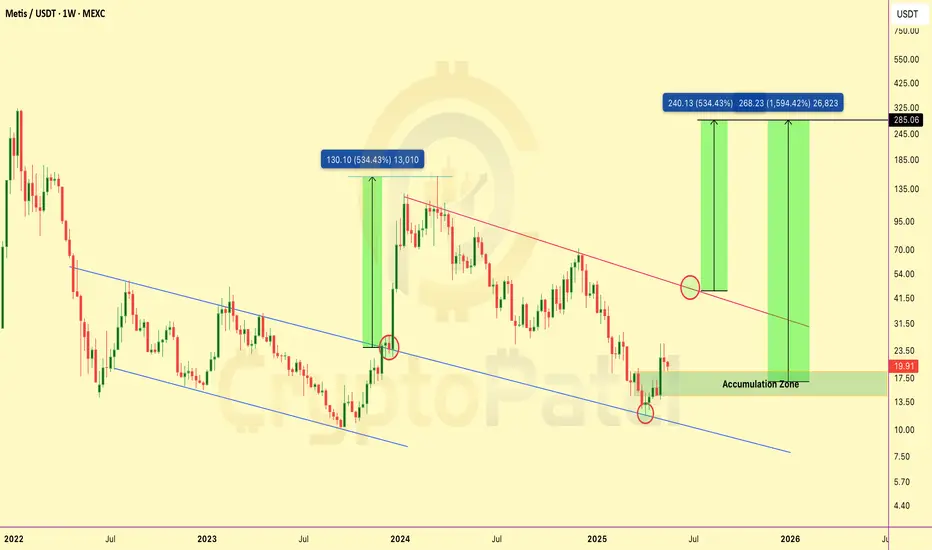
This Hidden Gem Could 10x–20x — Why I’m Buying $METIS Now!This Hidden Gem Could 10x–20x — Why I’m Buying SEED_DONKEYDAN_MARKET_CAP:METIS Now! 🚀
SEED_DONKEYDAN_MARKET_CAP:METIS Long-Term Accumulation Plan
SEED_DONKEYDAN_MARKET_CAP:METIS is showing strong long-term potential — I’m starting to buy small amounts now and planning heavier buys in the accumulation zone between $19–$14.
If price holds above $14, we could see a major rally ahead with potential 10x–20x returns.
Long-Term Targets: $50 / $100 / $150 / $200 / $250 / $300
Why I’m Bullish on SEED_DONKEYDAN_MARKET_CAP:METIS :
• Ethereum Layer-2 Rollup focused on decentralization
• Plans to decentralize its sequencer for more security
• Backed by a $100M Ecosystem Fund to attract developers
• Co-founded by Vitalik Buterin’s mother, Natalia Ameline
• Gaining momentum from recent ecosystem news
Reminder: Crypto is highly volatile — always use proper risk management and understand the risk/reward.
📌 Not financial advice — Do your own research.
Option TradingIn trading, an option is a contract that gives the holder the right, but not the obligation, to buy or sell an underlying asset (like a stock, ETF, or commodity) at a predetermined price (the strike price) before a specific date (the expiration date). There are two main types: call options (the right to buy) and put options (the right to sell).

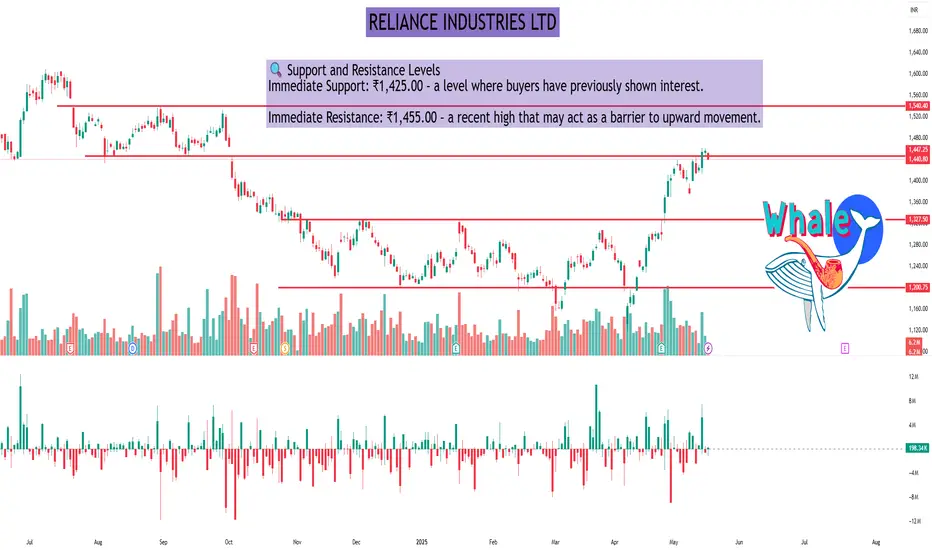
RELIANCE INDUSTRIES LTDAs of the close on Monday, May 19, 2025, Reliance Industries Ltd (NSE: RELIANCE) traded at ₹1,440.80, reflecting a 1.07% decrease from the previous session.
📊 Daily Technical Overview
Price Action:
Opening Price: ₹1,452.10
Day's Range: ₹1,438.20 – ₹1,454.60
52-Week Range: ₹1,114.85 – ₹1,608.80
Volume: Approximately 6.2 million shares traded, below the 50-day average of 8.4 million, indicating reduced market activity.
Technical Indicators:
Relative Strength Index (RSI): 69.84 – approaching overbought territory, suggesting caution.
Moving Average Convergence Divergence (MACD): Bullish crossover, indicating potential upward momentum.
Stochastic Oscillator: 76.17 – in the overbought zone, which may precede a price correction.
Average Directional Index (ADX): Indicates a strong trend, supporting the current price movement.
🔍 Support and Resistance Levels
Immediate Support: ₹1,425.00 – a level where buyers have previously shown interest.
Immediate Resistance: ₹1,455.00 – a recent high that may act as a barrier to upward movement.
🔭 Outlook
The technical indicators suggest that Reliance Industries Ltd is experiencing a strong bullish trend. However, the RSI and Stochastic Oscillator indicate that the stock is nearing overbought conditions, which could lead to a short-term consolidation or minor correction. Investors should monitor the support and resistance levels closely and consider the reduced trading volume, which may affect the strength of the current trend.
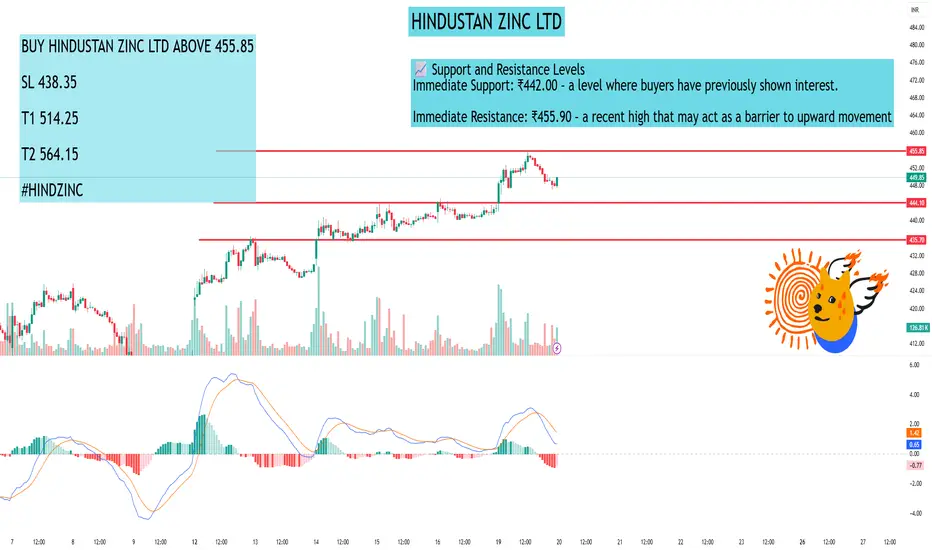
HINDUSTAN ZINC LTDAs of the close on Monday, May 19, 2025, Hindustan Zinc Ltd (NSE: HINDZINC) was trading at ₹448.20, reflecting a 1.33% increase from the previous session.
📊 15-Minute Timeframe Technical Overview
Analyzing the 15-minute chart, the stock exhibits a mild bullish trend:
Price Action: The current price is ₹428.25.
Moving Averages:
The 5-period Exponential Moving Average (EMA) is at ₹440.66.
The 15-period EMA stands at ₹435.01.
The 50-period EMA is at ₹435.91.
The 100-period EMA is at ₹446.19.
The 15-period EMA trending above the 50-period EMA indicates a bullish crossover.
Trend Analysis: The 5 and 15 EMAs are on an upward trajectory, suggesting a mild bullish sentiment in the short term.
🔍 Technical Indicators
Relative Strength Index (RSI): The RSI is approximately 56.70, indicating a neutral momentum without being overbought or oversold.
Moving Average Convergence Divergence (MACD): The MACD is at 0.811, suggesting a bullish crossover.
Average Directional Index (ADX): The ADX is at 13.22, indicating a weak trend strength.
Stochastic Oscillator: The Stochastic Oscillator is at 63.96, pointing to neutral momentum.
Indicator: The supertrend is at ₹406.99, acting as a support level.
Parabolic SAR (PSAR): The PSAR is at ₹400.77, indicating an upward trend.
📈 Support and Resistance Levels
Immediate Support: ₹442.00 – a level where buyers have previously shown interest.
Immediate Resistance: ₹455.90 – a recent high that may act as a barrier to upward movement.
🔭 Outlook
The current indicators suggest a cautious approach:
If the price sustains above ₹442.00, there may be potential for a rebound towards ₹455.90.
Conversely, a drop below ₹442.00 could lead to further declines, possibly testing lower support levels.
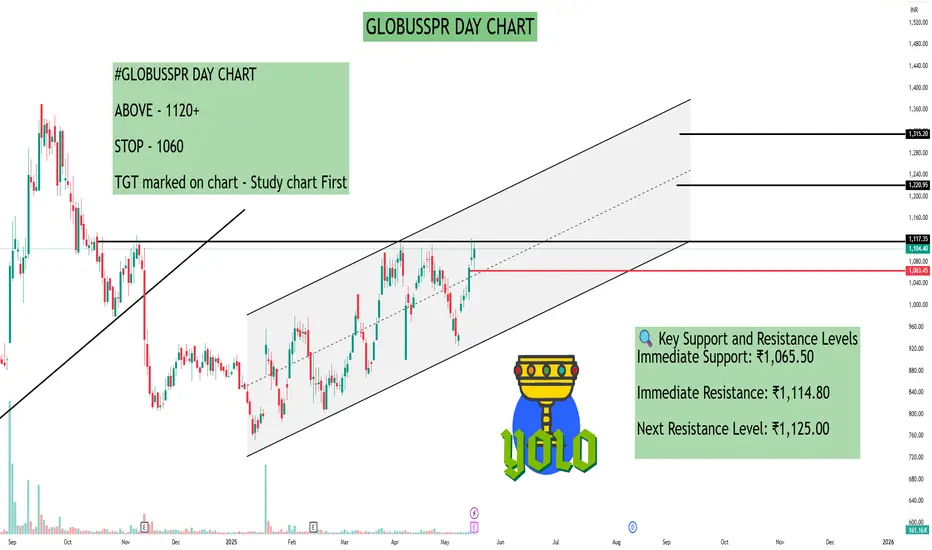
GLOBUSSPR DAY CHARTAs of the close on Monday, May 19, 2025, Globus Spirits Ltd (NSE: GLOBUSSPR) traded at ₹1,104.40, reflecting a 1.62% increase from the previous session.
📊 Daily Technical Overview
Price Action:
Day's Range: ₹1,065.50 – ₹1,114.80
52-Week Range: ₹670.00 – ₹1,369.75
Volume: 161,165 shares traded
Technical Indicators:
Relative Strength Index (RSI): 61.68 – indicating neutral to slightly bullish momentum.
Moving Average Convergence Divergence (MACD): 6.03 – suggesting a bullish crossover.
Average Directional Index (ADX): 15.29 – indicating a weak trend strength.
Stochastic Oscillator: 62.44 – pointing to neutral momentum.
Indicator: ₹957.02 – acting as a support level.
Parabolic SAR (PSAR): ₹927.02 – indicating an upward trend.
🔍 Key Support and Resistance Levels
Immediate Support: ₹1,065.50
Immediate Resistance: ₹1,114.80
Next Resistance Level: ₹1,125.00
📈 Outlook
The technical indicators suggest that Globus Spirits Ltd is experiencing a mild bullish trend. The RSI and MACD indicate positive momentum, while the ADX suggests that the trend strength is currently weak. If the stock maintains its position above the immediate support level of ₹1,065.50, it may attempt to break through the resistance at ₹1,114.80. A successful breakout could lead to testing the next resistance level at ₹1,125.00.
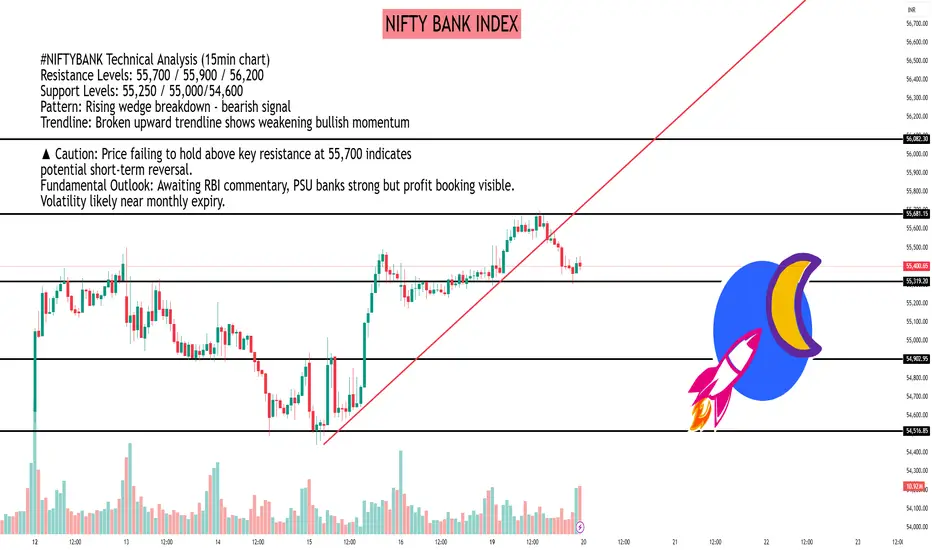
NIFTY BANK INDEX #NIFTYBANK Technical Analysis (15min chart)
Resistance Levels: 55,700 / 55,900 / 56,200
Support Levels: 55,250 / 55,000/54,600
Pattern: Rising wedge breakdown - bearish signal
Trendline: Broken upward trendline shows weakening bullish momentum
▲ Caution: Price failing to hold above key resistance at 55,700 indicates
potential short-term reversal.
Fundamental Outlook: Awaiting RBI commentary, PSU banks strong but profit booking visible. Volatility likely near monthly expiry.
Support and Resistance part 1In stock market technical analysis, support and resistance are certain predetermined levels of the price of a security at which it is thought that the price will tend to stop and reverse. These levels are denoted by multiple touches of price without a breakthrough of the level.

Support and Resistance part 2Support is a price point below the current market price that indicate buying interest. Resistance is a price point above the current market price that indicate selling interest. S&R can be used to identify targets for the trade. For a long trade, look for the immediate resistance level as the target.

SUZLON ENERGY LTDSUZLON
This is not a buy or sell recommendation only for educational purposes and I am not a SEBI registered.
Entry: Above 61.2 on monthly breakout.
Target: 61.5-65.45-70.20-72.25-82.35-86.4
If closed above 87 on monthly candle can touch 90-100
Stoploss: 58
Suzlon Energy Limited, a prominent player in India's renewable energy sector, has demonstrated significant operational progress in recent quarters. However, certain financial metrics and market dynamics warrant a cautious approach.
Financial Performance Overview
Revenue and Profitability:
In Q3 FY25, Suzlon reported a revenue of ₹2,969 crore, marking a 91% increase year-over-year. EBITDA more than doubled to ₹500 crore, with an EBITDA margin of 16.8%.
Despite this quarterly growth, the FY24 annual report indicates a 77.1% decline in net profit year-over-year, with net profit margins decreasing from 48.4% in FY23 to 10.1% in FY24.
Balance Sheet and Debt Position:
Suzlon has made strides in deleveraging, with total liabilities decreasing by 26.34% to ₹32.59 billion in 2024. Cash and short-term investments increased by 18.48% to 4.35 billion.
The debt-to-equity ratio stands at a conservative 0.06, indicating a strong balance sheet position.
Return Metrics:
Return on Capital Employed (ROCE) is reported at 24%, surpassing the industry average of 18%.
Return on Equity (ROE) is projected to improve to 28.6% by FY27.
Operational Highlights
Order Book and Capacity Expansion:
As of May 2024, Suzlon's order book expanded to 3.3 GW, a significant increase from 652 MW in FY23.
Notable contracts include a 402 MW project with Juniper Green Energy and a 551.25 MW project for the Aditya Birla Group.
Technological Advancements:
The $144 wind turbine, with a hub height of 160 meters, is India's tallest and delivers 40-43% higher generation than previous models.
▲ Risks and Considerations
Valuation Concerns:
The stock's P/E ratio stands at 64.94, which is higher than industry peers like Vestas (25.3) and Siemens Gamesa (18.7), suggesting potential overvaluation.
Market Volatility:
The stock experienced a 40% decline from its 52-week high, attributed to market- wide corrections and profit-booking after a substantial rally.
Corporate Governance:
The resignation of a key managerial person and warnings from NSE and BSE over regulatory non-compliance have raised concerns about corporate governance.
Insider Activity and Market Sentiment
There is no publicly available information confirming insider trading or undisclosed material events related to Suzlon Energy. However, the company's recent performance and strategic initiatives have garnered positive attention from investors and analysts.
Conclusion
Suzlon Energy exhibits strong operational momentum, a robust order book, and technological innovation in the renewable energy sector. While financial metrics show improvement, valuation concerns and corporate governance issues necessitate a cautious investment approach. Investors should monitor the company's execution of its order book, adherence to regulatory norms, and market dynamics closely.

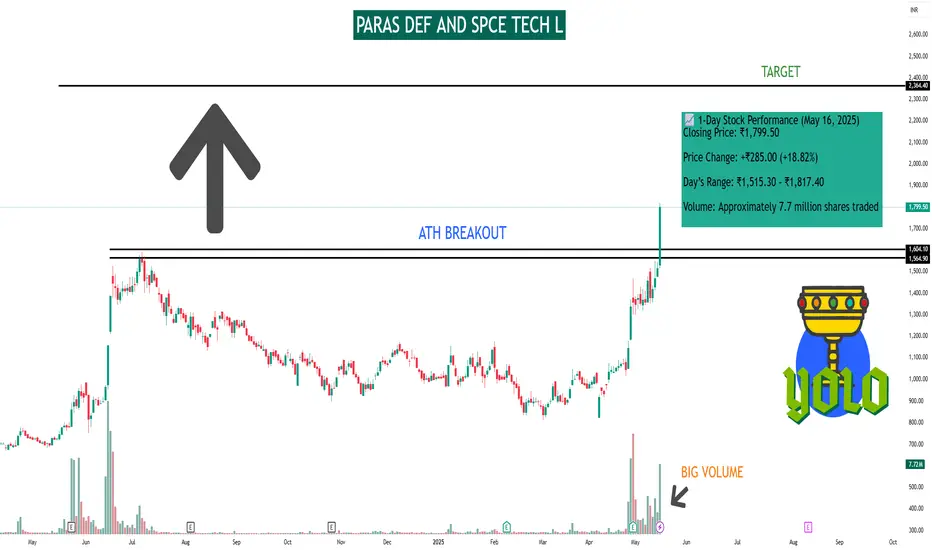
PARAS DEF AND SPCE TECH LAs of May 16, 2025, Paras Defence and Space Technologies Ltd (NSE: PARAS) experienced a significant surge in its stock price.
📈 1-Day Stock Performance (May 16, 2025)
Closing Price: ₹1,799.50
Price Change: +₹285.00 (+18.82%)
Day’s Range: ₹1,515.30 – ₹1,817.40
Volume: Approximately 7.7 million shares traded
📊 Recent Performance Overview
1-Week Gain: +32.39%
1-Month Gain: +73.35%
Year-to-Date (YTD) Return: +63.05%
📰 Key Developments
Stock Split Announcement: The company declared a 1:2 stock split, enhancing liquidity and making shares more affordable for investors.
Strong Q1 Financials: Paras Defence reported a 97% year-over-year increase in net profit for Q1 FY25, indicating robust operational performance.
Sectoral Momentum: The defense sector has been on an upswing, with Paras Defence among the leading gainers amid a broader rally in defense stocks.
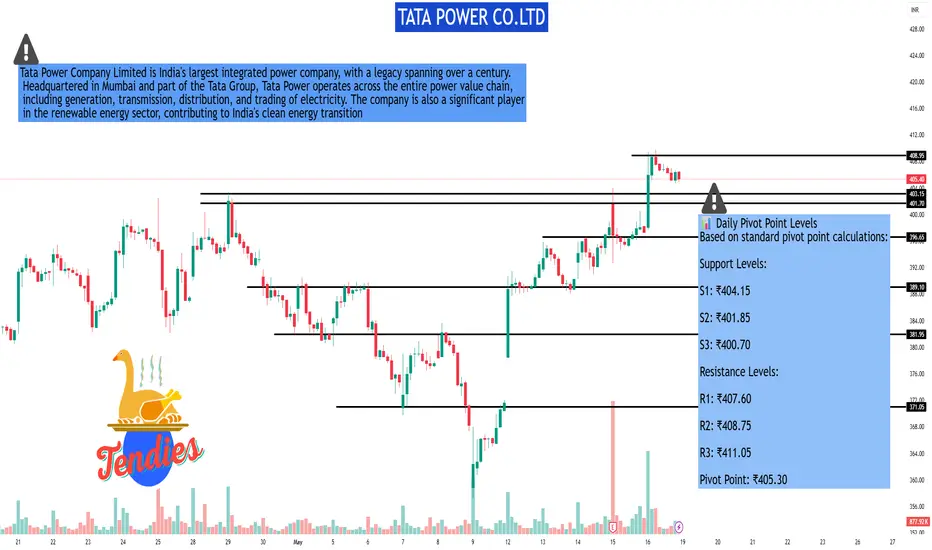
TATA POWER CO.LTDAs of May 16, 2025, Tata Power Co. Ltd. (NSE: TATAPOWER) closed at ₹405.80, marking a 1.97% increase for the day.
📊 45-Minute Timeframe Technical Analysis
Analyzing the 45-minute chart provides insights into the stock's short-term movements.
📈 Moving Averages
50 EMA: ₹350.38
200 EMA: ₹355.60
Signal: The 50 EMA is below the 200 EMA, indicating a mild bearish trend.
📈 Simple Moving Averages (SMA)
15 SMA: ₹358.10
50 SMA: ₹344.82
Signal: The 15 SMA is above the 50 SMA, suggesting a mild bullish trend.
🔍 Summary
Current Price: ₹405.80
Short-Term Trend: Mixed signals with a mild bearish indication from EMA crossover and a mild bullish indication from SMA crossover.
Institution Trading part 4Institutional trading is the buying and selling of financial assets by large organizations or institutions, such as pension funds, mutual funds, and insurance companies, on behalf of their clients or members. These institutions often manage large pools of capital, making them significant players in the financial markets.

Technical Concept A "technical concept" refers to a term or idea that has a specific, often specialized, meaning within a particular field or discipline, especially in technology or engineering. These concepts are often used to describe complex systems, processes, or principles. They can be fundamental to understanding a field or be more specific, like a particular algorithm or software library.

EOS Super bullish toward $10 because WLFI Buying$EOS/USDT Weekly Technical Breakdown
🔰 Price Action:
EOS is currently trading at $0.85, following a rejection from the key weekly resistance zone between $1.24–$1.31. This zone has acted as a historical supply area, and the failure to break above it has triggered a short-term corrective move.
🔰 Bullish Development:
EOS has recently broken out of a multi-year falling wedge pattern, signaling a potential long-term trend reversal. Post-breakout, the asset is now retesting lower levels — a common occurrence before continuation.
🔰 Key Demand Zones:
Primary Accumulation Zone: $0.83–$0.69
Major Weekly Support: $0.47–$0.40
These zones coincide with historical consolidation and low-volume nodes, making them ideal for long-term positioning.
🔰 Institutional Interest:
Trump-backed World Liberty Financial has accumulated 3.64M NYSE:EOS for 3M USDT, with an average entry at $0.824 — aligning perfectly with the current range. This reinforces the strength of the accumulation zone and may signal smart money inflow.
🔰 Upside Resistances to Monitor: $2.87 / $5.03 / $10.57 / ATH: $14.90
NYSE:EOS is showing signs of structural reversal on the HTF. As long as the price holds above the $0.69 base, bullish continuation remains valid. A reclaim and weekly close above $1.31 could trigger the next impulsive leg toward $5+.

BTC/USD DAILY PLAN – Will Bitcoin Hit 110K Before Reversing?BTC/USD DAILY PLAN – Will Bitcoin Hit 110K Before Reversing?
After a strong bullish impulse, BTC is now consolidating in a tight range between 103K–106K on the H4 chart. The ascending parallel channel remains intact, but bullish momentum is fading — a sign of potential distribution at the top.
🧠 Macro Context
BTC pumped recently thanks to ETF news and institutional inflows.
However, volume is decreasing, suggesting smart money may be offloading.
DXY and U.S. bond yields are ticking up → this could add pressure on BTC in the short term.
📊 Technical Outlook (H4 Chart)
BTC remains inside an ascending channel. Key levels to watch:
🔺 Resistance:
106,000 – local range high (H4)
110,576 – extended target if price breaks out
🔻 Support:
101,775 – bottom of current range; a breakdown here confirms weakness
94,473 – strong demand zone + EMA200
84,371 – key structural support zone if deeper correction occurs
⚠️ BTC may fake a rally toward 110K and then reverse sharply if broader macro conditions worsen.
🎯 Trading Scenarios
🔹 SCALP BUY:
Entry: 101,800 – 102,000
Stop-Loss: 100,800
Take-Profits: 103,200 → 104,000 → 105,000 → 106,000
Only enter long if price holds above 101.7K and shows strong rejection candles.
🔸 SELL ZONE:
Entry: 110,000 – 110,500
Stop-Loss: 111,200
Take-Profits: 107,000 → 105,000 → 101,775 → 94,473
Watch for exhaustion or false breakout patterns at this psychological zone.
🟢 LONG-TERM BUY ZONE:
Entry: 94,500 – 94,000
Stop-Loss: 92,500
Take-Profits: 96,000 → 98,000 → 100,000 → 103,000
Ideal for swing entries if BTC retraces into the broader demand zone.
⚠️ Key Notes:
BTC is showing signs of “rise slowly – dump fast” behavior.
Keep close watch on 101,775 – a decisive level for intraday direction.
No Fed rate cuts in sight → big money may still stay cautious.
✅ Conclusion:
Stick to trading range setups: BUY at channel base – SELL at distribution zones
Avoid FOMO and only enter trades after clear price action confirmation.
Risk management is essential during this high-trap environment.

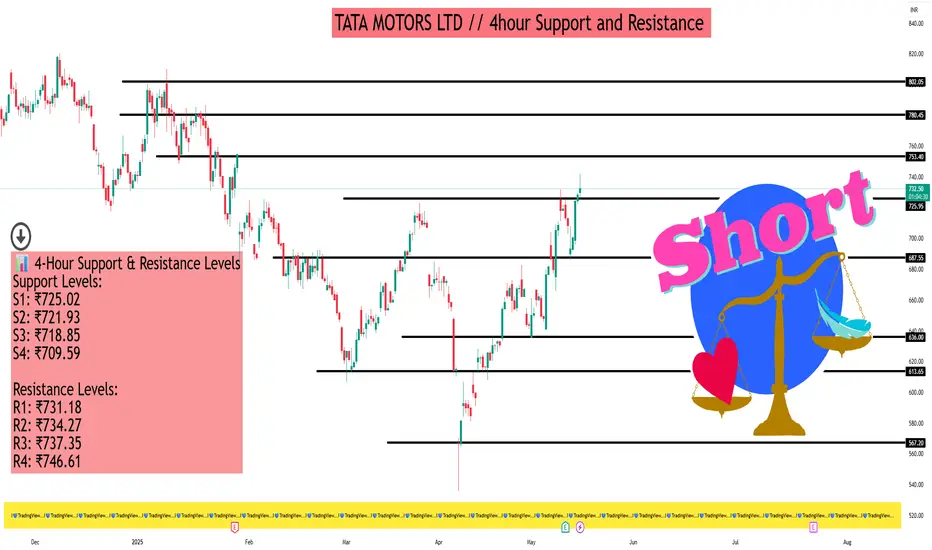
TATA MOTORS LTD // 4hour Support and Resistance As of May 16, 2025, Tata Motors Ltd. (NSE: TATAMOTORS) is trading at approximately ₹735.00. Here's a detailed analysis of its support and resistance levels on the 4-hour timeframe, along with insights from technical indicators and chart patterns.
📊 4-Hour Support & Resistance Levels
Support Levels:
S1: ₹725.02
S2: ₹721.93
S3: ₹718.85
S4: ₹709.59
Resistance Levels:
R1: ₹731.18
R2: ₹734.27
R3: ₹737.35
R4: ₹746.61
These levels are derived from Camarilla pivot calculations and provide key price points where the stock may experience buying or selling pressure.
📈 Technical Indicators Overview
Relative Strength Index (RSI): 68.4 — approaching overbought territory, suggesting potential for a short-term pullback.
MACD (12,26): 8.69 — indicates bullish momentum.
Average Directional Index (ADX): 42.07 — reflects a strong trend strength.
Stochastic Oscillator: 76.29 — nearing overbought levels, which may signal a potential reversal.
Commodity Channel Index (CCI): 103.31 — suggests the stock is in a strong uptrend.
These indicators collectively point towards a bullish trend, but caution is advised due to overbought signals.
🔍 Chart Patterns & Price Action
Recent analyses indicate that Tata Motors has formed a Shark pattern, with potential resistance in the ₹850 to ₹900 range. Short-term targets include ₹700, ₹750, ₹780, ₹820, ₹860, and ₹900. A weekly candle close above ₹900 could signal further upside potential.
Additionally, Elliott Wave analysis suggests that the stock may have completed a Wave (5) near ₹1180, with a potential decline towards the ₹850 level as part of a corrective phase.
🧭 Trading Strategy Insights
Bullish Scenario: If the stock sustains above ₹737.35 (R3), it may target higher resistance levels, with ₹746.61 (R4) being a key level to watch.
Bearish Scenario: A break below ₹725.02 (S1) could lead to further downside, with support at ₹709.59 (S4) potentially being tested.
Advanced Divergence Strong divergence is the most reliable type of divergence, often signaling a significant reversal. It occurs when the price makes a new high or low, but the indicator fails to do so, indicating weakening momentum.

Database and Technical ConceptA database is a structured collection of data organized for efficient storage, retrieval, and management. It's typically controlled by a Database Management System (DBMS), which provides the tools for interacting with the database. Databases are fundamental to various applications, including online shopping, banking, and social media, enabling the storage and management of large amounts of data.

RSI Divergence part 2The relative strength index (RSI) is calculated using the following formula: RSI = 100 – 100 / (1 + RS) Where RS = Average gain of up periods during the specified time frame / Average loss of down periods during the specified time frame asset price is considered overbought (due for a correction) when RSI is above 70, and oversold (due for a rebound) when it is below 30. Some traders use more extreme levels (80/20) to reduce false readings.
In a strong uptrend, RSI will often reach 70 and beyond for sustained periods, and downtrends can stay at 30 or below for a long time. While general overbought and oversold levels can be accurate, they may not provide the most timely signals for trend traders.
