Database Trading part 2Trading data is typically collected from stock exchanges such as the New York Stock Exchange (NYSE) or NASDAQ. This can be a useful source for trades that are made over the listed exchanges and can provide many different data poitns, such as trade prices and times.
Crypto

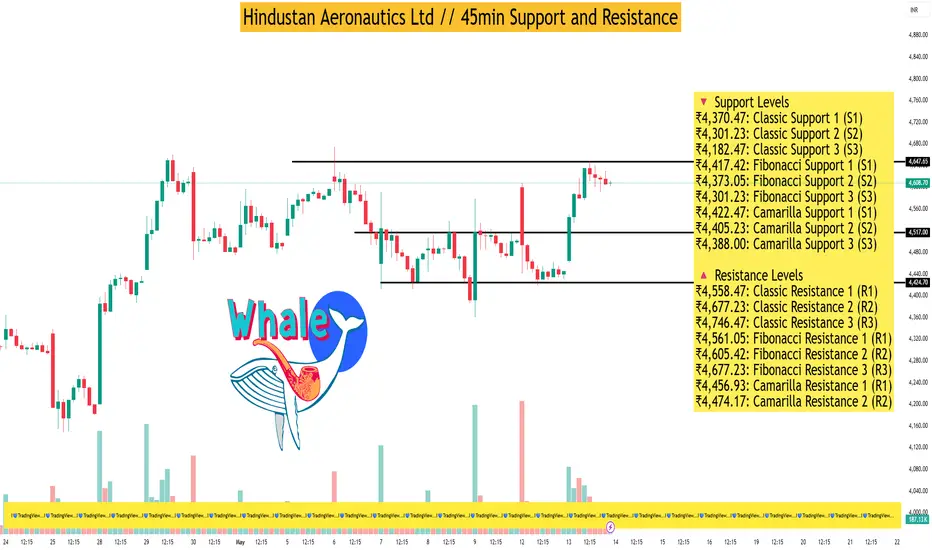
Hindustan Aeronautics Ltd // 45min Support and ResistanceAs of May 13, 2025, Hindustan Aeronautics Ltd (HAL) closed at ₹4,463.80, experiencing a slight decline of 0.668% for the day. Analyzing the 45-minute timeframe, the following support and resistance levels have been identified based on technical indicators and pivot point analyses:
🔻 Support Levels
₹4,370.47: Classic Support 1 (S1)
₹4,301.23: Classic Support 2 (S2)
₹4,182.47: Classic Support 3 (S3)
₹4,417.42: Fibonacci Support 1 (S1)
₹4,373.05: Fibonacci Support 2 (S2)
₹4,301.23: Fibonacci Support 3 (S3)
₹4,422.47: Camarilla Support 1 (S1)
₹4,405.23: Camarilla Support 2 (S2)
₹4,388.00: Camarilla Support 3 (S3)
🔺 Resistance Levels
₹4,558.47: Classic Resistance 1 (R1)
₹4,677.23: Classic Resistance 2 (R2)
₹4,746.47: Classic Resistance 3 (R3)
₹4,561.05: Fibonacci Resistance 1 (R1)
₹4,605.42: Fibonacci Resistance 2 (R2)
₹4,677.23: Fibonacci Resistance 3 (R3)
₹4,456.93: Camarilla Resistance 1 (R1)
₹4,474.17: Camarilla Resistance 2 (R2)
₹4,491.40: Camarilla Resistance 3 (R3)
📊 Technical Indicators Summary
Relative Strength Index (RSI): 44.65 – Neutral
MACD: -4.97 – Bearish
Average Directional Index (ADX): 20.58 – Indicates a weak trend
Stochastic Oscillator: 58.04 – Neutral
Rate of Change (ROC): 1.61 – Slightly bullish
Supertrend: ₹4,540.11 – Current trend indicator
Parabolic SAR (PSAR): ₹4,397.84 – Suggests potential reversal point
These indicators suggest a mildly bearish outlook in the short term, with the stock trading below key resistance levels. The RSI and Stochastic Oscillator indicate a neutral momentum, while the MACD points towards a bearish trend. The ADX value suggests that the current trend lacks strength.
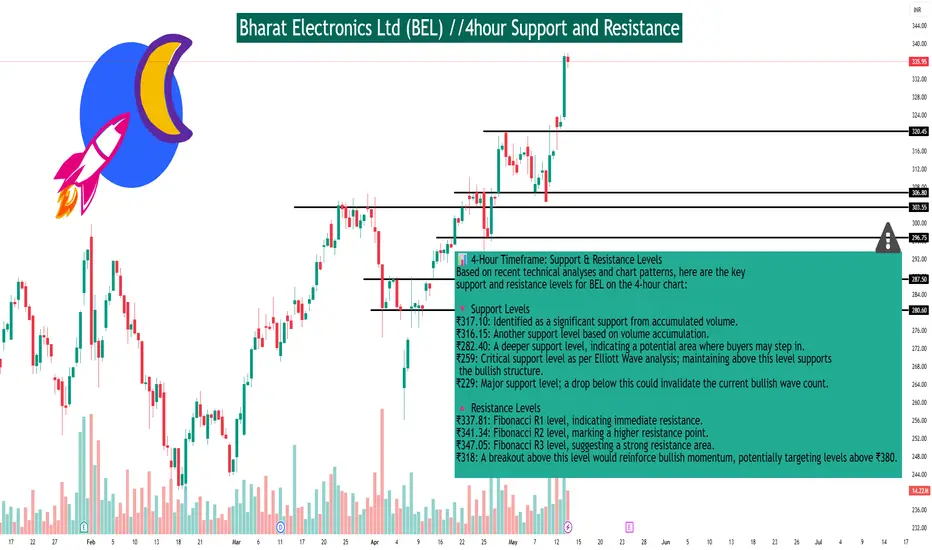
Bharat Electronics Ltd (BEL) //4hour Support and ResistanceAs of May 13, 2025, Bharat Electronics Ltd (NSE: BEL) closed at ₹335.75, reflecting a 4.21% gain for the day.
📊 4-Hour Timeframe: Support & Resistance Levels
Based on recent technical analyses and chart patterns, here are the key support and resistance levels for BEL on the 4-hour chart:
🔻 Support Levels
₹317.10: Identified as a significant support from accumulated volume.
₹316.15: Another support level based on volume accumulation.
₹282.40: A deeper support level, indicating a potential area where buyers may step in.
₹259: Critical support level as per Elliott Wave analysis; maintaining above this level supports the bullish structure.
₹229: Major support level; a drop below this could invalidate the current bullish wave count.
🔺 Resistance Levels
₹337.81: Fibonacci R1 level, indicating immediate resistance.
₹341.34: Fibonacci R2 level, marking a higher resistance point.
₹347.05: Fibonacci R3 level, suggesting a strong resistance area.
₹318: A breakout above this level would reinforce bullish momentum, potentially targeting levels above ₹380.
📈 Technical Outlook
BEL is currently in an upward trajectory within Minute Wave ((iii)) of Minor Wave 5, according to Elliott Wave analysis. To maintain this bullish structure, the price should stay above ₹259, with ₹229 being a critical support level. A breakout above ₹318 would confirm bullish control, with potential targets exceeding ₹380.
🔍 Additional Insights
Trend: The stock is in a strong rising trend in the short term, with expectations to rise 24.62% over the next 3 months, potentially reaching between ₹372.57 and ₹423.65.
Volatility: BEL has average daily movements with good trading volume, indicating medium risk.
Stop-Loss Recommendation: A suggested stop-loss is at ₹320.09, considering the medium daily movements and risk
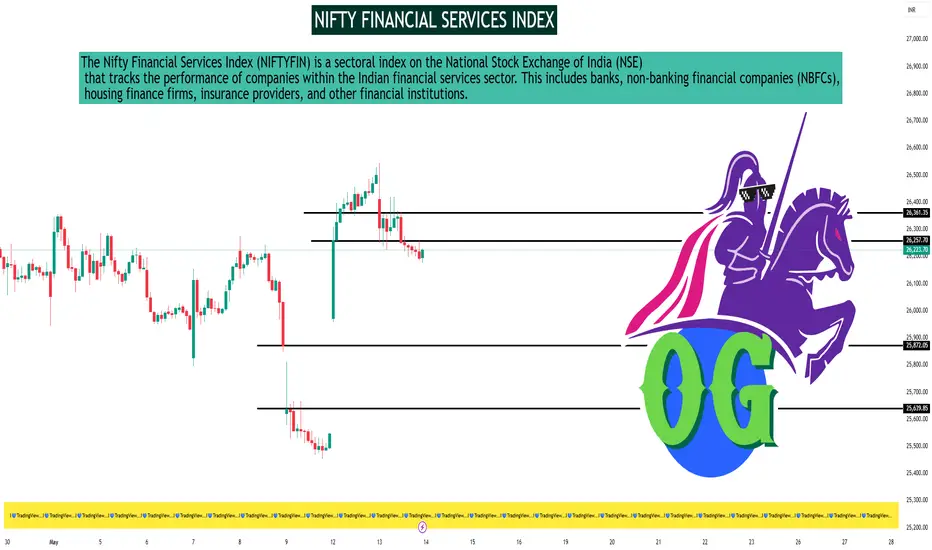
NIFTY FINANCIAL SERVICES INDEXAs of May 13, 2025, the Nifty Financial Services Index (NIFTYFIN) closed at 26,206.00, reflecting a decline of 1.10% for the day.
📊 30-Minute Timeframe Technical Overview
Key Support and Resistance Levels:
Support: Approximately 25,245.07
Resistance: Approximately 26,562.40
These levels are derived from recent price actions and are crucial for traders monitoring short-term movements.
Technical Indicators Summary:
Relative Strength Index (RSI 14): 52.33 – Neutral
Stochastic Oscillator (9,6): 98.35 – Overbought
Stochastic RSI (14): 2.60 – Oversold
MACD (12,26): 54.67 – Buy
Average Directional Index (ADX 14): 15.72 – Neutral
Williams %R: -1.94 – Overbought
Commodity Channel Index (CCI 14): -48.30 – Neutral
Average True Range (ATR 14): 166.29 – Indicates lower volatility
Rate of Change (ROC): 2.80 – Buy
Bull/Bear Power (13): -19.22 – Sell
Interpretation:
The technical indicators present a mixed outlook. While the MACD and ROC suggest bullish momentum, the overbought readings from the Stochastic Oscillator and Williams %R indicate potential for a short-term pullback. The neutral RSI and ADX values suggest a lack of strong directional momentum.
📈 Accessing 30-Minute Charts
For real-time 30-minute interval charts and advanced technical analysis tools, consider the following platforms:
TradingView – Nifty Financial Services Index
Investing.com – Nifty Financial Services Chart
Groww Terminal – Nifty Financial Services
These platforms offer customizable charts with various indicators to assist in your analysis.
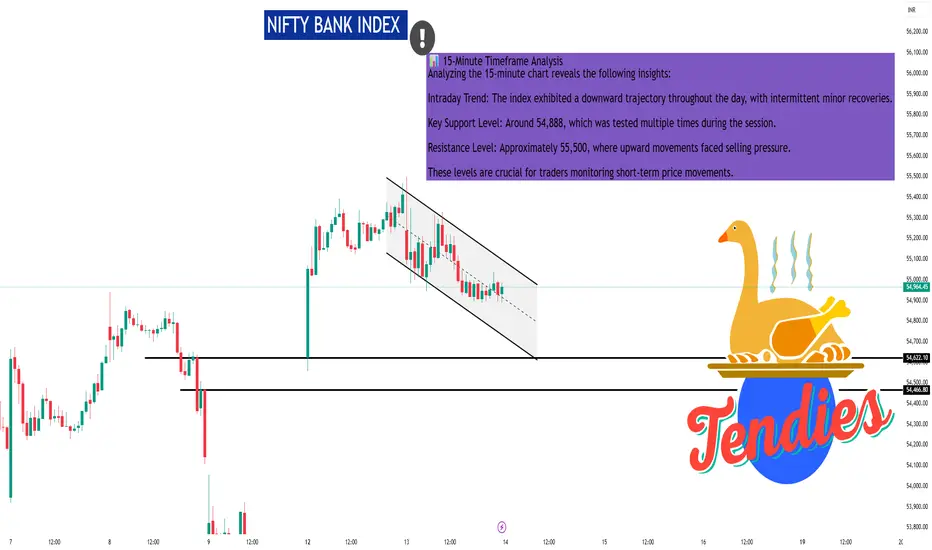
NIFTY BANK INDEX #NIFTYBANK Analysis (15-min Chart)
• Pattern: Falling Wedge () - Bullish reversal potential if breakout above resistance occurs.
• Resistance:
• 55,000 (psychological & upper wedge line)
• 55,400 - recent swing high
• Support:
54,800 wedge support zone
54,020 - previous gap-fill & demand zone
Note: Watch for volume spike & wedge breakout confirmation for long entry.
Candle Sticks Pattern part 1Candlestick patterns are a visual representation of price movements in financial markets, used in technical analysis to identify potential trend reversals or continuations. Each candlestick represents a specific time period and shows the opening, closing, high, and low prices during that period. By recognizing these patterns, traders can gain insights into market sentiment and make more informed trading decisions.

Institutional Trading part 6Institutional trading consists of the purchase and sale of financial assets by institutions through their traders. This definition of institutional trading applies to institutional equity trading, institutional stock trading, institutional options trading - any subcategory.

Institutional Trading part 3Institutional trading refers to the buying and selling of securities on behalf of large organizations or institutions, like mutual funds, pension funds, and insurance companies. Unlike retail traders who trade with their personal accounts, institutional traders manage money for others, often in large volumes. They may also have access to more complex financial instruments and investment opportunities.

Institutional Trading part 1Institutional trading consists of the purchase and sale of financial assets by institutions through their traders. This definition of institutional trading applies to institutional equity trading, institutional stock trading, institutional options trading - any subcategory.

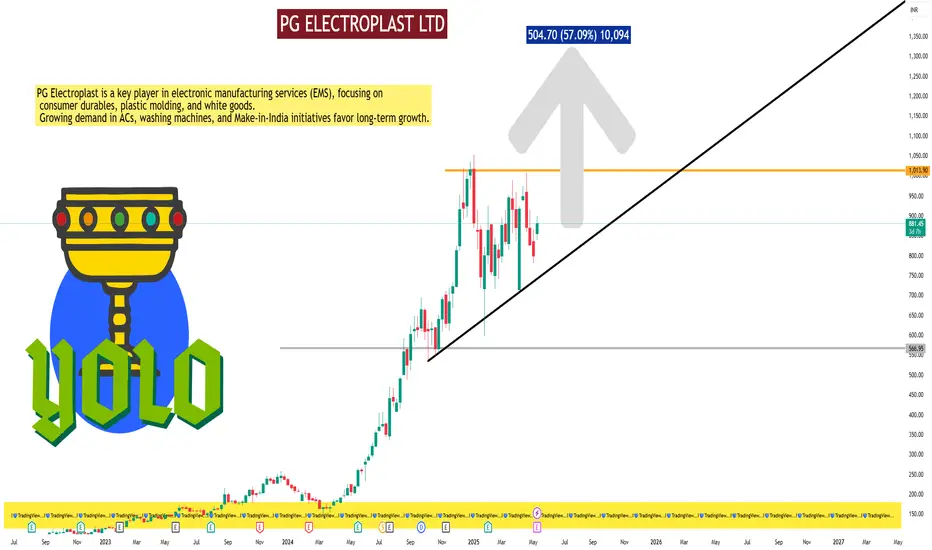
PG ELECTROPLAST LTD#PGEL
Stock: PG Electroplast Ltd
Strong Contender in EMS Space
Industry: Consumer Durables - Consumer Electronics
2 Current Price: *881
3 52W Low to High: 200 → 1,054
(+327%)
Recent Jump: +10.4% in 1 Day on High Volume
| 1-Year Target: 1,385 (Upside: 57%)
Fundamentals
Revenue Growth (YoY): 77%
Net Profit Growth (YoY): 113%
PEG Ratio: 0.8 (Undervalued Growth)
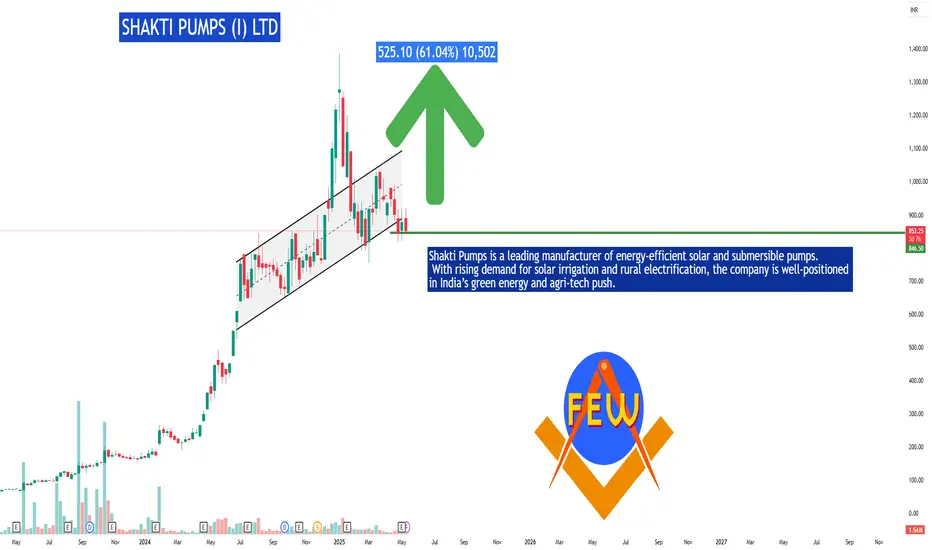
SHAKTI PUMPS (I) LTD #SHAKTIPUMP
Stock: Shakti Pumps (India)
Key Highlights:
CMP: *878.4
Target: 1,400 (61% Upside)
High-Growth Sector (Solar + Agri)
Attractive Valuation (P/E 25.9 vs peers)
Govt Policy Tailwinds (Renewable energy push)
Best for: Mid-term growth investors!
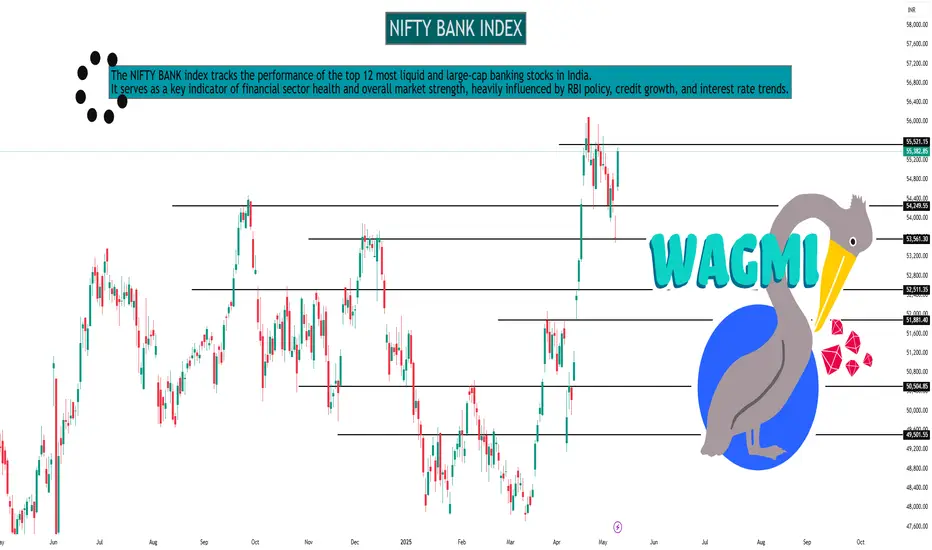
NIFTY BANK INDEXNIFTY BANK Index – 1-Day Timeframe Analysis
Technical Structure:
Trend: Bullish with minor consolidation near highs
Price Action: Sustaining above key moving averages; forming a bullish flag
Support Levels: 48,000 / 47,300
Resistance Levels: 49,500 / 50,000
Indicators:
RSI: Around 66 – healthy bullish momentum
MACD: Positive and widening – confirms upward trend
Volume: Steady on up-days; slight dip on pullbacks
Outlook:
Holding above 48,000 keeps bulls in control. A breakout above 49,500 may trigger fresh upside toward 50,500+. Watch for volatility around RBI or macro events.
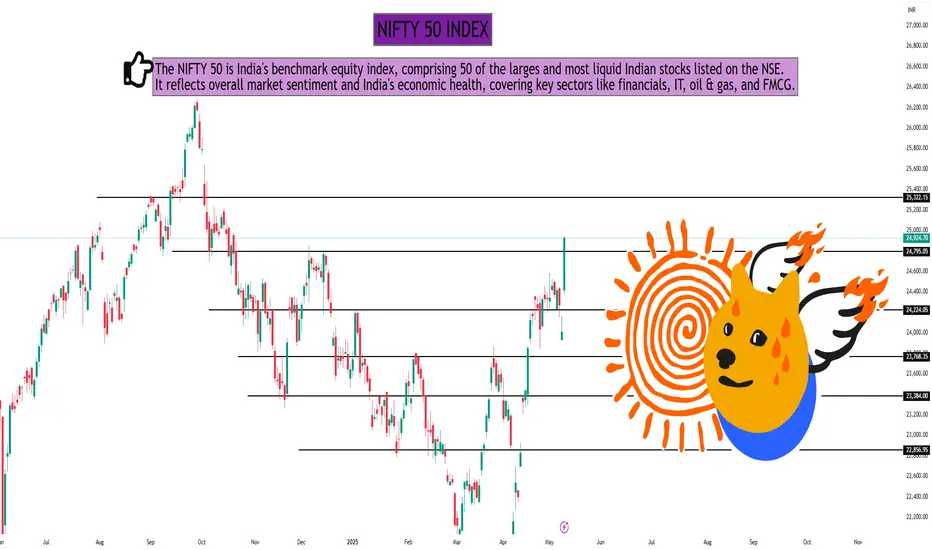
NIFTY 50 INDEX NIFTY 50 Index – 1-Day Timeframe Analysis
Technical Structure:
Trend: Uptrend intact; recent candles show strong bullish momentum.
Price Action: Forming higher highs; currently trading near resistance.
Support Levels: 22,500 / 22,200
Resistance Levels: 22,850 / 23,000
Indicators:
RSI: Around 68 – nearing overbought but still bullish
MACD: Positive crossover sustained
Volume: Rising on green candles – confirms buying interest
Outlook:
If NIFTY sustains above 22,850, a breakout toward 23,200 is likely. A rejection could lead to short-term pullback toward 22,500 support.
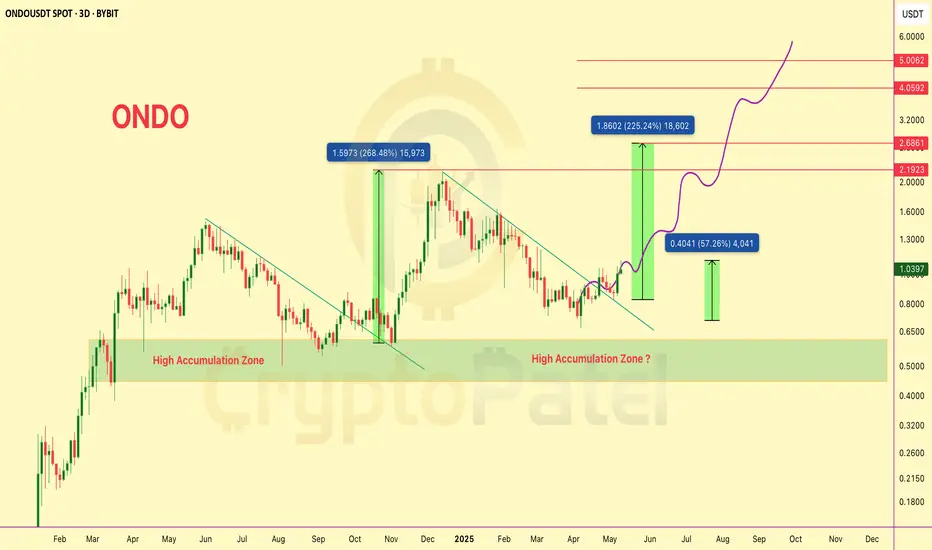
$ONDO/USDT Technical Analysis – Next Move Loading?$ONDO/USDT Technical Analysis – Next Move Loading?
#ONDO just broke out of a long-term descending trendline resistance and is now preparing for its next major wave.
We already shared the dip-entry below $0.80 — and it’s now up 57% from that zone!
Hope you're enjoying the ride.
Chart Highlights:
▶️ Clear breakout from multi-month downtrend.
▶️ Price bounced strongly from the High Accumulation Zone ($0.80-$0.50).
▶️ Previous breakouts resulted in +268% and +225% rallies.
▶️ Short-term move toward $1.30–$1.40 possible if support holds.
▶️ Targets: $2.19 → $2.68 → $4.05 → $5.00+
A healthy pullback or consolidation above $1 could offer the next breakout leg toward $2+.
Stay alert. Accumulation looks complete, and momentum is shifting bullish fast.
Instituional trading part 4Institutional trading refers to the buying and selling of securities on behalf of large organizations or institutions, like mutual funds, pension funds, and insurance companies. Unlike retail traders who trade with their personal accounts, institutional traders manage money for others, often in large volumes. They may also have access to more complex financial instruments and investment opportunities.

MACD (Moving Average Convergence Divergence) part 2MACD, short for Moving Average Convergence Divergence, is a momentum indicator used in technical analysis to identify potential trend changes in a financial market. It's calculated by comparing two exponential moving averages (EMAs) and is represented by a line, a signal line (which is a moving average of the MACD line), and optionally a histogram.

Advanced Database TradingAdvanced Database Trading refers to the use of sophisticated database technologies and techniques in the context of financial markets and trading activities. This includes using specialized databases for real-time data analysis, algorithmic trading, and risk management, as well as leveraging data mining and advanced analytical tools to identify patterns and make informed trading decisions.

Financial MarketsFinancial markets are platforms where individuals, companies, and governments trade financial instruments like stocks, bonds, currencies, and derivatives. These markets facilitate the flow of capital, enabling businesses to raise funds, individuals to invest, and governments to manage their finances.

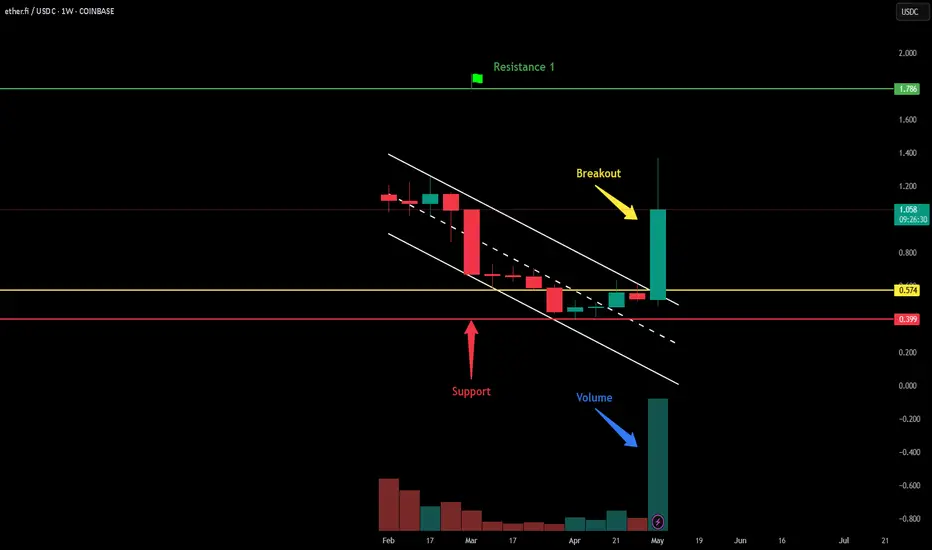
Breakout in ETHFI / TetherUS...Chart is self explanatory. Levels of breakout, possible up-moves (where crypto may find resistances) and support (close below which, setup will be invalidated) are clearly defined.
Disclaimer: This is for demonstration and educational purpose only. This is not buying or selling recommendations. Please consult your financial advisor before taking any trade.
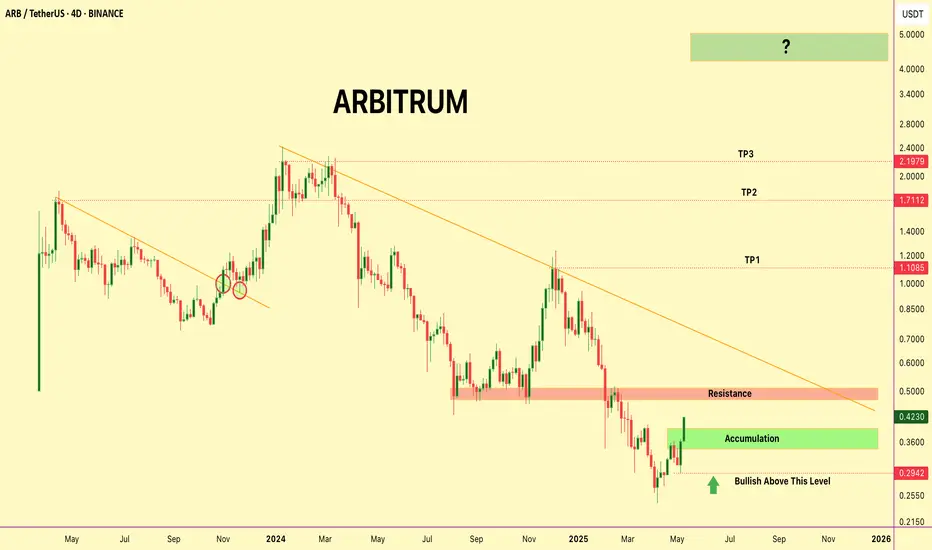
The Next Big L2 Gem? $ARB Is Breaking Out —Why It Could it 10x🚨 The Next Big L2 Gem? AMEX:ARB Is Breaking Out — Here's Why It Could 10x+ 🚨
🔰 What is Arbitrum?
Arbitrum is Ethereum’s top Layer-2 scaling solution using Optimistic Rollups.
It powers faster, cheaper transactions without compromising security.
🔰 Ecosystem Highlights
▶️ Arbitrum One – DeFi & dApps
▶️ Arbitrum Nova – Gaming & Social apps
▶️ Hosts major projects: Uniswap, Aave, GMX
▶️ Among the top L2s by TVL dominance
🔰 Tech & Innovation
▶️ Runs on fraud-proof optimistic rollups
▶️ Nitro upgrade boosted throughput + cut gas fees
▶️ Gives near-Ethereum experience with 10x lower costs
🔰 Tokenomics
▶️ Total Supply: 10B ARB
▶️ Airdrop: 1.162B (11.6%) to users & DAOs
▶️ Remaining: Treasury + future ecosystem rewards
➡️ Small circulating supply = potential supply squeeze on demand surge
🔰 Backers & Partnerships
▶️ Built by Offchain Labs
▶️ Investors: Lightspeed, Pantera, Coinbase Ventures
▶️ Listed on Binance, Coinbase, KuCoin
▶️ Integrated by top Ethereum protocols (Uniswap, etc.)
🔰 TECHNICAL BREAKDOWN: ARB/USDT HTF Chart
✅ Accumulation Zone: $0.29–$0.42
▶️ Above $0.4028 = momentum shift zone into Super Bullish
▶️ Next resistance: $0.48–$0.52 (watch for breakout!)
▶️ Targets: $1.10 / $1.71 / $2.19 / $5
⚠️ Hold above $0.2942 to keep setup valid
✅ Strong volume + higher lows = bullish confirmation
▶️ DYOR | NFA
🔰 Why 10x–50x Is Possible
▶️ Top Ethereum L2 by usage
▶️ Real utility, not meme hype
▶️ Limited unlocked supply = buyer advantage
▶️ L2 sector will explode if ETH demand grows
▶️ Could capture a huge chunk of ETH's scaling market
🔰 Final Take
▶️ AMEX:ARB is more than hype — it's infrastructure.
▶️ In a bull market, this is the kind of setup that runs hard.
▶️ Keep it tight on your watchlist.
ETHUSD 1D (Daily) chart: Long Setup🔍 Chart Overview
Asset: Ethereum / US Dollar (ETHUSD)
Timeframe: 1D
Pattern: Bullish Breakout from a Falling Channel
Bias: Strong bullish reversal in progress
Current Price: ~$2,414.80
Major Resistance Zone: ~$3,800–$4,000
Key Support Zones: ~$2,000 and ~$1,510
📈 Technical Breakdown
1. Falling Channel Breakout (Reversal Signal)
ETH had been trading in a downward-sloping channel since late 2024.
Recently broke above the descending channel with a large bullish candle.
This breakout indicates the end of the bearish trend and start of a potential long-term bullish phase.
✅ Classic bullish reversal signal with volume spike.
2. Strong Bullish Impulse
After the breakout, ETH created a powerful bullish impulse candle with almost no upper wick.
Indicates aggressive buyer momentum.
Price is now above multiple key resistance levels (now turned to support).
3. Key Demand Zones (Support)
Zone Description
~$2,018 Retest zone from structure + previous consolidation
~$1,510 Major historical support, origin of last major rally
If ETH pulls back, $2,018 zone is ideal for re-entry, as it's the most probable demand zone buyers may defend.
Second option for long-term reaccumulation is around $1,510 if a deeper correction occurs.
4. Bullish Rejection + Projection Path
The chart shows two possible bullish paths drawn with arrows:
One is a shallow pullback into the $2,000–$2,200 zone before rallying higher.
The second shows a deeper retest into the lower demand before heading up.
Both reflect valid bullish continuation setups.
🎯 Target Zone
Target Area: ~$3,800 to ~$4,000
This zone aligns with:
Previous high resistance
Liquidity pool / order block from last major drop
Psychological round number
📌 Ideal area to take profit or start reducing exposure on swing positions.
🧠 Confluences for Bullish Bias
Confluence Description
Break of falling channel ✅ Strong trend reversal signal
Clean bullish engulfing candle ✅ High momentum confirmation
Price broke structure highs ✅ Market structure shifted bullish
Retest zones clearly defined ✅ Logical risk-managed entries
Major resistance ahead ⚠️ Profit-taking zone (plan ahead)
🛠️ Possible Trading Plan
Option 1 – Aggressive Entry (Now)
Enter after breakout confirmation
SL below $2,000 (structure)
TP at $3,800–$4,000
RRR: ~1:3+
Option 2 – Conservative Entry (Retest)
Wait for pullback to $2,000–$2,100
SL below $1,900
TP at $3,800–$4,000
RRR: ~1:4 or higher
🚩 Caution Points
If ETH drops below $2,000 and closes below the demand zone, bullish setup weakens.
If Bitcoin drops sharply, it can drag ETH down too — watch BTC for confirmation.
Always manage risk — avoid FOMO entries after a strong impulse move.
✅ Conclusion
This is a textbook bullish reversal with a clear falling channel breakout, strong momentum, and well-defined support zones. Two bullish projections show smart trading ideas, and the ultimate target around $3,800–$4,000 is logical.

Institutional Trading part 4Institutional trading consists of the purchase and sale of financial assets by institutions through their traders. This definition of institutional trading applies to institutional equity trading, institutional stock trading, institutional options trading - any subcategory.

Divergence SecretsIn trading, divergence occurs when the price action of an asset moves in the opposite direction to what a technical indicator, such as a momentum oscillator, indicates. This discrepancy can signal a potential change in trend momentum or a possible reversal of the existing trend.
