📊 Bitcoing Swing Trade Opportunity 🎯BITSTAMP:BTCUSD
📌 To Trade on This Chart, You Should Have Reversal Trading Knowledge. As Harmonic is One Of The Best Reversal Trading Strategy, But Always Remember That Harmonic Patterns Also Can Fail (there is no holly grail In Stock Market). That's Why One Should Must Have Knowledge Of Reversal Trading To Trade On Harmonic Patterns.
📌 That Dash Line Is Called PRZ, From That Dash Line To that Horizontal Simple Line Area Is Whole PRZ(Price Reversal Zone).
📌 As One can see, Quite Big Stop Loss as per this pattern. So wait for perfect reversal first then only go for long and ones enter in trade then strictly follow stop loss and here as per my own experience one should keep Stop Loss as closing basis.
(PRZ :- Potential Reversal Zone, SL :- Stop Loss, TF :- Time Frame)
PRZ 1 :- 41101.80
SL :- 34983.5 (Closing Basis) (better to enter after reversal candle and keep sl below that candle if you atre trade for swing or short term)
Target 1:- 44369
Target 2:- 46643
Target 3:- 48971 and more Trailing basis
Note:- As Per this harmonic pattern, stop loss is quite big, so Trade on reversal only if you don’t know what is reversal, Kindly note that and ask in live session so next time you could be able to identify reversal by your self. Even ask doubts in comments, below.
******whatever charts or levels sharing here or on any other platforms are just for educational purpose only, Not A Recommendation To Buy Or Sell. Please do your own analysis before taking any trade on them. We are not SEBI registered.
Cryptocurrency

SHIBA MIGHT ENTER THE BULLISH ZONE SHIBA INU is revolving around its strong support zone which is around 0.000025 , Hence we might see a strong bullish continuation once SHIBA breaks the shown resistance channel ........... I am quite positive with SHIBA INU due to recent burns

Trading Signal For TRUUSDT Trading Signal:
A Trading Signal is seen in the TRUUSDT TrueFi
Traders can open their Buy Trades NOW
Rank : ⭐️⭐️
⬆️Buy now or Buy on 0.253
⭕️SL : Close Below 0.238
🔵TP1 @ 0.301
🔵TP2 @ 0.348
🔵TP3 @ 0.462
If you liked our ideas, please support us with your likes 👍 and comments .

BTCUSDTriangle nd Channel patter formation on BTC on a 15min timeframe ! Target should be around 40700$ !
🚫Disclaimer:
I'm not an financial analyst! I'm sharing this with public! It just learning purpose only! If u find anything wrong with this post ! U can tell me ⬇️ comments!
Thank you!!!
😊😊😊

Bitcoin-Finally retested the 40k Level.Do you see any pattern similar to the prev crash?
Probably the worst is over.
The fear index is hovering over 10 which is the lowest ever seen in the history of the markets.
Even if we breach the 40k we have an impregnable wall at 30k.
Hope el Salvador and other institutions will come to rescue us if we reach there in an extreme cases.
Analysis for BitcoinBitcoin is at previous support level. Either it will reverse or can be bearish further.

ETH RetestAll the important levels have been marked. Expecting a short retest and then bounce back in here.

MATICUSDTLook like Uptrend ! Channel patter formation on MATIC COIN on a daily timeframe ! Target should be around 3$ ! incase BTC sudden crash this chart not valid !
🚫Disclaimer:
I'm not an financial analyst! I'm sharing this with public! It just learning purpose only! If u find anything wrong with this post ! U can tell me ⬇️ comments!
Thank you!!!
😊😊😊

Bitcoin going to 30,000$ As stated in previous chart
BTC fails to handle 45,000$ and now forming massive head and shoulder
If it played well we can see BTC@30,000$ level

Trading Signal For EthereumTrading Signal:
There is a Trading Signal to Sell in ETHUSDT Ethereum
Traders can open their Sell Trades NOW
Rank : ⭐️
⬇️Sell now or Sell on 3592.0
⭕️SL: close above 3717.0
🔵TP1 @ 3271.0
🔵TP2 @ 2946.0
If you liked our ideas, please support us with your likes 👍 and comments.

BTC USDT PAIR IS INDECENSIVE RIGHT NOW !! WAIT TILL EVENINGBTC USDT PAIR IS INDECENSIVE RIGHT NOW !! WAIT TILL EVENING
for future trade and do DCA (AVERAGING in your coins and fill your bags in slow down !
and use take profit strategy, and buy the DIP
DO SOME MATHS !! :p

SKLUSDT SKL on a 4hr timeframe !
🚫Disclaimer:
I'm not an financial analyst! I'm sharing this with public! It just learning purpose only! If u find anything wrong with this post ! U can tell me ⬇️ comments!
Thank you!!!
😊😊😊

BNB/USDT ON HOURLY CHARTBNB coin is making a triangle pattern on hourly chart. Looking at price action we can observe BNB making LL, LH. We are still neutral on this.
We will go long once breakout is done with good volume n supertrend in our favor.
We will go short once breakdown is done with good volume n supertrend in our favor
Safe trade.

KDAUSDTChannel patter nd trendline support formation on KDA on a daily timeframe ! Target should be around 21$ above !
🚫Disclaimer:
I'm not an financial analyst! I'm sharing this with public! It just learning purpose only! If u find anything wrong with this post ! U can tell me ⬇️ comments!
Thank you!!!
😊😊😊


LUNA/USDT ON HOURLY CHARTAfter a strong rally LUNA has been into a correction move. Please check on 4hrs chart to understand it properly. And use Fibonacci retracement to check the levels.
We did analysis on hourly chart and seems like LUNA is still in downtrend and it broke a Rising wedge pattern too which was retraced exactly from the 50% Fibonacci level. Now to make sure this move is continued we used Fibonacci extension to mark our upcoming targets.
We have shown it on the chart.
Also our Supertrend shows that the trend is bearish to it make more sense to plan short trade.
Trade safe

Small trade opportunity in ATOM.Small trade opportunity in ATOM.
Target 1: 40 (USDT)(20 days)
Happy Trading!


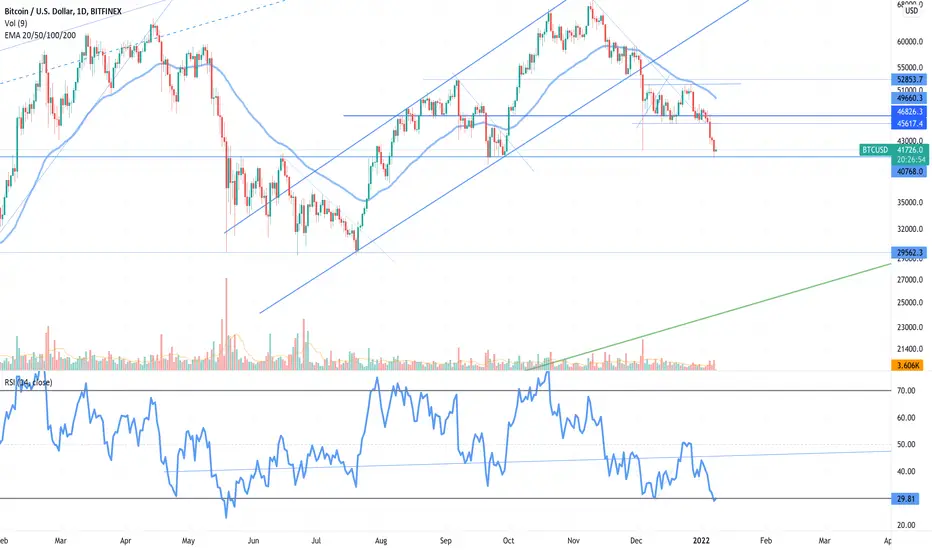
BTC price action I am sharing 4hr timeframe chart just to give you all clear view of what happening with regards to $BTC
Since BTC started its downward movement after hitting 69k. BTC was moving downward in a parallel channel. After the breakout of the channel. BTC got rejected at 51.9k and again it started moving in a new downward Parallel channel.
As you can see BTC price is still going downward but the RSI is moving up. Which is a hidden bullish divergence and same divergence can be seen on daily timeframe.
Note: These are just my observations. Kindly DYOR.

MDX/USDT 4H TFMDX/USDT - price action analysis
price breakdown from support and given huge fall
currently price is consolidating in range 0.35$ - 0.45$
price is taking trendline resistance - had huge liquidity above trendline
entry above trendline and given range
Target - 1$
#tradewithelplan #tradewithaplan

BTCUSDTSupply nd demand zone (or)Sideway patter formation on BTCUSDT on a 1hr timeframe !
🚫Disclaimer:
I'm not an financial analyst! I'm sharing this with public! It just learning purpose only! If u find anything wrong with this post ! U can tell me ⬇️ comments!
Thank you!!!
😊😊😊

ADA/USDT Weekly TFPattern - Rounding bottom
breakout and retest done
Price at support level
can buy at 1$-1.4$ (long term)

FTMUSDTFlag patter formation on FTMUSDT on a daily timeframe ! Target should be around 3.15-3.65$ !
🚫Disclaimer:
I'm not an financial analyst! I'm sharing this with public! It just learning purpose only! If u find anything wrong with this post ! U can tell me ⬇️ comments!
Thank you!!!
😊😊😊
