$MINA inside Bullish Rectangle on Daily TFI found that large volume is coming in $MINA and also the chart pattern and trend shows bullish consolidation and a soon breakout.
Although market is in downtrend it would be bit risky to trade, still I would advice you to take minimal risk and invest a very small capital with tight RR if
you are willing to trade.
Entry @ 0.920
Exit @ 1.150
SL @ 0.800
Cryptocurrency

$JASMY @ two demand zones$JASMY managed to break from consolidation above first demand zone and now I am expecting it will rise above the second demand zone as well.
If happens we can expect a rally up to 0.012 where it will face local resistance.
Entry @ 0.0075
First TP @ 0.0089
Second TP @ 0.012
SL @ 0.0063

Get on $GRT train-LONG journeyFirst and Second target achieved on BINANCE:GRTUSDT , but I'll continue the journey up until Third target stop.
Anybody who wants to get on it, get in @ 0.14 with TP @0.155 and SL@0.125
Beware that It might take few days to reach there .

BTCUSD(Weekly Analysis)The world’s largest cryptocurrency has maintained its positive momentum and accumulated approximately 36% returns in January.
BTC has been in a Bear trap, it had hit its low of $15.5K and took support at the resistance trendline as shown in the chart. After consolidating there for 2 months, BTC shot up to the level of $24K and is currently retracing and trading at $22.9K.
The support to the lower side is present at $22K and $21K while it may face resistance at $24K and $25K respectively.

Let's Keep an Eye on $MANABINANCE:MANAUSDT is making some nice moves.
A nice consolidation breakout of resistance zone at 0.76, and now retesting it for a support.
Also a Fib Extension has given a clearance for the next target up till next resistance.
Let's keep watching $MANA

Bullish Rectangle + Breakout on Daily TF for $FET$FET consolidated inside Bullish Rectangle for many days and finally managed to broke out with high volume confirmation.
Once the retest done I am going in at 0.35 with 0.43 in sight for TP and 0.3 as SL.

LITECOIN (LTC) This is based on the Elliott Wave Theory. The current structure can be assumed as a triangle due to internal ABC formations. This suggests that the price would remain bullish from the current levels.

ETHEREUM - Elliott Wave ViewThe idea is based on the Elliott Wave Theory. It suggests that the correction cycle may be over and the next bullish cycle could begin from here.

$GRT looking for a breakout on Daily TFWatching BINANCE:GRTUSDT closely on Daily TF.
Inverse Head & Shoulder pattern formed, a minor pullback below neckline and then breakout is expected.
Entry @.0820
Exit @.1000

$BTC Daily Update$BTC #BTC $22,750 support holding which is good, Last 4H close looks good. $23,197 resistance in effect, requires to regain $23,479 support. Continue watching given S/R

FTM 4H TF Analysis FTM has broken the accumulation range on 4H TF. We can expect the targets as shown on chart.

BTC/USD - Weekly OverviewBitcoin continued its positive momentum in the past week as the YTD gain reached approximately 40%.
On the Fibonacci retracement table, BTC price level had entered the resistance zone which is above 0.786 FIB level.
Considering the technical indicators, Bollinger bands has contracted its width which suggests a potential consolidation or profit-booking momentum. The MACD level has also started to form red bars on the histogram while the levels look vulnerable for a negative crossover.
Overall, if the bulls are able to sustain the ongoing positive momentum, BTC will test the resistance present at $25K and $27K. However, if we witness a considerable profit booking momentum, support levels can be placed at $22K and $20K.

BNB in an UptrendMarket is looking positive for now so a quick trade can be taken be cautious as FOMC meeting is heading ahead.NFA

BTCUSD - 45M PROJECTIONDISCLAIMER: The Company accepts no accountability or obligation for your trading and speculation results, and you consent to hold the Company innocuous for any such outcomes or misfortunes. We are not financial advisers or account managers; We are Forex traders. The recordings on this channel are rigorously for educational and amusement purposes. Trading Forex implies dangers, and you can lose all your venture ; consequently, you exclusively must take a chance.

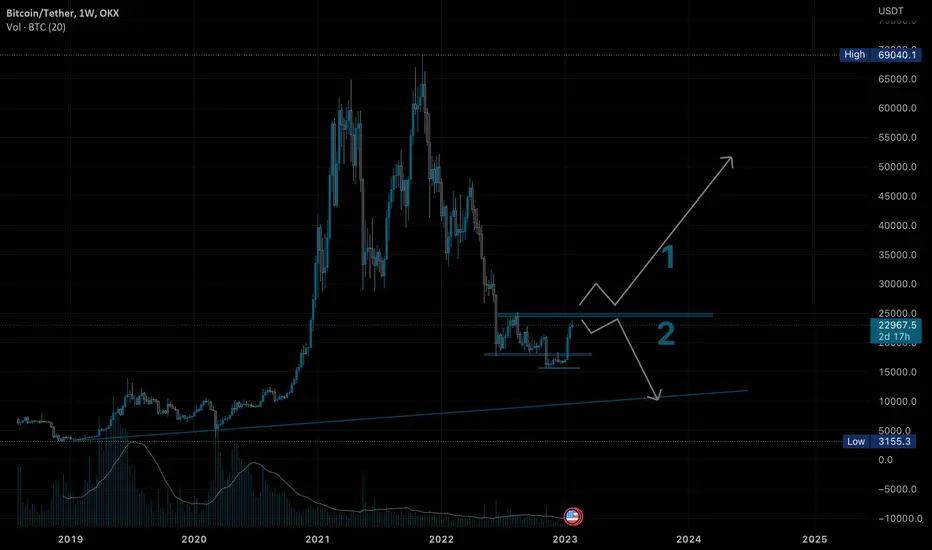
Bitcoin next move update1 or 2 ?
Lets not guess.
Lets react to the market
If guessing is the game i’l go with 1
#fingerscrossed
matic bullishcreating a base just below strong resistance ..
can be a good buy abv 1.05
and good for investing also

$ETH Short Selling (High Risk Short-term Trade)$ETH Short Selling (High Risk Short-term Trade)
EP:1644.17
SL: 1682.17
TP1: 1580.27
TP2: 1527.77
RRR: 1.69

Axie Infinity Token Unlock (January 2023)The chart highlights the price performance of Axie Infinity (AXS) in the past couple of days amid the token unlocking. It could be clearly noticed that before the token unlocking actually took place, there was positive sentiment for the AXS token. However, after the unlocking, there has been significant selling pressure which brought the price level down from its current year ATH of approximately $14.00 to the current recorded price of $11.20.
This might indicate that Axie Infinity is currently facing the second and unwanted case of token unlocking explained earlier. This means there is less demand for the token as compared to its circulating supply in the market.

HEAD AND SHOULDER PATTERN (SELL SIDE)SELL: 382 to 373
TARGET : 320
Reason For Selling This Script :
In this script it has formed head and shoulder pattern in in monthly time frame. Once this price close below the 320 in monthly time frame and then try sell. Waiting for neckline breakout.
Note :
Above given levels are based on monthly & weekly time frame . So be patience it will take some months to achieve the target.
ALL THE BEST ..

XABCD PATTERN BUY : 152 TO 123
TARGET : 274
Reason For Buying This Script :
In this stock it has broken the double bottom neck line. Once price close above 274 and the next target up to 396.
Note :
Above given levels are based on monthly & weekly time frame . So be patience it will take some months to achieve the target.
ALL THE BEST ..

Rally Incoming for $GMTAfter Bottom reversal BINANCE:GMTUSDT is clearly looking for leg up.
A small local Resistance takeover will definitely lead a rally up to $1.15.

$KNC Analysis on DailyAfter reversing from bottom $KNC has retested Daily support zone, and if you look at Weekly TF you will see a rally straight up to $1.20 can be expected.
Volume is incoming, only if market sustains the choppy sideways and do not take drastic turn we can expect the target hit soon.

BTC/USD - Weekly OverviewThe world’s largest cryptocurrency has maintained its positive momentum since the start of the year and generated approximately 36.83% YTD returns.
On the chart, two areas are marked representing the resistance zone and sustainability zone, respectively. The current price action of BTC suggests that it will be targeting a positive breakout above the resistance zone placed above the 0.786 FIB level.
However, the bullish engulfing candle which led to the breakout above 0.618 FIB level suggests that Bitcoin needs to spend some time in the sustainability region to formulate potential support zones. Having another bullish momentum on the current build-up might lead to volatile profit booking momentum which might deteriorate previously gained returns.
The technical indicators including MACD and RSI are sustaining on bullish levels as RSI is in the overbought region for most of 2023. The MACD continues to form green bars on the histogram.
Overall, the resistance level for BTC will be at $23K and $25K. Whereas, if profit booking momentum comes into action, support levels can be placed at $21K and $20K.
