Explanation of RSIThe Relative Strength Index (RSI) is a momentum indicator in technical analysis that measures the magnitude of recent price changes to assess whether an asset is overbought or oversold. It oscillates between 0 and 100, with values above 70 often suggesting overbought conditions and values below 30 indicating oversold conditions.
Cryptolevels

NEIRO'S RESISTANCE RUN - IS A REVERSAL AROUND THE CORNER?Symbol - NEIROUSDT
Among the limited number of digital assets currently exhibiting upward momentum, NEIROUSDT stands out. However, its primary drawback lies in its position near the lower boundary of its trading range. This suggests the potential accumulation of liquidity ahead of a further decline.
NEIROUSDT is currently exhibiting signs of short-term strengthening, moving toward the upper resistance boundary of its consolidation range, while Bitcoin continues its corrective movement. A significant resistance and liquidity zone lies ahead at 0.000187, Any short-term gains could be undermined by a potential false breakout, followed by a reversal.
It is important to note that the presence of a coin near its bottom does not preclude the possibility of further downward movement. There is still room for additional decline. Presently, the price remains confined within a consolidation range amidst a broader downtrend, with no convincing signs of recovery. The last upward move was met with considerable selling pressure, leading to a sharp pullback.
Key Resistance Levels: 0.000187, 0.0002045
Key Support Levels: 0.000169, 0.000154
A false breakout above resistance, followed by a reversal toward the lower boundary of the range, is likely. Additionally, an extended consolidation near the resistance zone is not ruled out. During this phase, price may test the 0.00020 liquidity area before resuming its downward trend and potentially forming a new low.

ALCHUSDT'S CLIMB - PUMPING STRONG, RESISTANCE AHEAD!Symbol - ALCHUSDT
Despite the prevailing bearish sentiment across the cryptocurrency market, ALCHUSDT stands out as one of the few assets demonstrating relative strength. However, the sustainability of this momentum remains uncertain, particularly in the face of upcoming resistance levels.
Currently, a consolidation pattern is forming just below the breakdown threshold on the intraday timeframe, indicating a potential readiness for continued upward movement within the current distribution phase.
A confirmed breakout above the 0.1590 resistance level is expected to trigger further bullish momentum, with the next key target situated in the liquidity zone around 0.1770. However, due to the strength and significance of this intermediate resistance, a false breakout and subsequent pullback-potentially towards the 0.1590 level or the 0.5 Fibonacci retracement - should be anticipated.
Key Resistance Levels: 0.1590, 0.1770, 0.2300
Key Support Levels: 0.1516, 0.5 Fib retracement
The current distribution phase has already seen a 53% expansion since breaking above consolidation resistance. By the time price approaches the 0.1770 level, this could extend to approximately 77%. At that point, the market may have exhausted much of its bullish potential, increasing the likelihood of liquidity absorption above 0.1770 and a subsequent reversal or correction.

BITCOIN , BTCUSD
Bitcoin is currently finding support at the trend-line. Let's see whether it moves up from this support or breaks down. We should wait for the candle close this week for a clearer indication.
The stock market is unpredictable and can be influenced by large players. In recent years, we've seen significant struggles, like the COVID-19 pandemic and the Russia-Ukraine war, along with political events like Trump's actions. Although the market tends to recover quickly after crashes, it can also drop suddenly, as Newton's law suggests: what goes up fast can come down fast.
After the pandemic, many people wanted to invest in stocks, which attracted big investors and social media influencers promoting specific stocks that they wanted to sell. Many investors believe it's always good to buy the dip, but how much you invest matters. It's wise not to put all your money into the market; instead, diversify your investments across at least three different areas.
Don’t invest blindly just because the market is down. Additionally, governments often regulate the stock market in ways that benefit large investors while imposing higher taxes on ordinary people. I don’t blame the wealthy or those in power, as they were once normal people too; it's how we change with more money that can lead to different behaviors.

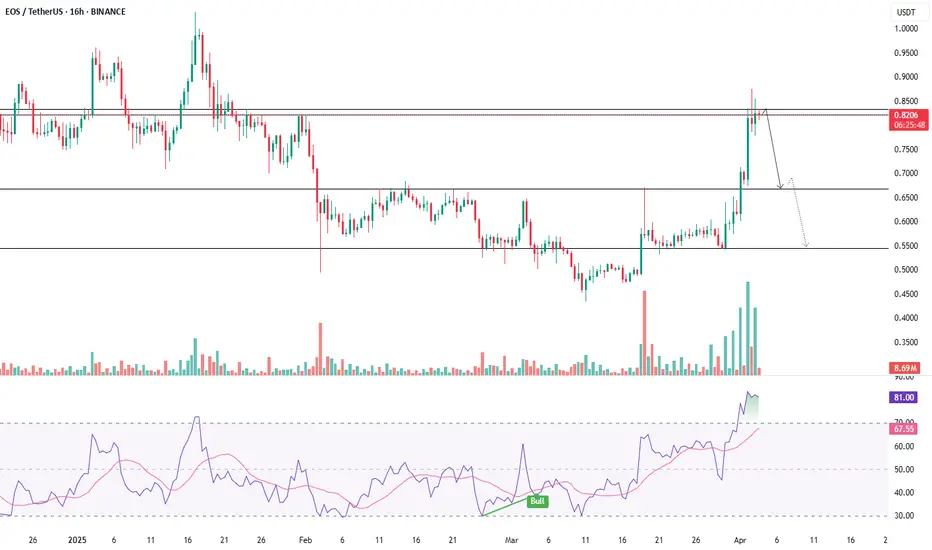
EOSUSDT - FACES RESISTANCE - IS A DOWNTURN ON THE HORIZON?Symbol - EOSUSDT
CMP - 0.820
EOSUSDT has reached key resistance within the consolidation range of 0.54 - 0.60, where it has formed a false breakdown, signaling a lack of potential for further upward movement. The broader cryptocurrency market is currently displaying signs of weakness, exacerbated by yesterday’s speech by President Trump and the subsequent approval of new tariffs, which have introduced additional risks and pressure on the market. Following a rally, Bitcoin has returned to a negative trend, while altcoins are continuing to seek new lows. EOSUSDT, however, has shown notable strength, suggesting that its recent price movement may be part of a countertrend accumulation strategy aimed at capturing liquidity within the 0.7 – 0.8 range. This distribution pattern is further characterized by a false breakout within the 0.82 – 0.86 range.
Key resistance levels: 0.820, 0.860
Key support levels: 0.793, 0.666
If bearish pressure manages to maintain resistance between 0.82 – 0.86 and the consolidation below this range culminates in a breakout at 0.793, followed by price consolidation in the selling zone, a potential reversal and decline towards key zones of interest - such as the FVG, 0.64, and 0.541 - could occur.
Market Turning Point? Watch 87,533.05 for a Bullish BreakoutThese 3 candle wicks indicate that the bears are no longer in strong control of the market. However, for the market to turn bullish, it is essential to close above the 87,533.05 level on the daily chart. Only after that can the market become bullish in the short term, with potential targets of 96,000 or even 102,682. But sustaining above the 87,533.05 level on a daily basis is crucial.

Bitcoin - 140 K in 2025 - 5th wave targetPrice is at technically buying zone - Fib buy zone and also breakout zone and right now double bottom. at any price around this price based on big players buying orders fourth wave will get completed and 5th wave will start. Breakout of resistance red line is confirmation of 5th wave progress. previous resistance areas could give selling pressures due to tax fears and global recession fears. Supporting reasons - Strategic reserve and US Govt is one new player now. what ever buying happening during bear trend will be visible only in data about who is buying like Black Rock, Strategy - Saylor etc. As and when positive mood comes in market BTC will keep bouncing back and price is accumulation area for sure for big players. This is not a time to sell but to accumulate BTC for sure. All tax war will only slowdown the BTC up move but will not fall further much. But still hold long qty with required margins and to be safe keep liquidation levels as 73 at least to be safer to avoid any big liquidation candle in case any exchange liquidate retail people's holdings. US Strategic reserve data is awaited. Every Monday Saylor in his X profile posting his purchases and Black Rock too seen buying BTC last several days or weeks, Price is dropping since loose hands sell in fear. As per data, spot buyers didnt sell at all. Its only traders with 50x or 100x moving the market.

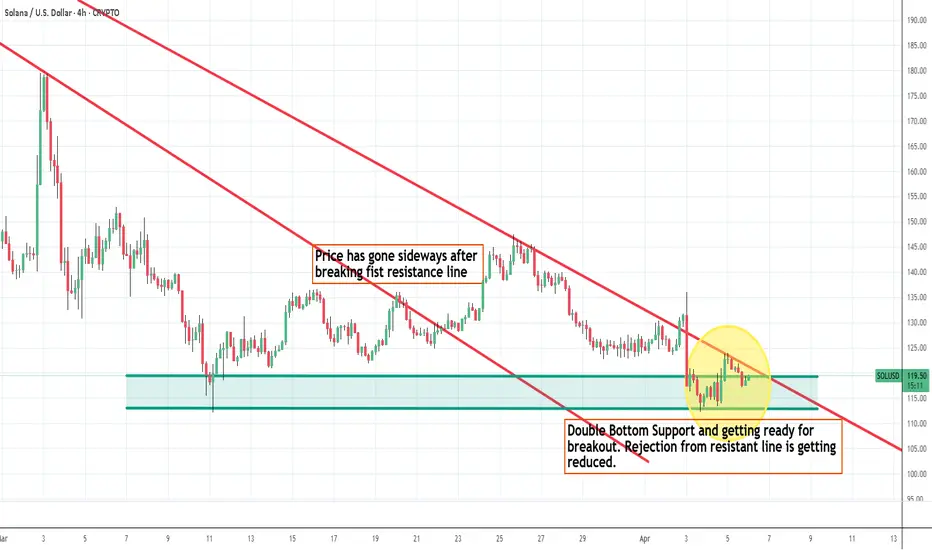
SOL - Getting ready for Big Breakout.Price has taken double bottom support. Price rejection from second resistance line is getting reduced. Any up move from BTC, SOL will give bigger breakout for sure. So trend will follow in whichever side price breaks the lines. I think not much downside can be seen in SOL since it has fallen from 250 levels to this low. SOL is next to BTC and ETH right now and its widely used. Price is at very attractive levels keeping ETF approvals in few weeks or 2 months this year. SOL is also one of the coins for strategic reserve.
MEWUSDT - EYEING KEY LEVELS FOR A POTENTIAL DROP AHEADSymbol - MEWUSDT
MEWUSDT pair is currently in the distribution phase, testing a significant resistance and liquidity zone, where it has exhibited a false breakout. In light of the current market conditions, it is crucial to monitor several key levels, including both support and resistance.
A potential retest of the 0.00300 - 0.00312 range is likely, with the possibility of targeting another liquidity zone before MEWUSDT resumes its downward movement in alignment with the prevailing local and global market trends. These trends are characterized by a weakening Bitcoin and an overall sluggish cryptocurrency market.
Key Resistance Levels: 0.002793, 0.00300, 0.00312
Key Support Level: 0.002696
The primary support level at 0.002696 is critical, as it aims to prevent further market decline. Should the price fall below this level, there is a lack of significant support, potentially allowing for a strong move downward. A breakdown and sustained consolidation beneath the 0.002696 level could trigger a substantial impulse toward target zones around 0.00222 and 0.00200

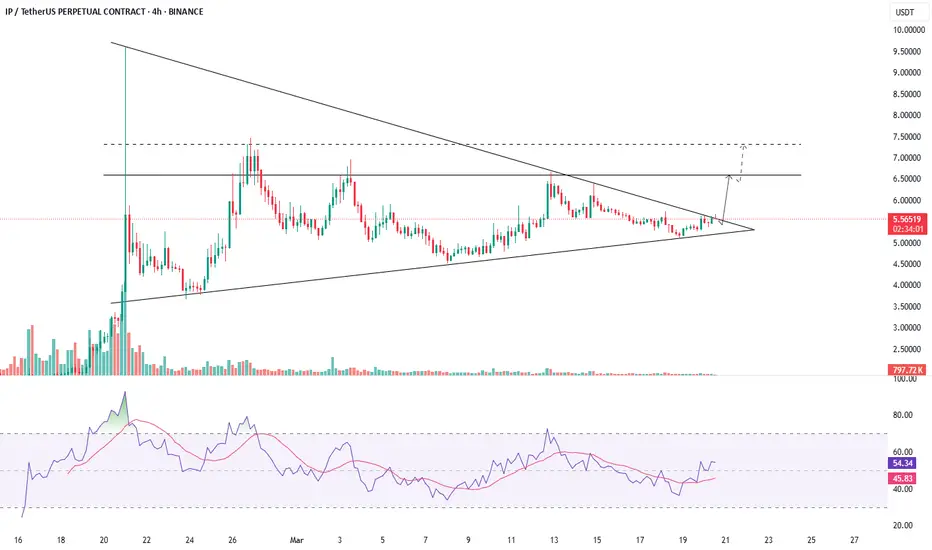
IPUSDT - POISED FOR A BREAKOUTSymbol - IPUSDT
CMP - 5.5500
IPUSDT is currently establishing favorable conditions for potential growth. Bitcoin has provided a modest boost to the market following positive developments regarding the SEC and XRP, a factor that has not gone unnoticed within the crypto community.
The IPUSDT coin has experienced an extended period of consolidation, forming a symmetrical triangle pattern. The upward trend in lows, coupled with the consolidation phase and the subsequent breakout above the triangle's resistance, signals positive indications of a potential distribution phase (the culmination of the consolidation). The key resistance level at 5.6297 remains a crucial barrier, separating the market from a more liberated zone.
Resistance levels: 5.6297, 6.6310
Support levels: 5.1160, 4.7830
Over the past few days, the price has consistently approached the triangle resistance and is building momentum for a potential breakout. Multiple intraday retests of this region demonstrate market interest in surpassing this boundary. A successful breakout above the 5.6297 resistance level, followed by consolidation above the triangle, would serve as a strong signal of readiness for upward movement.
ETH - Target 2200 - BullishETH has fallen a lot and taking support and move is bullish in line with BTC move. At these great levels buying, accumulating and investing in ETH is safe and for traders once the fourth wave is complete price is easy to see 2200 for fifth wave. ETH is good buy now. I expect small correction in BTC to complete and rise again or above 88K . Even if BTC correction is bigger ETH may not fall much since it has fallen a lot so its better to long in ETH more than in BTC now.

Emergence Of Bear Flag Pattern in Bitcoin (BTCUSD)Similar to Nasdaq - ,
Bitcoin (BTCUSD) too forming a Bear Flag.
Similar price action but very high volatility due to news flow.
Lets see where it goes.
Trade Safe

SOLVUSDT - RETEST OF RESISTANCE IN A BEARISH TRENDSymbol - SOLVUSDT
CMP - 0.0430
SOLVUSDT is currently consolidating within a neutral range, which has emerged amid an ongoing downtrend. The cryptocurrency market has swiftly retreated following the news from Sunday. Bitcoin has re-entered the selling zone, falling below the 90K level. A continued decline in Bitcoin could exert downward pressure on the broader market.
SOLV is forming a range between 0.044 and 0.0292, with the price showing signs of strengthening toward the key liquidity and interest zones. Given the prevailing market conditions - including the downtrend, a weak market sentiment, the lack of a strong catalyst, and Bitcoin's decline - it is reasonable to assume that the coin has limited potential for further upward movement. The current price action may result in a false breakout of resistance, followed by a decline.
Resistance levels: 0.0436, 0.0439, 0.0494
Support levels: 0.0369, 0.0345
Considering the daily ATR from the session's open, it is expected that the volatility will be exhausted by the time resistance is reached, leaving little room for a breakout. There is a high probability of a price retracement from the 0.0436-0.0439 range, with the price likely to fall towards the key support zones below.

Bharat Wire Ropes Ltd (BHARATWIRE) Stock AnalysisFundamental Analysis:
Bharat Wire Ropes, a key manufacturer of steel wire ropes, benefits from rising infrastructure, construction, and industrial demand. Strong order inflows and capacity expansion support growth. Risks include raw material price fluctuations and competition from global players.
Technical Analysis:
The stock is testing resistance near ₹220. A breakout could push it toward ₹240. Strong support is at ₹190, and a breakdown may lead to ₹175. RSI around 62 indicates bullish momentum but nearing overbought levels.
Key Levels:
- Resistance: ₹220 / ₹240
- Support: ₹190 / ₹175
Conclusion:
Bharat Wire Ropes is in a growth phase with strong sector demand. A breakout above ₹220 could fuel further upside, while dips to support levels offer accumulation opportunities. 📊🚀

Ethereum (ETHUSD) - Zooming out and taking a viewEthereum seems to be moving towards near term support line and a trendline on weekly time frame.
It may take support here and give a bounce.
If the support breaks, then more pain is coming for it.

OMUSDT - BULLISH MOMENTUM MAY PERSISTSymbol - OMUDST
CMP - 7.2828
OMUSDT remains an attractive asset, with consolidation forming in a flag pattern within the prevailing bullish trend. OMUSDT continues to form consolidation within the uptrend, and growth may follow if the resistance at the local channel is broken. The price structure appears robust, especially in contrast to the generally weak performance of the altcoin market.
Following Trump's speech yesterday, Bitcoin managed to surpass local resistance and entered the buying zone. If the price maintains a position above the 96.5K - 97K range and sustains its upward movement, certain altcoins may experience bullish momentum, which could propel them higher, including the already strong OMUSDT.
From a technical standpoint, the focus is on the local descending flag channel, with two critical support levels at 7.324 - 7.213. A false breakdown at these levels could trigger a continuation of the upward movement.
Key resistance: 7.755
Key support levels: 7.324, 7.213
The catalyst for continued growth lies in breaking through the channel boundary and the resistance at 7.755. Currently, the price is still distant from this zone and is approaching the support levels. A retest of the liquidity zone may culminate in a bullish impulse.

POPCATUSDT - TESTING RESISTANCE AMID BEARISH STRCTURESymbol - POPCATUSDT
CMP - 0.3290
POPCATUSDT is currently testing trend resistance on the 4-hour timeframe. A rapid approach toward the upper boundary of the channel, accompanied by a false breakout, could lead to a correction or a continuation of the downward movement.
The broader market trend remains bearish, and the short-term trend aligns with this overall downtrend. Bitcoin has yet to serve as a bullish catalyst for altcoins. Additionally, yesterday’s CPI & economic data exerted a negative influence on the market. The cryptocurrency community had high expectations for Trump, but his stance has shifted, leaving cryptocurrencies lower on his agenda.
From a technical perspective, POPCAT is testing the resistance of the channel with a potential false breakout within the context of a prevailing downtrend. A sustained price consolidation below the 0.3220 level could signal further selling pressure.
Key resistance levels: 0.3220 (sell trigger)
Key support levels: 0.2386, 0.1596
While there remains a possibility of a retest of the correction channel resistance, bearish market conditions and the overall weak market sentiment suggest that the downtrend may continue.

What is price action and how to use it ?Price action refers to the movement of a financial asset's price over time. It’s a method of technical analysis that focuses on reading the market through price movements rather than relying on indicators or fundamental analysis. Traders who use price action study how price behaves on charts to predict future movements.
Here’s a breakdown of how to use price action:
1. **Understanding Candlestick Patterns**
Candlesticks represent price movements within a specific time period. A candlestick chart provides information about the opening, closing, highest, and lowest prices. Common price action patterns include:
- **Doji**: Suggests indecision in the market.
- **Engulfing Patterns**: A reversal pattern where a larger candle completely engulfs the previous one.
- **Pin Bar**: Indicates a potential reversal after a strong price movement.
2. **Support and Resistance Levels**
These are key horizontal levels where price tends to reverse or consolidate. Traders use price action to spot these areas and make decisions. For example:
- **Support**: Price tends to stop falling and might bounce back up.
- **Resistance**: Price tends to stop rising and might reverse downward.
3. **Trend Lines**
Trend lines are drawn by connecting higher lows (for uptrends) or lower highs (for downtrends). These lines help to visualize the direction of the market. Price action traders will look for price to stay above or below these trend lines, indicating strength or weakness in the trend.
4. **Breakouts**
Breakouts occur when the price moves beyond key support or resistance levels, often indicating the start of a strong trend. Traders use price action to confirm breakouts through candlestick patterns or volume analysis.
5. **Price Patterns**
Patterns like triangles, channels, and head and shoulders provide insight into potential price moves. By analyzing these formations, price action traders can predict whether a trend is likely to continue or reverse.
6. **Time Frames**
Price action can be applied across various time frames, from minutes (scalping) to hours or even daily (swing trading). Traders typically align their strategy with their trading time horizon.
7. **Risk Management**
With price action, traders often use strategies like setting stop losses based on recent swing highs or lows. This helps in managing risk and ensuring they exit trades before significant losses occur.
8. **Patience and Practice**
Successful price action trading requires understanding market psychology and being patient for the right setups. It's often about waiting for a confirmation of a move rather than reacting to every price fluctuation.

#SHARDACROP ltd
#SHARDACROP is taking support from its previous consolidation zone.
today good green candle with volume showing it may move up in next few sessions.
Sharda Cropchem Limited is an Indian company specializing in the marketing and distribution of a wide range of agrochemicals, including formulations and generic active ingredients. Their core competencies encompass identifying generic molecules, preparing dossiers, obtaining registrations, and distributing products in the fungicide, herbicide, and insecticide segments.
SHARDACROPCHEM.COM
In addition to agrochemicals, Sharda Cropchem supplies various conveyor belts, V-belts, and industrial chemicals. These products are primarily utilized in mining projects, steel plants, quarries, grain silos, cement manufacturing facilities, ports, and tunneling projects. The company serves markets across Europe, NAFTA, Latin America, and other regions worldwide.

BTC - Bullish for immediate target of 104 or abovechart clearly showing its wave 5 formation. if the up move is more it could be changed to wave 3 with sub waves later. clearly with good buying support price is stead and getting ready for up move. BTC is Bullish.

Bitcoin entering Support Zone - Time to Buywe need to thank all the news caused crypto to give a correction. In chart BTC is entering Support Zone. I do not buy any negative news now like tax war or new BRICS currency which are not a good reason which will stop big players from buying BTC at support levels. BTC is the biggest crypto in this world and irrespective of US new reserve comes or not. Trump is words first Crypto Leader now and in 2025 all crypto going to see new high levels due to wide acceptance of various countries and US state government start dealing in crypto which we never seen in any country history.

Melania - BuyIn chart there is slight RSI Divergence now indicating Buy side which could push price up in coming days along with BTC trend. In my view melania and trump coins are not completely shit coins since they are in power now so their coins will be used to pay get job done or it could be used in big circles related to us govt and etc etc. so as the new govt complete months and years they will be approving new projects, and these two coins could be used to pay commission etc

BTCUSD updated viewA resistance zone was created on BTCUSD at the 99113 - 99944 level.
Also at the same level from top to bottom one resistance trend line shows strong resistance in that area. while looking at the HNS pattern in RSI on a closing basis and both the resistance zone and trendline we need a strong closing above the zone with the trendline breaking, then we can see the bigger target in BTCUSD.
otherwise, BTCUSD will take the resistance from the trendline and zone and can see the support level again.
I already shared what-if support level breaks.
