BTCUSD - BITCOIN AT MAKE OR BREAK LEVELS ?Symbol - BTCUSD
Bitcoin has climbed higher in recent months on enthusiasm and demand generated by the nearly dozen spot bitcoin ETFs that were approved in January, as well as crypto's next 'halving' event and the prospect of Fed rate cuts this year.
But Fed rate cut expectations have been dialed back significantly amid hotter-than-expected inflation prints, which means central bankers look poised to keep rates higher for longer to fight inflation. Markets are now pricing in the fact that the Fed will only cut rates two times or less this year (as of now), according to the CME FedWatch tool.
BTCUSD CMP - 62,000
Bitcoin is currently trading & consolidating in a wide range of 61,000 - 72,000 levels.
Currently bitcoin is trading at lower range of this channel which is around 61,000-62,000 level.
60,000 is make or break level of Bitcoin as of now.
Bitcoin has to sustain above 60,000 - 61,000 for any further up move. On breakdown of these levels, We may see bitcoin coming back to 52,000 - 50,000 levels.
On sustaining 60,000 - 62,000 levels and moving up, we may see Bitcoin moving up to 85,000 and even 1,00,000.
For me, Sustaining and moving up/breakout scenerio is likely. So I'm taking positional long positions in BTCUSD at CMP 62,000 with SL below 60,000.
Incase BTCUSD breaking below 60,000 sustaining & closing below it. I'll close my long position & then I'll look to short it with SL above 62,000.
Cryptolevels

Bitcoin Technical Analysis- Bitcoin is currently hovering around the zone of overhead supply
- Bitcoin can keep consolidating or move sideways here and that's going to help Bitcoin throw up or shoot up big
- If Bitcoin gets rejected from here we can see an easy retracement to 65,000$ and then continue to move up
- Avoid leverage like I always say and try building/holding positions in spot
- Spot will save you from volatility much better than leverage if you still want to use leverage don't go beyond 2-3X

Reaching at 3400ETHUSD is looking for long opportunity after forming corrective formation, expecting target to reach at 3400

Long Opportunity Bitcoin is looking for buying opportunity after forming expanding channel & has clear formation to make movement to the upside, expecting target to reach at 68K

Reaching at 3400ETTHUSD is looking for long opportunity and expecting to reach at 3400$ and has forming correction on higher timeframe

Reaching at 67500BTCUSD is forming corrective formation for a movement to the downside after reaching at 67500

KNC/USDT Weekly Breakout | SWING TRADEIn KNCUSDT Swing Trade
If you're looking for a Crypto coin for swing trade,KNC could
be good option recently broken a 518 day Rang on weekly timeframe.
Its currently nealry 85% down from it all time high. so if you want to invest then
this is best coin.
Note - Only for education purpose.

Movement to the downsideETHUSD is looking for short after forming corrective formation & expecting target to reach at 2800$

Movement to the downsideBTCUSD is forming a corrective formation for a movement to the downside & reaching to reach at 59K
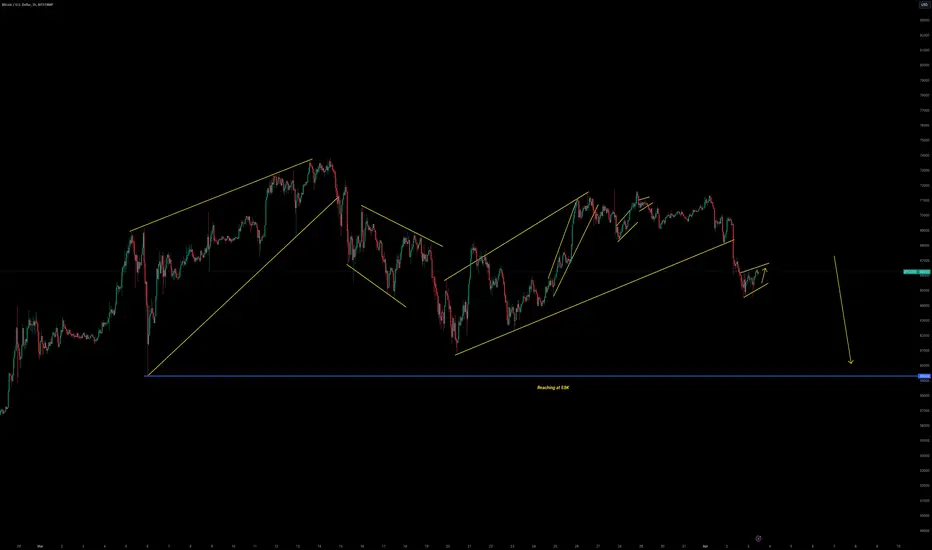
Movement to the downside BTCUSD has formed ascending channel for a movement to the downside expecting to reach at 59K

Meme Usdt Trade Setup - I don't post meme coins much
- The structure looks excellent and I cannot deny it
- MEME has a strong structure with a good base getting built in a 4h TF
- IMO 0.036-0.038 can be a good accumulation zone
- The price is currently trading at 0.040 and it's about to pierce and move up
- If you are already holding it then do not sell this

BTC ready for breakout BTC ready for breakout
BTC one possible upside breakout possible after a good consolidation sessions since many days
Breakout Level 71200
for Possible Target 73900 74000

BNB COIN BREAKOUT OCCURREDBNB COIN BREAKOUT OCCURRED
BNB showing a strong trendline breaking
So here a good sinario occurred for selling
Sell with a good amount
Never hesitate to sell because it's a strong signal because
1. It's breaked the strong NECKLINE
2. ITS seen rarely in chat it's very difficult to find such trade
Thank you trade safely
Stay happy

BTC Bullish Pole And Flag Breakout BTC Bullish Pole And Flag Breakout
BTC Ready for more 4000+ Points Bullish Move
Follow Chart for Entry and Target Levels
Targets - 71650 73800 max 900
BTC sustaining above 73900 = NEW ALL TIME HIGH

Looking for ShortETHUSD is forming a movement to the downside & expecting target to reach at 2800 by the end of March

Looking for ShortBTCUSD is forming a movement to the downside & expecting to reach at 59316 for the sell side

Looking for ShortETHUSD is looking for short & expecting target to reach at 2800$ & has clear movement to the downside.

Movement to downsideBTCUSD is looking for short after making ascending channel & has clear formation to the downside.
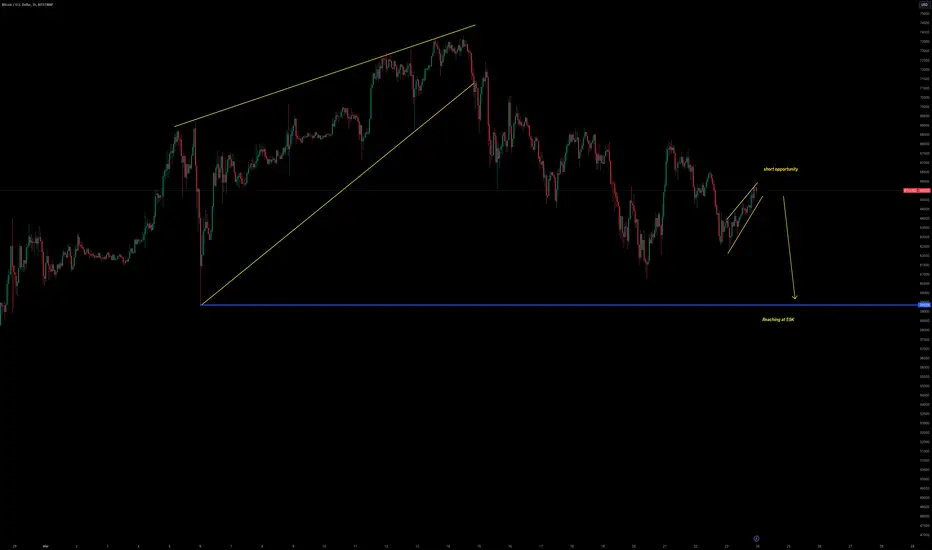
Looking for short!BTCUSD is looking for short after forming ascending channel & expecting a movement to the downside at 59K

Movement to the downsideBTCUSD is looking for downside after forming ascending channel on the left side waiting for conformation. Expecting target 57K

Avax Trade Idea Setup - Avax performed very nicely and bounced back very strongly too from the Bear Market
- The weekly chart for Avax clearly shows that it has broken all its overhead supply
- The only thing that can help you enter Avax next would be a great retracement back to the zones I have mentioned
- 20-30% RETRACEMENT from an Investment perspective should be an opportunity for you and not a Panic scenario

Bitcoin Trade SetupBitcoin is currently trading in a crucial zone
- Logically I think Bitcoin's price has not retracted a lot which is necessary
- Coming back to our thesis, if you are holding Bitcoin then you still can
- If you want to trade Bitcoin I think 59,000-64,000$ can be a great zone to accumulate it with 50% of your total investment value
- If you want to accumulate altcoins by looking at Bitcoin's price then my opinion would remain the same. However, you must consult your financial advisor before making any investments

FTM Bullish cup & handle patternBYBIT:FTMUSDT.P
FTM is forming 1day bullish pattern called cup and handle and it will give good return on breakout it can pump to 200% more on pattern breakout
