Institutional Option Trading Part -10Investment Strategies
Active Management: Constantly buying and selling assets to outperform benchmarks.
Passive Management: Tracking indices like the S&P 500 to match market performance.
Value Investing: Identifying undervalued stocks.
Growth Investing: Focusing on companies with high growth potential.
Quantitative Investing: Using mathematical models to guide investment decisions.
Risk Management
Diversification: Spreading investments across various sectors and assets.
Hedging: Using derivatives to offset risks.
Liquidity Management: Ensuring enough cash to meet obligations.
Regulatory Compliance: Adhering to financial regulations.
Cryptomarket

Institutional Option Trading Part -4Common Institutional Option Strategies
Covered Call Writing: Selling call options against stock holdings to generate income.
Protective Puts: Buying puts to insure portfolios against downside risk.
Spreads (Vertical, Horizontal, Diagonal): Limiting risk while aiming for a defined profit range.
Straddles and Strangles: Betting on volatility, regardless of market direction.
Iron Condors: Selling out-of-the-money calls and puts to profit from low volatility.
Tools and Platforms
Order Management Systems (OMS): To handle complex orders efficiently.
Execution Management Systems (EMS): For rapid and algorithmic order execution.
Advanced Analytical Software: For options pricing, risk assessment, and scenario analysis.
Advantages of Institutional Option Trading
Ability to execute large trades without significant slippage.
Access to lower fees due to trade volume.
Enhanced risk management capabilities.

Institutional Option Trading Part -5Institutional Option Trading
Institutional option trading involves using options as part of sophisticated strategies to hedge risk, enhance returns, or speculate.
Objectives of Institutional Option Trading
Hedging: Protecting large portfolios against market downturns.
Income Generation: Selling options to collect premiums.
Speculation: Taking directional bets with options.
Arbitrage: Exploiting price inefficiencies across markets.

Put Call Ratio (PCR) Explained in Simple TermsWhat is PCR?
The Put-Call Ratio (PCR) is a popular market sentiment indicator used in option trading. It helps traders understand whether more people are buying put options (bearish bets) or call options (bullish bets) at a given time.
Put Options: Contracts betting the price will go down.
Call Options: Contracts betting the price will go up.
How to Read PCR?
PCR < 1: More call options → Bullish sentiment.
PCR > 1: More put options → Bearish sentiment.
PCR = 1: Neutral sentiment.
But extreme values often suggest the opposite:
Very High PCR: Possible market reversal upwards (too many bearish bets).
Very Low PCR: Possible market reversal downwards (too many bullish bets).
Example:
Put OI: 5,00,000 contracts
Call OI: 10,00,000 contracts
PCR = 5,00,000 / 10,00,000 = 0.5 → This indicates bullish sentiment.
Why PCR Matters?
Helps identify market mood (bullish or bearish).
Gives contrarian signals (overcrowded trades can reverse).
Used in option trading strategies for timing entry and exit.

Learn Institutional Trading Pros and Cons
Pros: Early signals, useful for reversals.
Cons: Requires confirmation, may produce false signals.
Technical Trading
What is Technical Trading?
Technical trading focuses on using historical price data, volume, and technical indicators to predict future price movements. Traders use charts and patterns instead of company fundamentals.
Key Tools in Technical Trading
Price Charts: Candlestick, line, bar charts.
Indicators: Moving averages, RSI, MACD, Bollinger Bands.
Chart Patterns: Head and Shoulders, Triangles, Double Tops, Flags.
Support and Resistance Levels: Key price points where stocks reverse.

Why People Trade OptionsKey Components of Options
Strike Price: The pre-agreed price at which the option can be exercised.
Premium: The price you pay to buy the option contract.
Expiration Date: The date until which the option is valid.
Why People Trade Options
Leverage: Small investment, potential for large returns.
Hedging: Protects portfolio from losses.
Speculation: Betting on price movements.
Example
If a stock is currently priced at ₹500, you can buy a call option with a strike price of ₹550, expiring in one month, by paying a premium of ₹5. If the stock price rises to ₹600, you can buy at ₹550 and immediately sell at ₹600, making a profit.

Learn Institutional Trading Part-2What is Investing?
Investing involves committing your money to various assets like stocks, mutual funds, gold, real estate, or bonds to grow your wealth over time. Investing is generally a long-term strategy, focusing on the gradual accumulation of wealth.
Key Types of Investments
Stock Market Investments: Buying shares of companies.
Mutual Funds: Pooling money with other investors.
Bonds: Lending money to companies or governments for interest.
Gold & Real Estate: Physical assets that typically grow over time.
Investment Strategies
Value Investing: Buying undervalued stocks.
Growth Investing: Investing in companies with high growth potential.
Dividend Investing: Investing in companies that pay regular dividends.
Benefits of Investing
Builds wealth over time.
Helps fight inflation.
Provides financial security.

Learn Institutional Trading Part-4Technical Trading
Technical trading uses charts, patterns, and indicators to make decisions.
Traders study past price movements, volume, and signals to predict future trends instead of focusing on company financials.
Stock Market
The stock market is a place where shares of companies are bought and sold.
It’s like a big online shopping mall for stocks (e.g., NSE, BSE, NYSE). Prices go up and down based on demand, news, earnings, and investor emotions.

Bitcoin - Interesting Price Action in 1 HTFTRADERS AND INVESTORS,
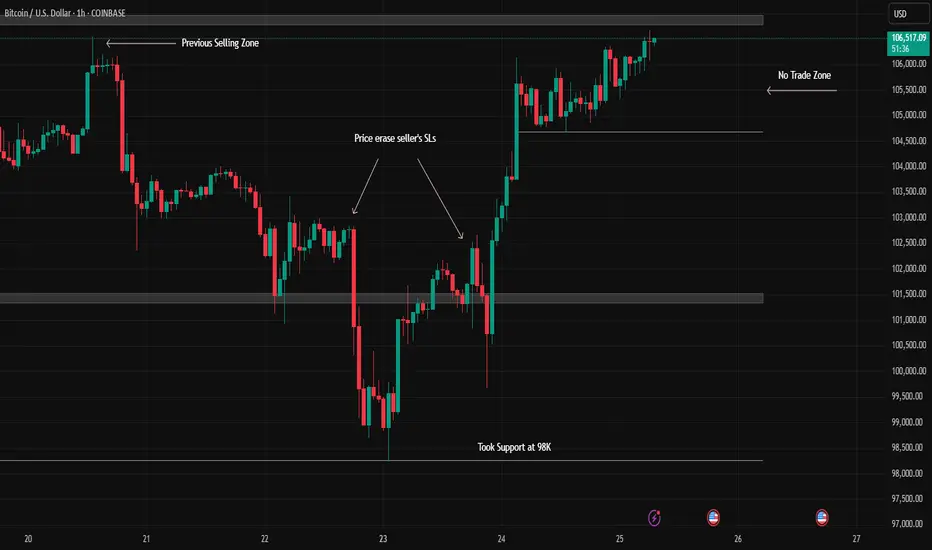
The Bitcoin chart presents an interesting setup on the 1-hour timeframe (1 HTF). Here's a breakdown of recent price action:
Initial Resistance & Downtrend : Bitcoin's chart indicated potential trend changes, with significant selling pressure at the $106,000 mark establishing a clear resistance level.
Downtrend Confirmation & Support : This was followed by a series of lower highs, confirming a downtrend. Subsequently, Bitcoin found support and bounced from the $98,000 level.
Potential Reversal Signal : The recent upward movement cleared sellers' stop-losses, which could be an early indication of a potential trend reversal.
WHAT MIGHT HAPPEN NEXT?
Currently, Bitcoin is re-testing the crucial $106,000 resistance level.
Bullish Scenario : A confirmed breakout and sustained move above $106,000 could signal the continuation of an uptrend.
Bearish Scenario : Conversely, a strong rejection from this level might lead to a decline, potentially targeting the $101,000 support.
Current Stance : At present, this area appears to be a no-trade zone due to the indecisive price action.
Disclaimer : This analysis is for educational purposes only and should not be considered financial advice. Always conduct your own research before making investment decisions.
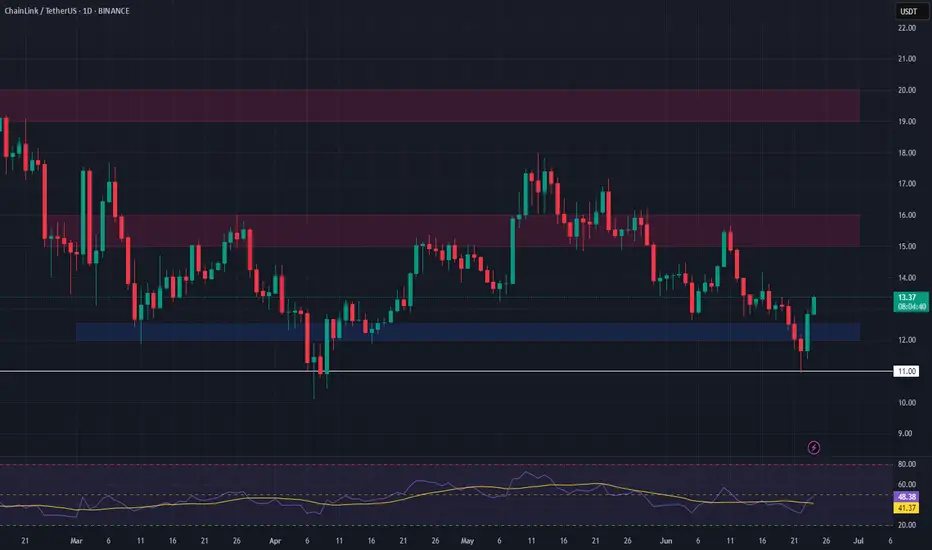
LINK Long Swing Setup – Higher Low Retest at Key SupportLINK has shown strong relative strength in recent weeks and is now retesting the $12 support zone. With broader markets stabilizing, this level could confirm a higher low and set the stage for continued upside.
📌 Trade Setup:
• Entry Zone: Around $12.00
• Take Profit Targets:
o 🥇 $15.00 – $16.00
o 🥈 $19.00 – $20.00
• Stop Loss: Daily close below $11.00
Bitcoin Bounce Alert: Holding the $100K Fortress! 📉 Market Context & Technical Levels
Key support at ~$100K: As the chart shows and multiple analysts confirm, this level continues to act as a strong defence zone. Cointelegraph noted bulls have been “defending the $100K key support level strongly,” triggering bounces during dips
Descending channel overhead: Bitcoin has retraced into a downward channel. A clean breakout above ~107K–109K (past recent peaks) is needed to signal a bullish shift .
Liquidity target at ~106K: Plenty of orders await in that region—flipping it to support may pave the way for another push higher .
📊 Indicators & Momentum
RSI dip near 25 during the latest drop indicates oversold conditions—often a precursor to rebounds
.
Volume surge on rebounds suggests absorbing sell pressure and strong accumulation interest at lower levels.
🚩 Key Price Zones to Watch
Level Significance
$100K Crucial support; losing it risks a slide toward $95K–97K or even $92K
.
$105K–106K Liquidity zone; flipping here as support could confirm upward momentum .
$107K–109K Resistance from channel tops and prior highs; a successful break is key to next leg up .
$112K–$112K+ If breakout occurs, upside targets extend toward prior ATH near $112K and beyond .
🎯 Chart Analysis Summary
Your chart shows three distinct bounces from the $100K–100.7K supply zone (highlighted in blue) and the latest one includes a sharp wick and rebound. This aligns with broader market dynamics emphasizing support at $100K and building liquidity at $106K. The arrow projection signals a probable retest of ~106K, with room to challenge ~107–109K after consolidation.
🧭 Trade Outlook
Bullish scenario: Hold above $100K → reclaim $106K → trendline breakout → potential rally to $112K+.
Bearish risk: Fails support at $100K → breakdown toward $95K–92K region.
📌 Bottom Line
Support $100K is alive and well. Bounces have been crisp and volume-backed.
Next test lies at $105–106K. That’s the battleground—flip it, and we may see bitcoin reclaim recent highs.
Watch the channel overhead (~107K–109K). A breakout could open the door to fresh records.
✅ Conclusion: BTC is defending its psychological base firmly. If this zone holds once more, the path to $106K and beyond is in focus. Breaking above demands conviction, but it’s the pivot to watch.

Learn Institutional Option Trading Part-1Risk and Return in Indian Investments:
Stock Market: High risk, high reward.
Mutual Funds: Moderate risk.
Fixed Deposits and Government Bonds: Low risk, lower returns.
Gold: Medium risk, often used as a hedge.
Factors Influencing Investment Choices:
Risk Appetite
Investment Horizon
Tax Benefits
Liquidity

Learn Institutional Option Trading Part-6Mutual Funds in India:
Mutual funds pool money from multiple investors and invest in a diversified portfolio.
Types:
Equity Mutual Funds
Debt Mutual Funds
Hybrid Funds
Index Funds & ETFs
Systematic Investment Plan (SIP) is a popular method to invest monthly with discipline.
Government Schemes:
PPF (Public Provident Fund)
NSC (National Savings Certificate)
EPF (Employees Provident Fund)
These are safe, tax-efficient, and suitable for conservative investors.

Learn Institutional Option Trading Part-5Stock Market Investing:
Stock investing involves buying shares of publicly traded companies listed on NSE or BSE.
Why Indians Invest in Stocks:
Potential for higher returns.
Dividend income.
Portfolio diversification.
Approaches to Investing:
Fundamental Analysis: Based on financial health, growth potential, and management quality.
Technical Analysis: Based on price patterns, volumes, and charts.
Long-Term Investing: Holding stocks for years to build wealth.
Short-Term Trading: Buying and selling stocks within days or weeks.

Learn Institutional Option Trading Part-4Recent Growth of Options in India:
Retail participation has surged.
Weekly expiry options (especially on Bank Nifty) have become extremely popular.
SEBI introduced lot size and margin regulations to control excessive speculation.
Investing in India
What is Investing?
Investing means allocating money into assets like stocks, mutual funds, bonds, gold, or real estate to earn returns over time.
Major Investment Options in India:
Equities (Shares)
Mutual Funds
Fixed Deposits
Public Provident Fund (PPF)
Gold (Physical and Digital)
Real Estate
Bonds and Debentures

Learn Institutional Option Trading Part-2Option Greeks in India:
Delta: Measures sensitivity to price changes.
Theta: Measures time decay.
Vega: Measures sensitivity to volatility.
Gamma: Measures change in Delta.
Indian traders use these Greeks to manage risk and optimize strategies.
Risks in Indian Option Trading:
Premium Decay: Loss in value as expiry approaches.
High Volatility: Can cause sudden losses.
Liquidity Risk: Some options have low trading volume.
Complexity: Requires deep market knowledge.

Learn Institutional Option Trading Part-10Popular Option Strategies in India:
Buying Call Options: Profit when the market rises.
Buying Put Options: Profit when the market falls.
Covered Call: Holding a stock and selling a call option to earn premiums.
Protective Put: Buying a put option to safeguard stock holdings.
Iron Condor: Earning from a range-bound market using multiple options.
Straddle and Strangle: Benefiting from high volatility.

Learn Institutional Option Trading Part-3In India, options are traded primarily on:
NSE (National Stock Exchange)
BSE (Bombay Stock Exchange)
The Securities and Exchange Board of India (SEBI) regulates the derivatives market and ensures fair practices.
Why is Option Trading Popular in India?
Leverage: Traders can control large positions with small capital.
Hedging: Investors use options to protect their portfolios from market fluctuations.
Income Generation: Strategies like covered calls can provide regular income.
Speculation: Traders can bet on price movements with limited risk.

Learn Advanced Institutional TradingOption trading is a part of the derivatives market where investors buy and sell contracts known as options. These contracts derive their value from an underlying asset, which can be a stock, index, commodity, or currency.
In India, the most commonly traded options are based on Nifty 50, Bank Nifty, and stocks like Reliance, TCS, Infosys, etc.
Options give traders the right, but not the obligation, to buy or sell the underlying asset at a predetermined price (strike price) before or on the expiry date.
Types of Options:
Call Option: Gives the buyer the right to buy the underlying asset.
Put Option: Gives the buyer the right to sell the underlying asset.

Option TradingIndia’s financial markets are rapidly evolving, and the participation of retail investors, institutions, and foreign players has significantly increased over the past two decades. Among various investment avenues, option trading, equity investing, and gold trading have become the most prominent ways of wealth creation and hedging against risks. Each of these segments has its unique importance, strategies, and regulatory frameworks in India.
This guide will help you understand the core concepts, market structure, strategies, and risks associated with Indian Option Trading, Equity Investing, and Gold Trading in a simple and practical manner.

BITCOIN back to 93k! It's happening....Bitcoin breaking the structure in higher timeframe lead to massive fall in a short term.
I mean bitcoin is going to fall around -10%(93k) this week or within next week.
Dollar is getting stronger with geopolitical tensions as you guys know the middle East conflict.
You guys may think , it is not a right time to enter to sell, yes I agree but there is much more to capitalise in the further down.
These are all my view , not a financial advise.

Ethereum Accumulation Zones Huge Dip Incoming- Ethereum is currently trading at 2262, down more than 22%
- Ethereum has two important areas to look at, and some important zones like 2110 & the OTEs 1694-1880$
- From an accumulation perspective, I would like to wait for ETH to purge either below the Inefficient gap or start going sideways at the buying zones
- To confirm this bias, we also need to make sure we consider taking a look at USDT D as well once it tops out, ETHs bottom will be near
- Manage risk properly and try to only trade in Spot

Compression Before Expansion: Market Awaits Its Next MoveBTCUSD – Compression Before Expansion: Market Awaits Its Next Move
Bitcoin is trading within a compressed structure after rejecting key resistance and retesting support. While the overall sentiment remains cautious, the technical setup is beginning to show signs of strength — if buyers can reclaim control.
🧭 Macro Check-In: Calm Before the Crypto Storm?
No rate cut from the Fed yet, but markets are starting to price in the possibility of a pause in Q3 or Q4.
ETF inflows slowing, but institutional positions are not closing — suggesting long-term conviction remains.
Political momentum in the US is shifting towards crypto adoption, with Bitcoin emerging as a talking point in election debates.
Dollar index (DXY) continues to chop, giving crypto room to breathe if inflation data remains mild.
In short: liquidity is building, but the trigger hasn’t fired — yet.
📊 Chart Structure (H1–H4): Levels That Matter
BTC is holding just above 103,100, a key level where previous demand stepped in.
The mid-range resistance lies at 104,184 — this needs to break for bulls to gain short-term control.
Above that, eyes are on 106,047, then 107,586 (top of the descending channel).
EMA alignment is still bearish → wait for structure shift, not FOMO.
📌 Trade Map
🔵 Buy Setup
Zone: 103,100 – 103,300
Condition: Bullish reaction + rejection wick / engulfing
SL: 102,600
TP: 104,184 → 106,047 → 107,586
🔴 Sell Setup (Only if trap triggers)
Zone: 107,500 – 107,800
Condition: Rejection + volume fade
SL: 108,200
TP: 106,000 → 104,500
🧠 Trader Insight
“When the chart compresses, smart money positions early.”
Bitcoin is not trending — it's accumulating or distributing. Retail is waiting for breakout. Smart traders are preparing for both scenarios.
Watch the reaction, not the prediction.
Stay objective. Let levels lead the logic.
