Option Trading Master classIntroduction to Investing and Option Trading
Investing and option trading are two pillars of wealth creation and risk management in modern finance. Investing focuses on long-term growth by acquiring assets that appreciate over time, while option trading involves strategic bets on price movements within a defined period using derivative contracts. Together, they offer investors a combination of growth, income, and hedging capabilities.
What is Investing?
Definition:
Investing is the process of allocating money into financial instruments (like stocks, bonds, ETFs, or real estate) with the expectation of generating a return over time.
Key Objectives:
Wealth accumulation
Passive income generation
Capital preservation
Beating inflation
Common Asset Classes:
Equity (Stocks): Ownership in companies
Fixed Income (Bonds): Lending capital to earn interest
Real Estate: Physical properties generating rental income
Mutual Funds/ETFs: Pooled investments
Commodities and Gold: Inflation hedges
Cryptomarket

Bitcoin Bounce & Breakout PlayChart Analysis:
🔹 Support Holding Strong:
BTC is respecting a key support area (~$105,600), which previously acted as resistance (marked by recent ATH).
🔹 EMA 70 (Blue Line):
Price is hovering above the EMA, adding bullish confirmation.
🔹 Bullish Projection Path:
The chart shows a projected bullish move toward the sell zone near $113,200 – $113,300, representing a potential 4.4% gain from the breakout.
🔹 Key Zones:
Support Zone: $105,600
Supply Zone: $100,500
Sell Zone (TP Zone): $113,200+
📌 Outlook:
If BTC breaks and holds above the resistance (~$107,000), a strong upward rally could follow.
Entry near support or on breakout, with tight risk management, offers a favorable risk/reward.
✅ Entry Options:
Breakout Entry:
Trigger: Break and close above $107,200
Confirmation: Retest and hold above the breakout zone
Entry: $107,300 – $107,500
Support Bounce Entry:
Trigger: Pullback to support zone (~$105,600) with bullish reversal candle
Entry: $105,600 – $105,800
🎯 Target Zones (TP):
TP1: $110,400 (minor resistance)
TP2: $113,200 – $113,300 (major sell zone)
TP3 (aggressive): $114,000+
🔻 Stop Loss (SL):
For breakout entry: SL below $106,200
For bounce entry: SL below $105,200 or $104,800 (structure break)
📈 Risk–Reward Ratio:
Approx. 1:2.5 to 1:3+ depending on entry and target
🧠 Trade Management:
Move SL to breakeven after hitting TP1
Partial profit booking at TP1
Trail remaining with manual or dynamic SL (e.g., below EMA or recent low)
⚠️ Risk Notes:
Avoid chasing price without breakout confirmation
Watch for fakeouts and heavy selling near TP zones
Adjust position size based on your risk tolerance

Learn institutional Trading Part -5Option Buying vs Selling
Option Buyers
Pay premium
Unlimited profit, limited risk
Need strong directional movement
Option Sellers (Writers)
Receive premium
Limited profit, unlimited risk
Thrive in sideways or range-bound markets
Need deep knowledge of Greeks and risk management
6. Popular Option Trading Strategies
Beginner Strategies
Long Call/Put – Directional trades
Protective Put – Hedge stock losses
Covered Call – Generate income from holdings
Intermediate Strategies
Bull Call Spread – Buy and sell calls of different strikes
Bear Put Spread – Buy and sell puts
Straddle – Buy both call and put at same strike (high volatility)
Strangle – Buy OTM call and put (cheaper than straddle)
Advanced Strategies
Iron Condor – Neutral strategy with 4 legs
Butterfly Spread – Limited risk range strategy
Calendar Spread – Exploiting time decay differences
Ratio Spread – More contracts sold than bought

Learn institution Trading Part -3How Option Prices Move – The Greeks
Delta: Sensitivity to price change in the underlying
Gamma: Rate of change of Delta
Theta: Time decay – loss in value as expiry nears
Vega: Sensitivity to Implied Volatility (IV)
Rho: Interest rate sensitivity
Understanding Greeks helps manage risk, adjust positions, and time trades better.
4. Why Traders Choose Options
Leverage: Control large positions with limited capital
Risk Control: Limited loss in buying options
Flexibility: Multiple strategies (bullish, bearish, neutral)
Hedging: Protect existing stock portfolios
Income Generation: Through writing options like covered calls

Master class 9. Introduction to Option Trading
Options are powerful derivative instruments that give buyers the right (not obligation) to buy or sell an underlying asset at a predetermined price within a specific time. They are commonly used for hedging, speculation, and income strategies.
There are two basic types:
Call Options: Right to buy
Put Options: Right to sell
Options derive value from stocks, indices (Nifty, Bank Nifty), commodities, or currencies and are traded on platforms like NSE in India.
2. Key Terminology in Option Trading
Strike Price: Price at which the option can be exercised
Premium: Cost of buying the option
Expiry: Last day the option is valid
Lot Size: Fixed number of underlying units (e.g., 50 for Nifty)
Intrinsic Value: Real value of an option if exercised now
Time Value: Portion of premium linked to time left before expiry
ATM/ITM/OTM: At The Money, In The Money, Out of The Money – defines moneyness of options

Advanced Technical Master classMulti-Timeframe Analysis involves analyzing multiple chart timeframes (Monthly, Weekly, Daily, 4H, 1H) to confirm trend direction and improve timing accuracy.
Application:
Identify long-term trend (Monthly/Weekly)
Use Daily/4H for entry signals
Filter noise with lower timeframes
Key Tools: Moving Averages, Trendlines, MACD
Module 2: Advanced Chart Patterns
Key Patterns Covered:
Harmonic Patterns (Gartley, Bat, Crab)
Elliott Waves (Impulse & Corrective Waves)
Wyckoff Method (Accumulation/Distribution Phases)
Practical Use:
Pattern + Volume = Strong Entry
Combine with Fib levels for reversal confirmation
Module 3: Volume Price Analysis (VPA)
Core Principle:
Volume precedes price. Learn to read volume spikes, absorption, and exhaustion.
Indicators to Use:
On Balance Volume (OBV)
Volume Profile
VWAP

Institution Master class Welcome to the Institution Trading Master Class, an advanced educational module crafted for serious traders and investors who want to understand how big institutions trade, move markets, and manage risk at scale. This course blends practical market experience with strategic tools and institutional concepts.
📘 Page 1: Understanding Institutional Trading
🔹 What is Institutional Trading?
Institutional trading refers to market activities performed by large entities like:
Mutual Funds
Pension Funds
Hedge Funds
Insurance Companies
Foreign Institutional Investors (FIIs)

BTC Near $100K – Breakdown or Bounce?BTC Near $100K – Breakdown or Bounce?
BTCUSD – Will Bitcoin Hold ₹100K Support Equivalent? Signs of Weakness Amid Global Caution
🧭 Global Market Context
Bitcoin is facing some serious resistance after failing to hold above the $108K zone. And just as Indian markets react to global cues, BTC is showing signs of stress too.
🔺 US bond yields are climbing again – bad news for crypto risk appetite
🧊 Spot Bitcoin ETFs continue to attract inflows, but not strong enough to push new highs
💵 The US Dollar (DXY) is gaining strength again as investors flee risk — and that puts pressure on Bitcoin
Add to that the recent institutional sell-off, and it’s clear: BTC may need to “cool off” before another rally.
📉 Technical Picture (1H)
Bitcoin is showing a classic lower-high, lower-low pattern. A clear downtrend is in motion:
Price is below all key EMAs (34/89/200), with every rally being sold off
Important resistance sits at 106,000 – 107,000
Major support levels are now at 102,821, then 101,539, and if pressure continues — 100,419 (₹83+ lakh level for reference)
Momentum indicators like RSI are flat. No strength yet. And without a solid bullish candle from support, buyers may stay away.
🔎 Strategy Plan for Indian Traders
🔻 Short-term SELL Setup
Entry: 106,000 – 107,000
SL: 107,500
Targets: 102,821 → 101,539 → 100,419
🧠 Ideal for short-term traders looking to follow the trend
🔹 Medium-term BUY Setup (only if price reacts from 100K zone)
Entry: 100,500 – 100,800
SL: 99,800
Targets: 102,800 → 104,400 → 106,000
⚠️ Wait for bullish confirmation — avoid bottom fishing blindly
📌 Final Thought
Bitcoin is in a danger zone right now. If it loses grip on $100K support, we may see panic selling from leveraged traders. But this zone also holds opportunity — a strong bounce could spark a fresh rally.
🧘 Trade with patience. Don't chase. Let the market come to you.

360 ONE – Bullish breakout360 ONE (NSE: 360ONE), a leading wealth and asset management firm in India, is showing strong bullish momentum backed by:
✅ Consistent Growth in AUM: The company continues to scale its assets under management with high-net-worth and ultra-HNI client acquisition.
✅ Strong Quarterly Results: Robust revenue growth and improving profit margins signal efficient operations and increased demand for wealth management services.
✅ Technically Sound Setup:
The stock has broken out from a key resistance zone with rising volumes.
Trading above all major EMAs (20/50/200), confirming a strong uptrend.
RSI is in bullish territory (>60), indicating momentum is intact.
✅ Sectoral Tailwind: The shift from traditional investments to managed wealth products is boosting firms like 360 ONE.
🟢 Price Action Suggests Further Upside
With growing investor confidence and institutional interest, the stock is poised for a potential 10–15% move in the near term, if it sustains above the breakout level.

"Bearish Reversal Opportunity Following Supply Zone Rejection"1. Double Top Formation (Resistance Level Identified)
The chart displays a clear double top structure at the 2,760–2,800 USDT level.
This level has acted as a strong supply zone (highlighted in red), where price previously reversed, indicating heavy selling interest.
Current price action has retested this resistance zone and shown signs of rejection.
2. Liquidity Sweeps & False Breakouts
On the left side of the chart, an aggressive downward wick (marked with a blue arrow) suggests a liquidity sweep below a key low before strong bullish momentum returned.
This type of price action indicates smart money involvement, designed to remove weak hands before pushing price higher.
3. Accumulation Phases (Sideways Consolidation)
Multiple accumulation ranges are highlighted with blue rectangles.
These ranges show horizontal consolidation, where price builds up energy before breakout.
The most recent breakout led to a vertical rally toward the resistance zone, signaling an end of the accumulation and a start of distribution.
4. Double Bottom Support Structure
Identified near the 2,480 level, marked by red circles.
This level has historically acted as demand/support, evidenced by multiple bounces from this price zone.
Now highlighted with a grey zone, it is projected to act as the next key support area.
5. Bearish Projection
A large black arrow suggests a forecasted bearish move from the current high (~2,800) back to the support zone (~2,480).
This aligns with the idea of a mean reversion or pullback after a strong bullish impulse.
---
Conclusion & Trade Idea:
🔻 Bias: Bearish (Short-term)
The chart presents a classic reversal pattern with a double top at a well-defined supply zone.
Entry could be considered after confirmation of rejection from this level.
🧠 Trade Plan Suggestion:
Entry: Short near 2,780–2,800 after bearish confirmation (e.g., bearish engulfing candle or break of structure).
Target: 2,480 (support zone).
Stop Loss: Above 2,820 (recent high).
Risk-Reward: Approximately 1:2.5 or better depending on execution.

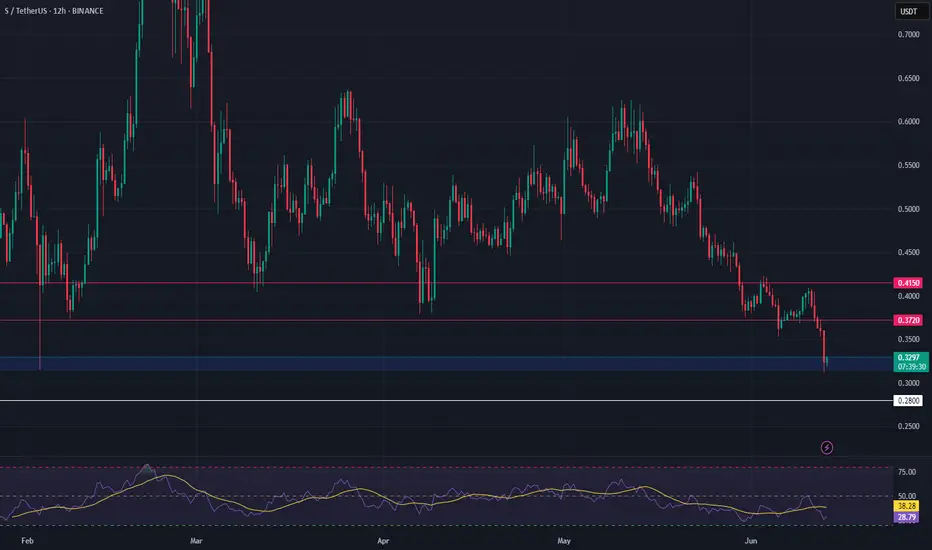
S Long Swing Setup – Retest of February Lows at Key SupportS is pulling back and now approaching a critical support zone, testing the February 2025 lows near $0.31. This area marks a key level for potential accumulation, offering a favorable long setup.
📌 Trade Setup:
• Entry Zone: $0.315 – $0.330
• Take Profit Targets:
o 🥇 $0.372
o 🥈 $0.415
• Stop Loss: Daily close below $0.280
Institution Option Trading Part-7Regulatory & Risk Considerations
SEBI (India) & SEC (US) regulations limit speculative exposure.
Institutions must report Open Interest, Position Limits, Margin Usage.
Must adhere to VaR (Value at Risk) frameworks and internal risk policies.
Institutional Trading during Events
Earnings Seasons: Institutions use straddles/strangles for earnings plays.
Budget or RBI Policy: Protective collars/volatility trades.
Global Crisis (e.g. COVID): Use of massive protective puts (SPX, NIFTY).
VIX & Institutional Behavior
India VIX plays a vital role in determining institutional option strategies.
High VIX = buying protection, long gamma strategies.
Low VIX = selling premium, income strategies.

Institution Option Trading Part-1Role of Market Makers & Liquidity Providers
Institutions often rely on market makers for tight bid-ask spreads.
Market makers hedge every trade using delta-neutral strategies.
Their presence helps institutions build or unwind large positions without disrupting prices.
Institutional Examples in Option Trading
Hedge Funds: Use volatility arbitrage, gamma scalping, dispersion trading.
Insurance Firms: Use long-dated puts to hedge annuity products.
Banks: Write structured products with option-like features (e.g., equity-linked notes).
Asset Managers: Use protective puts or collars on core portfolios.

Institution Option Trading Part-2.0Institutional Order Flow – Market Impact
Option Flow as Signal: Large trades in options market may indicate upcoming moves in underlying assets.
Unusual Options Activity (UOA): Tracked by smart money traders to anticipate institutional moves.
Dark Pools: Institutions often use off-exchange mechanisms to avoid price impact.
Tools & Analytics Used by Institutions
Volatility Surface Analysis
Greeks Sensitivity Scans (Delta, Gamma, Vega, Theta)
Skew Charts & Term Structure
Trade Cost Analysis (TCA)
Liquidity Heatmaps
Algo Execution Strategies (TWAP, VWAP)

Institution Option Trading Part-6Introduction to Institutional Option Trading
Institutional option trading refers to the use of options by large financial institutions such as hedge funds, pension funds, insurance companies, mutual funds, and proprietary trading desks to manage risk, enhance returns, or speculate on price movements. Unlike retail traders, institutions bring scale, research, and complex strategies to the options market.
Slide 2: Key Characteristics of Institutional Traders
Large Capital Base: Institutions trade in bulk with millions or billions of dollars.
Data Advantage: Access to premium data, analytics, and predictive algorithms.
Advanced Infrastructure: High-frequency execution systems, smart order routing.
Risk Management Focus: Use options for hedging equity, credit, FX, or commodity exposure.
Regulatory Boundaries: Subject to risk limits, compliance, and disclosures

Institution Option Trading Part-5Popular Strategies Tested via Option Database
IV Crush Earnings Strategy
Buy/sell options before earnings when IV is high, expecting post-earnings IV drop.
High OI Breakouts
Trade breakouts from strikes with high OI using price+OI correlation.
Skew Arbitrage
Analyze IV skew and trade underpriced/overpriced strikes accordingly.
Time Decay Capture (Theta)
Sell options with high Theta before expiry using historical decay rates.
💡 Advantages of Option Database Trading
Quantitative Edge: Allows logic-based decisions over emotion-driven trades.
Backtesting Confidence: Know the probability of success before risking capital.
Scalability: Can analyze hundreds of symbols and expiry combinations.
Automation Ready: Can link with brokers to run fully algorithmic systems.

Institution Option Trading Part-3How Option Database Trading Works (Step-by-Step)
Step 1: Data Collection
Real-time data from NSE, BSE, CBOE, or broker APIs (Zerodha, Interactive Brokers, etc.).
Store tick-level or EOD snapshots into SQL/NoSQL databases.
Step 2: Data Cleaning & Normalization
Remove missing values, align timestamps, convert formats.
Normalize values like IV to make models consistent.
Step 3: Exploratory Data Analysis (EDA)
Use Python (Pandas, Matplotlib) or R to analyze:
Option volume spikes
Volatility contraction/expansion
Unusual OI build-ups
Step 4: Backtesting Trading Strategies
Strategies like Straddle, Strangle, Iron Condor, or IV Crush are tested.
Entry/exit logic coded, and trades simulated on historical data.
Step 5: Deploying Models
Successful strategies get automated using APIs or Trading Bots.
Regular performance metrics tracked and refined.

Option Trading with Professionals Why is Option Data Important?
Pattern Recognition: Historical data helps spot repeatable patterns across expiry dates, strikes, or underlyings.
Volatility Analysis: IV and HV trends assist in detecting overpriced or underpriced options.
Liquidity Study: OI and Volume data help identify where smart money is moving.
Strategy Development: Backtesting using past data validates the strength of a strategy before real capital is deployed.
Market Sentiment Gauge: Changes in IV, OI, and skew can reflect trader sentiment and possible direction.
🧰 Core Components of an Option Database
A fully functional options database setup typically includes:
1. Options Chain Data
Captures details like Strike Price, Expiry Date, LTP, IV, Bid/Ask Spread, Greeks.
Should be stored with timestamps and unique IDs for reference.
2. Open Interest & Volume History
Time-series data showing how OI and volume evolved intraday and over time.
3. Volatility Surfaces
3D models showing how IV changes with strike and time to maturity.
4. Underlying Asset Data
Historical prices, volume, dividends, splits, news events, and earnings.
5. Event Tags
Earnings announcements, economic reports, corporate actions tagged for context during backtesting.

Power of India VixWhy India VIX Matters?
✅ Predicts Market Sentiment: Spikes in VIX often precede sharp market moves.
✅ Option Pricing Insight: High VIX = Expensive Options; Low VIX = Cheaper Options.
✅ Helps Strategy Selection:
High VIX: Favor credit strategies (Iron Condor, Strangle Sell).
Low VIX: Favor debit strategies (Buy Call/Put, Spread Buy).
✅ Risk Management Tool: Helps gauge when to reduce exposure or go aggressive.
Option trading is a financial strategy where traders buy and sell options contracts — financial instruments that derive value from underlying assets like stocks or indices. Each option gives the buyer the right (not obligation) to buy (Call) or sell (Put) at a specified price before expiry.

Trading Road Map 1. Foundation Stage (Beginner Level)
Understand Markets: Equity, Commodity, Forex, Derivatives
Basic Concepts: What is a stock, index, option, futures
Learn Platforms: TradingView, Zerodha, Upstox
Risk Awareness: Avoid FOMO, control emotions, capital safety
🔹 2. Skill Building Stage (Intermediate Level)
Technical Analysis: Charts, Patterns, Indicators (MACD, RSI, Moving Averages)
Fundamental Analysis: Earnings, Balance Sheets, PE ratio
Paper Trading: Practice without risking money
Journaling: Track trades, wins/losses, and learn from mistakes
🔹 3. Strategy Development (Advanced Level)
Create Systems: Scalping, Swing, Positional
Options Mastery: Strategies like Iron Condor, Straddle, Spread
Risk Management: Position sizing, SL rules, R:R ratio
Backtesting: Validate your strategy on historical data
🔹 4. Execution & Scaling (Pro Level)
Discipline & Psychology: Stick to plans, stay unemotional
Automation & Tools: Algo Trading, Screeners
Capital Scaling: From ₹10K to ₹10L+ systematically
Diversification: Trade across assets, build passive income

Trading with Experts What is Option Trading?
Option trading is a financial strategy where traders buy and sell options contracts — financial instruments that derive value from underlying assets like stocks or indices. Each option gives the buyer the right (not obligation) to buy (Call) or sell (Put) at a specified price before expiry.
🔹 Types of Options:
Call Option – Right to Buy
Put Option – Right to Sell
Index Options – Based on Nifty, Bank Nifty, etc.
Stock Options – Based on individual stocks (e.g., Reliance, HDFCBANK)
🔹 Key Components:
Strike Price – Agreed price to buy/sell
Premium – Price paid for the option
Expiry Date – Validity of the contract
Lot Size – Fixed quantity of shares per contract
ITM, ATM, OTM – In-the-money, At-the-money, Out-of-the-money
🔹 Why Trade Options?
✅ Leverage with less capital
✅ Hedging portfolio risk
✅ Strategic plays (Bullish, Bearish, Neutral)
✅ Income generation via selling options

Option Trading Master ClassOption Trading Master Class – Overview
🔹 Module 1: Basics of Options
What are Options? (Call vs Put)
Terminologies: Strike Price, Premium, Expiry, Lot Size
European vs American Options
🔹 Module 2: Options Pricing & Greeks
Intrinsic vs Extrinsic Value
Option Greeks: Delta, Gamma, Theta, Vega, Rho
How volatility affects option price
🔹 Module 3: Strategies for Beginners
Covered Call, Protective Put
Bull Call Spread, Bear Put Spread
Pros & Risks of each strategy
🔹 Module 4: Advanced Strategies
Iron Condor, Straddle, Strangle
Butterfly Spreads, Calendar Spreads
Adjusting positions for risk
🔹 Module 5: Live Market Application
Using Option Chain Analysis
Open Interest & Volume Interpretation
Entry/Exit points with technical support
🔹 Module 6: Psychology & Risk Management
Avoiding overtrading & expiry traps
Position sizing, SL rules
Emotional discipline in volatile markets

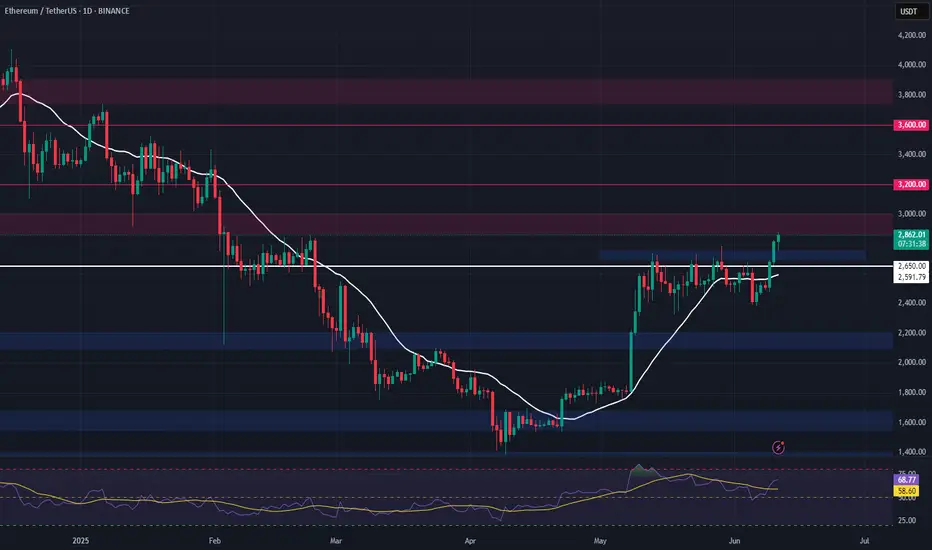
ETH Long Swing Setup – Breakout Retest of Key ResistanceETH has broken above the critical $2,750 resistance, signaling bullish momentum. We’re now watching for a retrace into the $2,700–$2,750 zone, which is expected to act as support for a continuation higher.
📌 Trade Setup:
• Entry Zone: $2,700 – $2,750
• Take Profit Targets:
o 🥇 $3,000
o 🥈 $3,200
o 🥉 $3,700
• Stop Loss: Daily close below $2,650