database trading Database trading involves the exchange of data assets, which can include raw data, processed data, or access rights to specific datasets.
Database trading refers to the buying and selling of databases or data-related products, often for financial or commercial purposes, encompassing large datasets, data assets, or rights to access specific data.
Cryptomarket

Importance of RSIThe Relative Strength Index (RSI) is a crucial momentum indicator in technical analysis, helping traders identify potential overbought or oversold conditions and gauge the strength of price movements, ultimately aiding in making informed trading decisions

basic of support and resistanceSupport occurs at the point where a downtrend is expected to pause due to a concentration of demand. Resistance occurs at the point where an uptrend is expected to pause due to a concentration of supply. Support and resistance areas can be identified on charts using trendlines and moving averages.

BITCOIN MAY DROP TO 74K - BEARISH STRUCTURE INTACTSymbol - BTCUSD
CMP - 84600
BTCUSD is undergoing a shift in market structure, transitioning into a bearish phase following the breakdown at 90K. A deeper correction is currently developing, which, in my view, represents a logical and technically sound progression for a healthy market. It is concerning when the market only experiences upward movement driven solely by buying pressure, such as in the case of large-scale injections of funds into high-yield investment programs (HYIPs).
A correction in Bitcoin’s price or even a trend reversal could inject vitality back into the market. From a fundamental perspective, traders have not seen the expected active support for cryptocurrencies from the US, which was previously suggested during Trump's election campaign. Additionally, issues such as crypto exchange hacks, fraudulent coins, and Bitcoin's dominance are exerting negative pressure on altcoins.
Bitcoin’s current downturn, with the possibility of a further drop to the 75K-73K range, could present an opportunity for fundamentally strong altcoins, assuming the declining Bitcoin dominance index also continues to trend downward. The simultaneous reallocation of funds from Bitcoin to altcoins, along with a rebound in Bitcoin from a strong support level, could rejuvenate the prospects for an altcoin season.
Resistance levels: 88150, 90700
Support levels: 75000, 73570, 66830
A modest retracement towards the 88100 to 90700 range is possible before the price begins its descent. While Bitcoin may attempt a deeper pullback, the current market imbalance, coupled with the absence of a clear driving force or supportive factors, suggests that the price may continue to fall in the medium term, potentially reaching the liquidity zone between 75K and 73K

BITCOIN - LIKELIHOOD OF A SHORT SQUEEZE BEFORE A DOWNWARD SLIDESymbol - BTCUSD
CMP - 84540
BTCUSD continues to exhibit a bearish trend after breaking the bullish structure on the weekly timeframe. There are no discernible bullish drivers at present, and from a technical standpoint, the price is poised to approach the imbalance zone between 75K and 73K.
Recent events, such as the crypto summit and discussions surrounding crypto asset support, have failed to provide substantial backing for the market. These events have historically been followed by further market declines.
From a technical perspective, the market remains in a downtrend, indicative of a global counter-trend. This suggests that the current price movement is contrary to broader market sentiment, which aligns with typical market behavior. On a general scale, key zones of interest include 75K, 73K, and the order block between 69K and 66K.
On a more specific level, attention should be given to the nearest liquidity zones at the higher levels, which may be tested prior to any further declines. These levels are located at 86,697 and 89,397
Key Resistance levels: 85135, 86678, 89397
Key Support levels: 79987, 78173, 73512
Following the false break of the 78K support level, there has been no significant market reaction. The market appears to be consolidating within the 84-85K range, which suggests a weakening of buying interest. Prior to any further downward movement, there may be a short squeeze within the identified liquidity zones, potentially leading to an additional decline.

Huge fall in bitcoin, let's play some contra now with small SLHello Traders! In today’s post, we’re looking at Bitcoin (BTC) on the 15-minute chart. The price is currently showing a potential reversal setup, with the market consolidating around 78,000. The recent price action suggests that Bitcoin could either push higher or face further downside depending on how it reacts to this level.
The MACD is showing some Bullish crossver on chart, may be we can see some positive reversal momentum from here, but watch for the price action to confirm whether a reversal is likely. If Bitcoin does not take our stop loss, we could see a move toward 79,892. Stay sharp, and as always, manage your risk effectively!
Disclaimer: This analysis is for educational purposes only. Please consult a financial advisor before making investment decisions.
If you Found this helpful? Don’t forget to like, share, and drop your thoughts in the comments below.

Bitcoin - 140 K in 2025 - 5th wave targetPrice is at technically buying zone - Fib buy zone and also breakout zone and right now double bottom. at any price around this price based on big players buying orders fourth wave will get completed and 5th wave will start. Breakout of resistance red line is confirmation of 5th wave progress. previous resistance areas could give selling pressures due to tax fears and global recession fears. Supporting reasons - Strategic reserve and US Govt is one new player now. what ever buying happening during bear trend will be visible only in data about who is buying like Black Rock, Strategy - Saylor etc. As and when positive mood comes in market BTC will keep bouncing back and price is accumulation area for sure for big players. This is not a time to sell but to accumulate BTC for sure. All tax war will only slowdown the BTC up move but will not fall further much. But still hold long qty with required margins and to be safe keep liquidation levels as 73 at least to be safer to avoid any big liquidation candle in case any exchange liquidate retail people's holdings. US Strategic reserve data is awaited. Every Monday Saylor in his X profile posting his purchases and Black Rock too seen buying BTC last several days or weeks, Price is dropping since loose hands sell in fear. As per data, spot buyers didnt sell at all. Its only traders with 50x or 100x moving the market.

QUICKUSDT - FALSE BREAKOUT OF RESISTANCESymbol - QUICKUSDT
CMP - 0.0290
QUICKUSDT is currently exhibiting a counter-trend move toward the resistance level within the range of 0.0295, A false breakdown of this key level has occurred amidst the prevailing downtrend.
The cryptocurrency market is undergoing a period of significant challenges. While Bitcoin is testing new lows around 77K, altcoins are continuing their downward trajectory in search of additional support levels. Notably, QUICKUSDT stands out by testing a strong resistance/liquidity zone between 0.0284 and 0.0295, where a false breakout is forming.
However, in the morning session, Bitcoin shows signs of strengthening after a substantial decline, potentially exerting upward pressure on the broader market. As such, prior to any further decline, there may be another attempt to retest the 0.0295 level or update the false breakout tail around 0.0300 (0.7 Fibonacci retracement)
Key resistance levels: 0.0285, 0.0295, 0.0300
Key support levels: 0.0243, 0.0211
Should the next resistance retest result in a false breakdown with price consolidation below 0.0295, QUICK coin could continue its decline in the short to medium term.

basics of technical anylasisTechnical analysis seeks to predict price movements by examining historical data, mainly price and volume. It helps traders and investors navigate the gap between intrinsic value and market price by leveraging techniques like statistical analysis and behavioral economics.

overview of financial marketsFinancial Markets include any place or system that provides buyers and sellers the means to trade financial instruments, including bonds, equities, the various international currencies, and derivatives. Financial markets facilitate the interaction between those who need capital with those who have capital to invest

MEWUSDT - EYEING KEY LEVELS FOR A POTENTIAL DROP AHEADSymbol - MEWUSDT
MEWUSDT pair is currently in the distribution phase, testing a significant resistance and liquidity zone, where it has exhibited a false breakout. In light of the current market conditions, it is crucial to monitor several key levels, including both support and resistance.
A potential retest of the 0.00300 - 0.00312 range is likely, with the possibility of targeting another liquidity zone before MEWUSDT resumes its downward movement in alignment with the prevailing local and global market trends. These trends are characterized by a weakening Bitcoin and an overall sluggish cryptocurrency market.
Key Resistance Levels: 0.002793, 0.00300, 0.00312
Key Support Level: 0.002696
The primary support level at 0.002696 is critical, as it aims to prevent further market decline. Should the price fall below this level, there is a lack of significant support, potentially allowing for a strong move downward. A breakdown and sustained consolidation beneath the 0.002696 level could trigger a substantial impulse toward target zones around 0.00222 and 0.00200

BTCUSD Buy setup Bitcoin (BTC) - A Brief Description
Bitcoin (BTC) is the world's first and most widely recognized cryptocurrency. It was created in 2009 by an anonymous person or group known as Satoshi Nakamoto. Bitcoin operates on a decentralized, peer-to-peer network using blockchain technology, which ensures transparency, security, and immutability of transactions.
Unlike traditional currencies issued by governments (fiat money), Bitcoin is not controlled by any central authority such as banks or governments. Instead, it is maintained by a distributed network of computers (nodes) through a process called mining, where transactions are verified and recorded on the blockchain.
Key Features of Bitcoin:
1. Decentralization – No single entity controls Bitcoin.
2. Limited Supply – Only 21 million BTC will ever exist, making it scarce.
3. Security – Uses cryptographic techniques to ensure safe transactions.
4. Transparency – Transactions are recorded on a public ledger (blockchain).
5. Fast and Borderless Transactions – Can be sent anywhere in the world without intermediaries.
6. Store of Value – Often referred to as "digital gold" due to its potential as a hedge against inflation.
Bitcoin is widely used for investment, trading, and online payments, and it has influenced the creation of thousands of other cryptocurrencies.

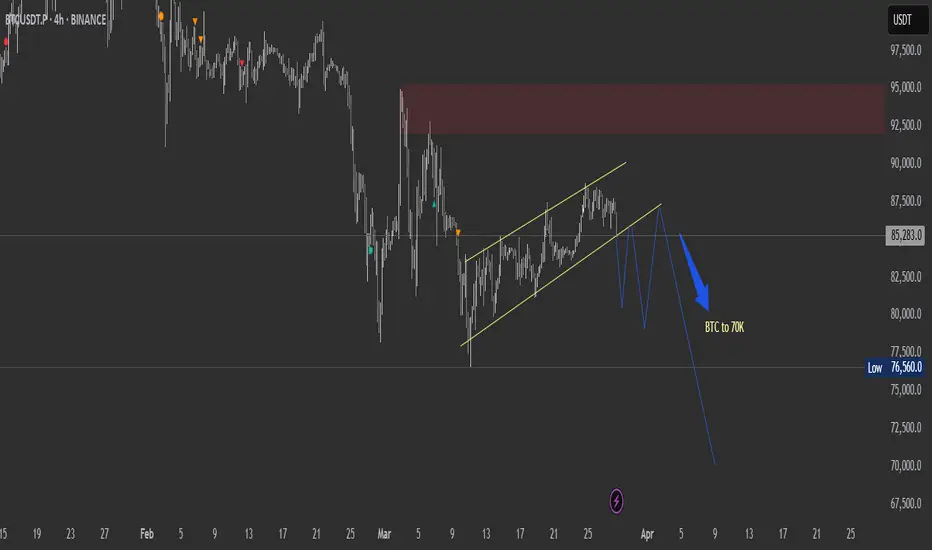
BTC to touch 70K if it breaksdown from this zoneTechnical analysis on the 4-hour chart suggests forming a bearish flag pattern—a continuation pattern that typically indicates a pause before the prevailing downtrend resumes.
If the current bearish flag pattern breaks down, Bitcoin's price could potentially decline to around $70,000. Such projections are based on technical analyses that consider factors like weak support levels and historical price movements.
LAYERUSDT - TIME FOR REVERSAL?Symbol - LAYERUSDT
CMP - 1.4200
LAYERUSDT is currently exhibiting a consolidation phase within an ongoing uptrend. The asset is outperforming the broader market; however, the initial reaction to the significant resistance at 1.4200 may result in a false breakout, followed by a retracement towards 1.275 or the 0.5 Fibonacci level.
Since the start of the session, LAYERUSDT has surpassed its daily Average True Range (ATR). However, upon encountering resistance, the coin may lack the momentum required for sustained upward movement. Liquidity in the vicinity of the 1.4200 level could serve to restrict price action, hindering the asset’s ability to break through this barrier on the first attempt.
At present, Bitcoin is testing its trend resistance, which could potentially lead to a reversal or continuation of its current downtrend, influencing altcoin prices accordingly.
Resistance levels: 1.4200, 1.4900
Support levels: 1.2932, 1.2747
The outcome hinges on the price's response at the 1.400 level. A sharp and distributive approach, with a high probability, is expected to result in a false breakout and a correction towards the aforementioned support levels. However, should LAYERUSDT show signs of slowing down and consolidating near 1.4000, there could be an attempt at a breakout, with further price movement dependent on the outcome of that attempt.

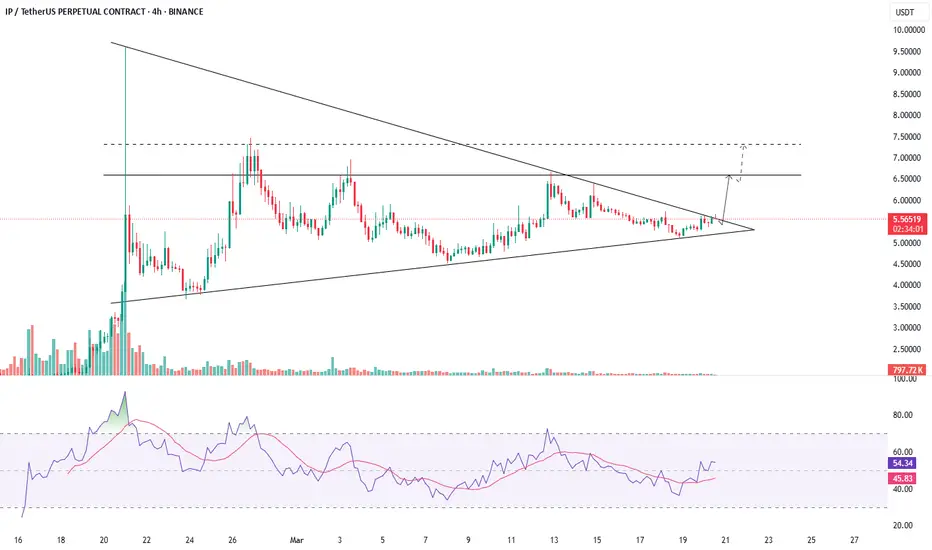
IPUSDT - POISED FOR A BREAKOUTSymbol - IPUSDT
CMP - 5.5500
IPUSDT is currently establishing favorable conditions for potential growth. Bitcoin has provided a modest boost to the market following positive developments regarding the SEC and XRP, a factor that has not gone unnoticed within the crypto community.
The IPUSDT coin has experienced an extended period of consolidation, forming a symmetrical triangle pattern. The upward trend in lows, coupled with the consolidation phase and the subsequent breakout above the triangle's resistance, signals positive indications of a potential distribution phase (the culmination of the consolidation). The key resistance level at 5.6297 remains a crucial barrier, separating the market from a more liberated zone.
Resistance levels: 5.6297, 6.6310
Support levels: 5.1160, 4.7830
Over the past few days, the price has consistently approached the triangle resistance and is building momentum for a potential breakout. Multiple intraday retests of this region demonstrate market interest in surpassing this boundary. A successful breakout above the 5.6297 resistance level, followed by consolidation above the triangle, would serve as a strong signal of readiness for upward movement.
ETH - Target 2200 - BullishETH has fallen a lot and taking support and move is bullish in line with BTC move. At these great levels buying, accumulating and investing in ETH is safe and for traders once the fourth wave is complete price is easy to see 2200 for fifth wave. ETH is good buy now. I expect small correction in BTC to complete and rise again or above 88K . Even if BTC correction is bigger ETH may not fall much since it has fallen a lot so its better to long in ETH more than in BTC now.

Advanced Technical ConceptOn the other hand, hidden divergence occurs when the price makes a lower low, but the RSI indicator makes a higher low, signaling a potential trend continuation. RSI Divergence occurs when the price movement and the RSI indicator move in opposite directions, signaling a potential reversal in the current trend.
Divergence within RSI through price movements is a powerful indication that there will be reversals in the market. There are two types of divergences: bullish divergences and bearish divergences. 1. Bullish divergence

Financial Markets Financial Markets include any place or system that provides buyers and sellers the means to trade financial instruments, including bonds, equities, the various international currencies, and derivatives.
Some examples: bank or credit unions, for loans or savings accounts. securities markets, such as the New York Stock Exchange or the American Stock Exchange, for businesses to acquire investment capital, mutual funds, or bonds.

Advanced Patterns Trading Chart patterns are visual representations of price movements used in technical analysis to predict future market behavior, categorized as continuation, reversal, or bilateral, and can signal potential trend continuation, reversal, or volatility.
Top Picks: The Most Successful, Profitable, and Reliable Chart Patterns
Head and Shoulders Pattern.
Double Tops and Double Bottom.
Cup and Handle.
Ascending/Descending Triangles.
Bullish and Bearish Flags.
Wedge Patterns (Rising/Falling Wedges)
Triple Tops and Triple Bottoms.
Symmetrical Triangles.

Advanced Swing Trading Strategy with Pcr Part-1So, an average put-call ratio of 0.7 for equities is considered a good basis for evaluating sentiment. In general: A rising put-call ratio, or a ratio greater than 0.7 or exceeding 1, means that equity traders are buying more puts than calls. It suggests that bearish sentiment is building in the market.
The Put-Call Ratio (PCR) is a popular technical indicator used by investors to assess market sentiment. It is calculated by dividing the volume or open interest of put options by call options over a specific time period. A higher PCR suggests bearish sentiment, while a lower PCR indicates bullish sentiment.

Divergence Trading With ProfessionalsDivergence in an uptrend occurs when price makes a higher high but the indicator does not. In a downtrend, divergence occurs when price makes a lower low, but the indicator does not. When divergence is spotted, there is a higher probability of a price retracement.
Divergence signals tend to be more accurate on the longer time frames. You get fewer false signals. This means fewer trades but if you structure your trade well, then your profit potential can be huge. Divergences on shorter time frames will occur more frequently but are less reliable.

Advanced Swing Trading Strategy with Pcr Part-2The Put-Call Ratio (PCR) is a popular technical indicator used by investors to assess market sentiment. It is calculated by dividing the volume or open interest of put options by call options over a specific time period. A higher PCR suggests bearish sentiment, while a lower PCR indicates bullish sentiment.
So, an average put-call ratio of 0.7 for equities is considered a good basis for evaluating sentiment. In general: A rising put-call ratio, or a ratio greater than 0.7 or exceeding 1, means that equity traders are buying more puts than calls. It suggests that bearish sentiment is building in the market.

All Financial MarketIn India, there exists broadly two types of Financial Markets which are further classified : Money Market is a market that deals with short-term funds. The capital market is a market that deals with long-sighted funds. Lenders and borrowers can trade funds through the financial system.
Different types of financial markets include stock markets, bond markets, forex markets, and commodities markets. Stock markets facilitate the buying and selling of company shares, while bond markets deal with debt securities. Forex markets enable currency exchange, and commodities markets trade physical goods.29 Aug 2024
