Advanced Technical Analysis #DivergenceDivergence is when the price of an asset is moving in the opposite direction of a technical indicator, such as an oscillator, or is moving contrary to other data. Divergence warns that the current price trend may be weakening, and in some cases may lead to the price changing direction.
Cryptomarket

Trading Management and PsychologyWhat are the components of trading psychology?
In this blog, we’ll examine the essential components of trading psychology and offer techniques for cultivating a winning attitude. 1. The Role of Emotions in Trading 2. The Psychology of Risk Management 3. Overcoming Cognitive Biases 4. Developing a Trading Mindset 5. Dealing with Trading Losses 6. The Role of Discipline and Patience 7.

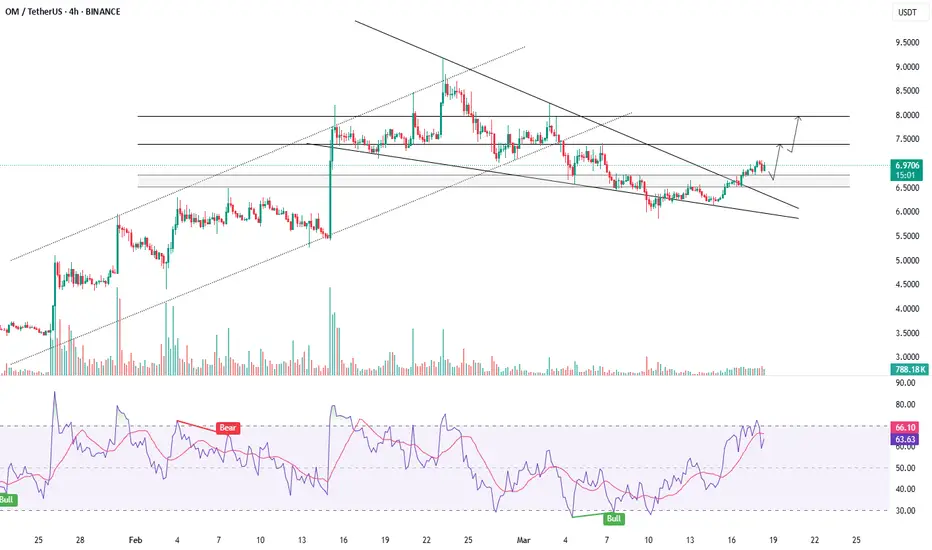
OMUSDT - MAY OUTPERFORM ALTCOINSSymbol - OMUSDT
CMP - 6.8800
OMUSDT demonstrates greater strength compared to the broader market. Following a significant rally, a corrective phase has formed in the shape of a bearish wedge. Subsequently, the price has broken through resistance and is attempting to establish a consolidation above a key support level.
In the context of a generally weak market, OM Coin presents a promising outlook. The technical indicators suggest that there is notable interest in this coin, as the coin is exhibiting resilience and outperforming the market as a whole.
A breakout from the bearish wedge, which is serving as a consolidation pattern within the correction, appears to be underway. Should the bulls manage to sustain the coin's position above the previously breached resistance level and the base of the 6.75 reversal pattern, further growth could be expected in the short to medium term.
Key resistance levels: 7.39, 7.98
Key support levels: 6.75, 6.51
OMUSDT is one of the few assets showing upward momentum while Bitcoin is experiencing a decline. Attention should be given to the aforementioned support levels, as well as the local resistance at 7.05, A breakout above this resistance may trigger a continuation of the upward movement.
Support and Resistance Part -2What is the best support and resistance setting?
Rules For Drawing Support and Resistance
Use swing highs and swing lows in the market to your advantage. ...
Don't worry if the highs and lows don't line up perfectly. ...
Focus on the major (key) levels in the market. ...
Stay within a six-month window.
Tube resistance bands work great for almost any kind of exercise. They're the ultimate solution when it comes to anchored workouts to focus on isolation exercises, and they'll be useful in both upper and lower-body exercise.

Hedera (HBAR) Spot Trade SetupWith HBAR trading at a key support level, this presents a solid long opportunity if buyers step in to defend the zone. A successful bounce could push the price towards key resistance levels.
🛠 Trade Details:
Entry: Around $0.18 (Support Level)
Take Profit Targets:
$0.25 - $0.285 (First TP Zone - Initial Resistance)
$0.35 - $0.39 (Second TP Zone - Major Resistance)
Stop Loss: Just below $0.175
Watching for bullish confirmation before entry. 🚀

Emergence Of Bear Flag Pattern in Bitcoin (BTCUSD)Similar to Nasdaq - ,
Bitcoin (BTCUSD) too forming a Bear Flag.
Similar price action but very high volatility due to news flow.
Lets see where it goes.
Trade Safe

Solana 4H Swing Long Entry Setup - Solana is currently trading at 128.8$
- Solana is trying to shift its market structure to bullish, and this will be confirmed once we see a flip above 136-139$
- Solana on a 4H TF is trying to build a consolidation base which should eventually lead to a larger expansion
- Solana and the whole crypto market is currently waiting for a bullish catalyst in order to move higher
- We have 4 central banks speaking this week all eyes on what Jerome Powell will comment and this will dictate the price action for the upcoming weeks.
- Manage risk properly and don't over risk

$MONGUSDT massive weekly bullish divergenceMASSIVE WEEKLY BULLISH DIVERGENCE
something very big cooking on POLONIEX:MONGUSDT as weekly bullish divergence showing very big move incoming.. Things can get much more bullish than anyone ever thought possible.. Is $MONG gonna pull off 10,000X?!
DONT UNDERESTIMATE WEEKLY BULLISH DIVERGENCE

BTC - M2 Bitcoin seems to be lining up with the M2 (Global Money Supply) at a 105 day offset. This could mean another leg higher for Bitcoin and crypto with a potential blast off May 6th. It looks like we can get a bounce over the next few days as well if this plays out!

Bitcoin (BTCUSD) Rejection – Bearish Move Incoming?📉 Key Observations:
Resistance Zone (Purple Box): Price has tested this area and faced rejection.
Bearish Projection (Gray Box & Arrow): The chart anticipates a drop towards the $76,800 - $77,000 range.
Liquidity Grab? Price might consolidate before a sharp decline.
⚠️ Possible Scenarios:
Rejection Confirmation 🔻: If BTC fails to reclaim $84,470, selling pressure could increase.
Breakout Fakeout? 🤔: A deviation above resistance followed by a dump remains a risk.
🎯 Levels to Watch:
Resistance: $84,470 - $85,078
Support: $80,000 and $76,825
🔥 Final Take: If BTC struggles below resistance, a short setup could play out. Confirmation is key!

Database Trading# **Database Trading**
Database trading leverages **historical market data, AI, and quantitative analysis** to identify high-probability trade setups.
✅ **Data-Driven Approach:** Uses past price action, volume, and indicators.
✅ **Backtesting & Optimization:** Tests strategies on historical data for accuracy.
✅ **Automated Execution:** Uses algorithms for fast, precise trading decisions.
### **Conclusion**
This method enhances **consistency, precision, and risk management**, making trading more systematic and efficient. 🚀

advanced option chain pcr# **Advanced Option Chain PCR**
The **Put-Call Ratio (PCR)** from the option chain helps analyze market sentiment and potential reversals.
✅ **High PCR (>1.3):** Excessive put buying → **Contrarian bullish signal**.
✅ **Low PCR (<0.7):** Excessive call buying → **Contrarian bearish signal**.
✅ **Neutral PCR (0.7 - 1.3):** Market in equilibrium → Watch for breakouts.
### **Advanced Strategies**
✅ **PCR with Open Interest (OI):** High OI + extreme PCR = **stronger trend confirmation**.
✅ **PCR Divergence:** If the market rises but PCR increases → **Weak rally signal**.
✅ **Intraday PCR Shifts:** Sudden changes indicate **smart money activity**.
### **Conclusion**
Advanced **option chain PCR** helps traders **gauge market sentiment, confirm trends, and refine entry-exit points** for better trading decisions. 🚀

advanced level pcr trading# **Advanced PCR Trading**
Put-Call Ratio (**PCR**) helps traders gauge **market sentiment and reversals** by analyzing option volumes.
✅ **High PCR (>1):** More puts than calls → **Bearish sentiment** (possible reversal up).
✅ **Low PCR (<0.5):** More calls than puts → **Bullish sentiment** (possible reversal down).
✅ **Neutral PCR (0.5 - 1):** Market indecisive → Watch for breakouts.
### **Advanced PCR Strategies**
✅ **Trend Confirmation:** Use with **support & resistance** for accuracy.
✅ **Divergence Analysis:** If price rises but PCR increases, **weak rally signal**.
✅ **PCR with Open Interest (OI):** High OI + PCR extremes = **stronger trend signals**.
### **Conclusion**
Advanced PCR trading helps **spot reversals, confirm trends, and refine market timing** for better decision-making. 🚀

support and resistance part 2# **Database Trading**
Database trading uses **historical data, AI, and algorithms** to find high-probability trades. It removes emotions, making trading systematic.
✅ **Data-Driven:** Uses price action, volume, and indicators.
✅ **Backtesting:** Tests strategies on past data for accuracy.
✅ **Automation:** Executes trades efficiently with algorithms.
### **Conclusion**
This method enhances **consistency, precision, and risk management**, making it ideal for modern traders. 🚀

support and resistance part 1# **Support and Resistance (Part 1)**
Support and resistance are **key price levels** where buying or selling pressure is strong, influencing market movements.
## **1️⃣ Understanding Support & Resistance**
✅ **Support:** A price level where demand increases, preventing further decline.
✅ **Resistance:** A price level where selling pressure increases, stopping further rise.
## **2️⃣ Why Are They Important?**
✅ **Trend Reversals:** Price often bounces from these levels.
✅ **Breakouts & Retests:** A break of resistance turns it into support and vice versa.
✅ **High-Probability Trade Entries:** Used for setting stop-loss & profit targets.
### **Conclusion**
Mastering support and resistance helps traders **identify trend changes, entry points, and risk management levels**, making it a crucial trading tool. 🚀

overview of financial markets# **Overview of Financial Markets**
Financial markets facilitate the **buying, selling, and exchange of financial assets**, driving economic growth and investment opportunities.
## **1️⃣ Types of Financial Markets**
✅ **Stock Market:** Trading of company shares (e.g., NSE, BSE).
✅ **Bond Market:** Governments & corporations issue debt securities.
✅ **Forex Market:** Global currency trading with high liquidity.
✅ **Commodities Market:** Gold, oil, and agricultural products.
✅ **Derivatives Market:** Futures & options for hedging and speculation.
## **2️⃣ Key Functions**
✅ **Capital Formation:** Helps businesses raise funds.
✅ **Liquidity:** Ensures smooth asset transactions.
✅ **Risk Management:** Hedging through derivatives.
### **Conclusion**
Financial markets play a **crucial role in wealth creation, economic stability, and investment diversification**, making them essential for traders and investors. 🚀

Death Cross on Solana Daily TFLooks scary. last time a proper death cross lasted 2 years.
Let me know your suggestions and ideas!

Very good shorting opportunity in btc. Setup explained Btc is falling from 1hour supply zone. It has failed rmed M pattern also. Good risk reward trade. Manage risk

divergence secrets of RSI# **Divergence Secrets of RSI**
RSI divergence helps traders identify **hidden market momentum shifts** before price movements occur, making it a powerful tool for **reversals and trend continuations**.
## **1️⃣ Types of RSI Divergence**
✅ **Regular Divergence (Reversal Signal):**
🔹 **Bullish:** Price ↓, RSI ↑ → **Trend reversal upward**.
🔹 **Bearish:** Price ↑, RSI ↓ → **Trend reversal downward**.
✅ **Hidden Divergence (Trend Continuation):**
🔹 **Bullish:** Price ↑, RSI ↓ → **Trend continuation up**.
🔹 **Bearish:** Price ↓, RSI ↑ → **Trend continuation down**.
## **2️⃣ Advanced RSI Divergence Trading**
✅ **Multi-Timeframe Analysis:** Stronger signals when confirmed across different timeframes.
✅ **Volume Confirmation:** Divergence + high volume = stronger trade setups.
✅ **Support & Resistance Zones:** Combine RSI divergence with key levels for precise entries.
### **Conclusion**
RSI divergence is a **highly effective strategy** for spotting early trend reversals and continuations, improving trade accuracy and risk management. 🚀

Lecture for option trader# **Lecture for Option Traders**
Options trading provides **flexibility, leverage, and risk management**, making it ideal for traders seeking strategic market exposure.
## **1️⃣ Understanding Option Basics**
✅ **Call Options:** Right to **buy** at a fixed price (bullish).
✅ **Put Options:** Right to **sell** at a fixed price (bearish).
✅ **Strike Price & Expiry:** Determines profitability based on market movement.
## **2️⃣ Key Option Trading Strategies**
✅ **Directional Strategies:** Buying calls/puts based on market trends.
✅ **Hedging Strategies:** Using options to protect against losses (e.g., protective put).
✅ **Income Strategies:** Writing covered calls or selling cash-secured puts for steady returns.
## **3️⃣ Advanced Concepts**
✅ **Implied Volatility (IV):** Affects option pricing & premiums.
✅ **Option Greeks:** Delta, Gamma, Theta, Vega help manage risk & profitability.
### **Conclusion**
Mastering **option strategies, risk management, and market analysis** helps traders enhance returns and minimize losses effectively. 🚀

Database Trading# **Database Trading**
**Database Trading** is a strategy that uses **historical market data, quantitative analysis, and AI-driven algorithms** to identify high-probability trading opportunities.
## **1️⃣ Key Concepts**
✅ **Data-Driven Decision Making:** Trades based on **past price patterns, volume, and indicators**.
✅ **Backtesting & Optimization:** Analyzing historical performance to refine strategies.
✅ **Algorithmic Execution:** Automating trades for efficiency and accuracy.
## **2️⃣ How to Trade Using Database Methods**
✅ **Pattern Recognition:** Identifying recurring market behaviors.
✅ **Statistical Edge:** Using probability-based models for trade entries.
✅ **Risk Management:** Adjusting position sizing based on past volatility trends.
### **Conclusion**
Database trading helps traders **eliminate emotions, improve accuracy, and develop systematic trading strategies**, making it a powerful approach in modern markets. 🚀

what is RSI and how to use it ?# **What is RSI and How to Use It?**
The **Relative Strength Index (RSI)** is a momentum indicator that measures the **speed and change of price movements**, helping traders identify **overbought and oversold conditions**.
## **1️⃣ RSI Levels & Interpretation**
✅ **Above 70:** Overbought → Possible **reversal or correction**.
✅ **Below 30:** Oversold → Possible **bounce or trend reversal**.
✅ **50 Level:** Midpoint indicating trend strength (above 50 = bullish, below 50 = bearish).
## **2️⃣ How to Use RSI in Trading**
✅ **Overbought & Oversold Trading:** Look for reversals near **70 or 30**.
✅ **Divergence Trading:**
🔹 **Bullish Divergence:** Price ↓, RSI ↑ → **Buy signal**.
🔹 **Bearish Divergence:** Price ↑, RSI ↓ → **Sell signal**.
✅ **RSI Trend Confirmation:** Use with **support-resistance and moving averages** for accuracy.
### **Conclusion**
RSI helps traders **spot trend reversals, confirm momentum, and refine trade entries**, making it a valuable tool for market analysis. 🚀

Option trading# **Option Trading**
**Options trading** allows traders to speculate on price movements or hedge risks using **call and put contracts**. It provides leverage and flexibility with controlled risk.
## **1️⃣ Key Option Types**
✅ **Call Option:** Right to **buy** an asset at a fixed price.
✅ **Put Option:** Right to **sell** an asset at a fixed price.
## **2️⃣ Option Trading Strategies**
✅ **Buying Calls/Puts:** Directional trades based on market movement.
✅ **Covered Call:** Selling a call against owned shares for premium income.
✅ **Iron Condor:** Profit from low volatility with limited risk.
### **Conclusion**
Options trading helps traders **maximize profits, hedge risks, and trade with leverage**, making it a powerful tool for market participants. 🚀
